Fibonacci Support Resistance with any Values MT4
- Indikatoren
- Version: 5.54
- Aktualisiert: 23 März 2020
- Aktivierungen: 5

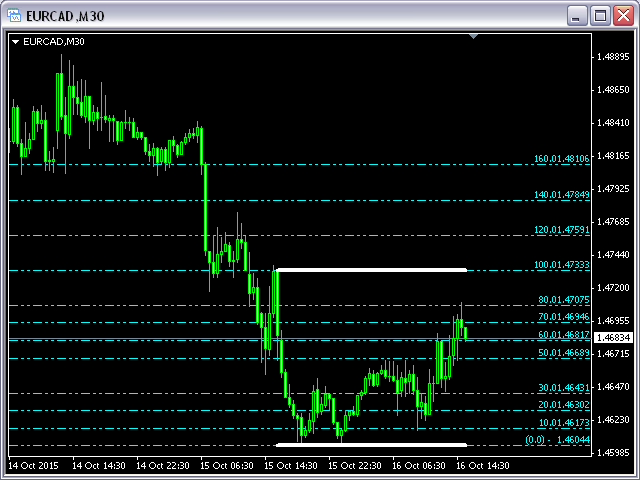
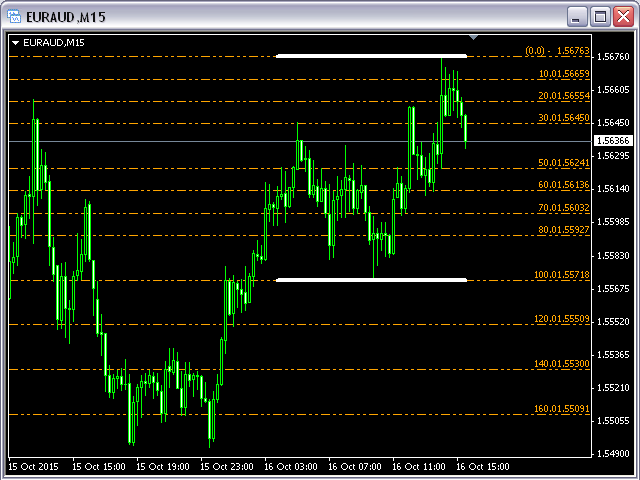
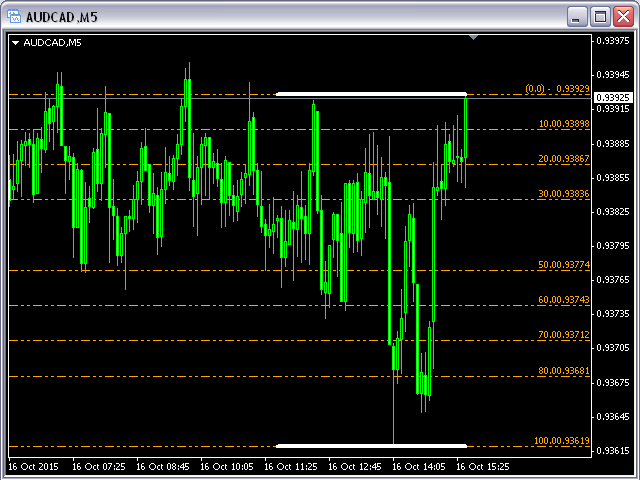
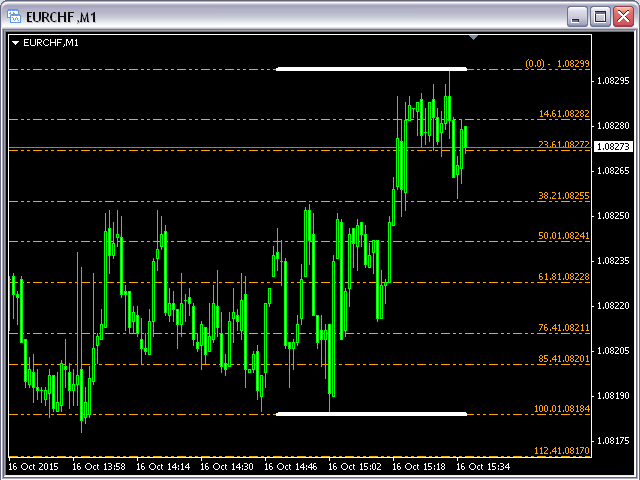
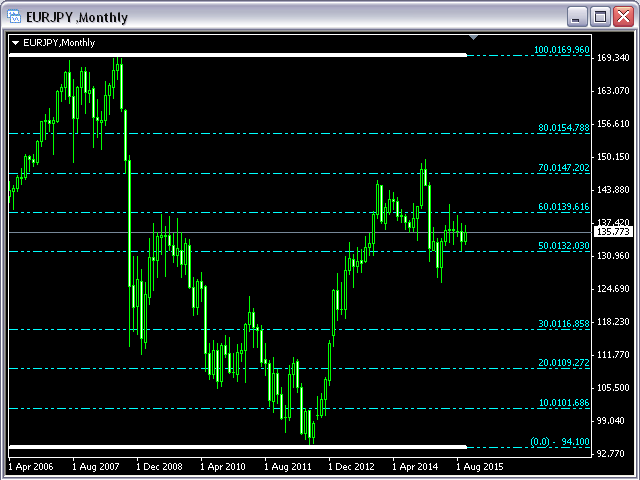
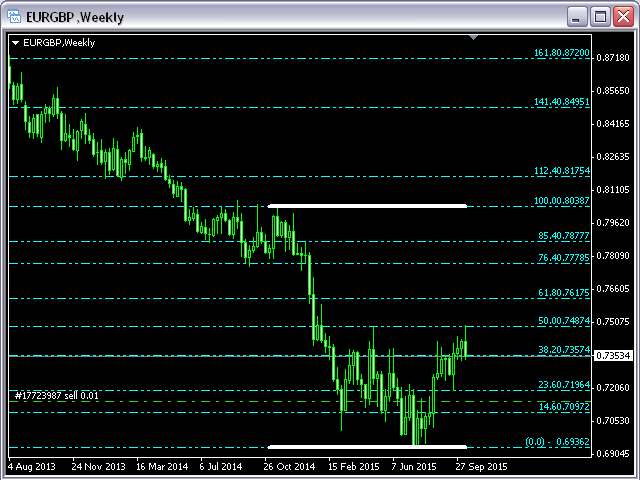
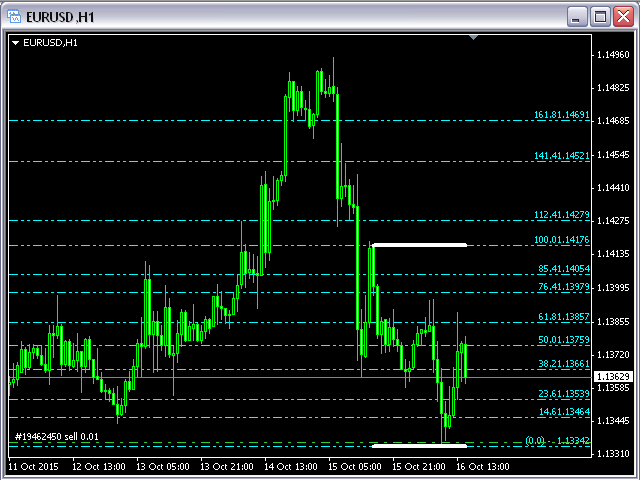
Dieser Indikator zeichnet Unterstützungs- und Widerstandslinien, die auf der Grundlage des nBars-Abstands berechnet werden.
Die Fibonacci-Linien werden zwischen diesen 2 Linien und 3 Niveaus über oder unter 100% angezeigt.
Sie können den Wert jedes Levels ändern und eine Linie im Bereich 0-100% und alle Levels über oder unter 100% ausblenden.
Eingabe-Parameter:
- nBars = 24; - Anzahl der Bars, bei denen die Berechnung von Support und Resistance durchgeführt wird.
- Fibo = true; wenn false, werden nur Support und Resistance angezeigt.
- Level_1 = true; - Anzeige des Fibonacci-Levels.
- Fibo_Level_1 = 0.146; - der Wert des Fibonacci-Levels.
- ...
- FiboColorUp = Aqua;
- FiboColorDn = Orange;