Fibonacci Support Resistance with any Values MT4
- Indicadores
- Versión: 5.54
- Actualizado: 23 marzo 2020
- Activaciones: 5

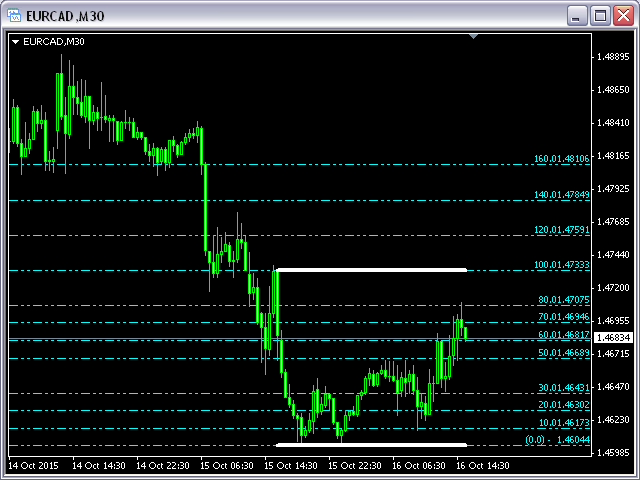
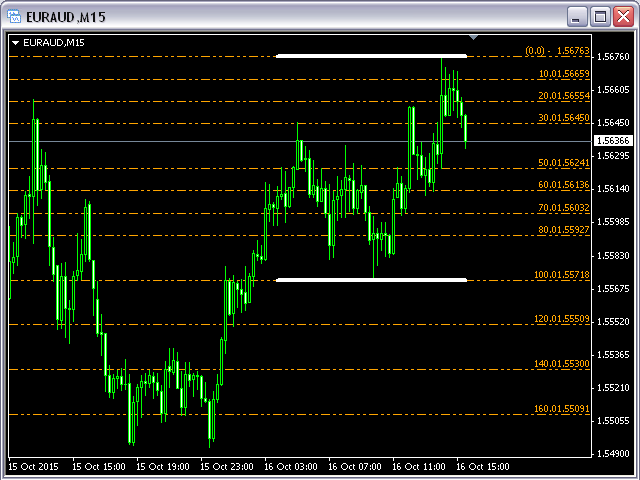
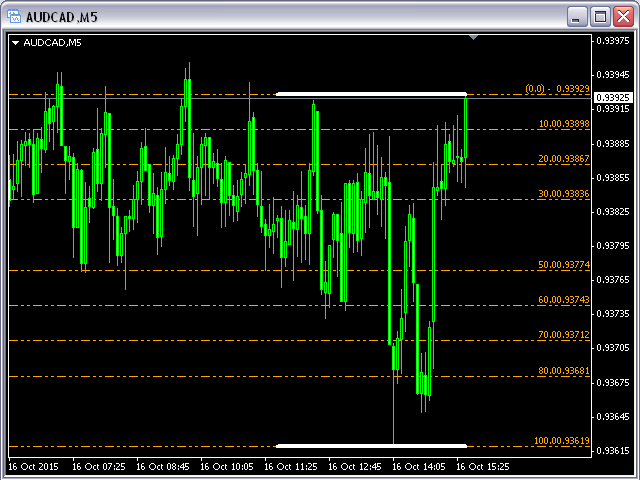
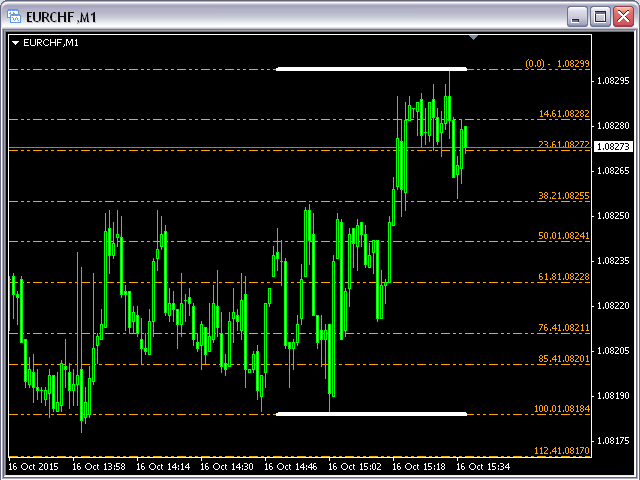
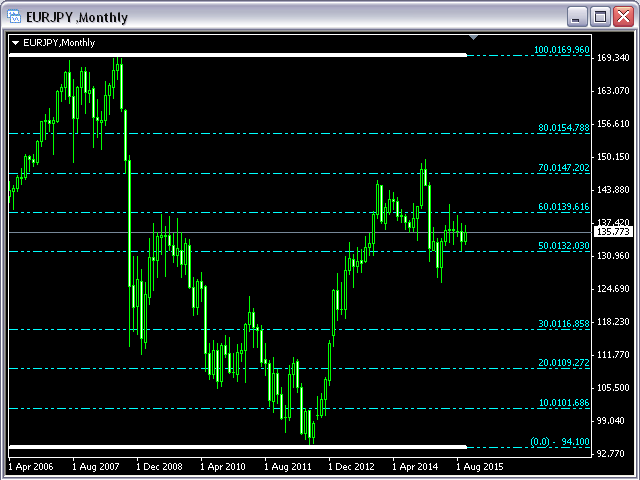
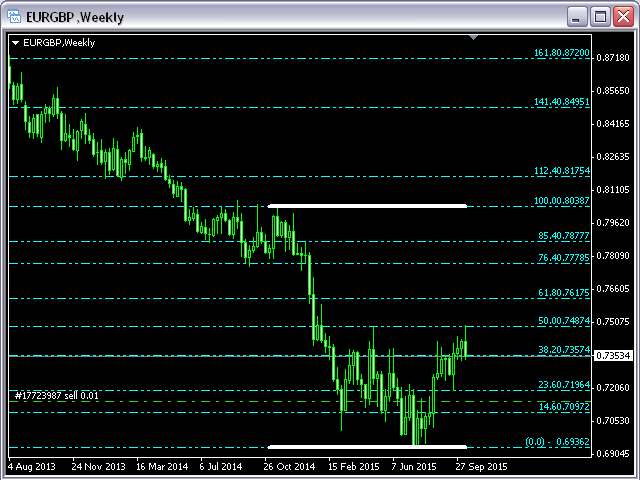
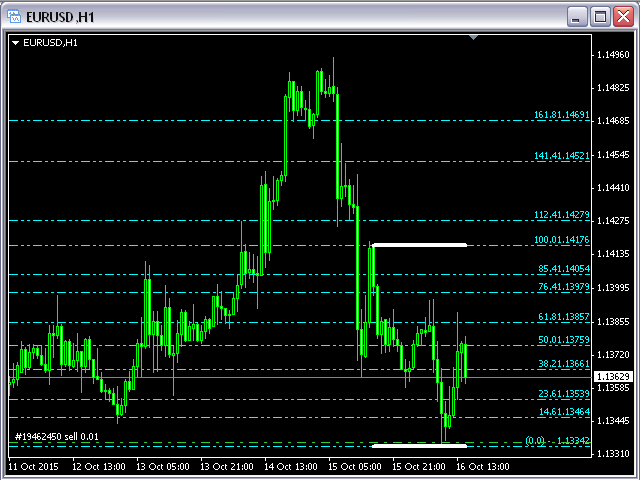
Este indicador dibujará líneas de Soporte y Resistencia calculadas sobre la distancia nBars.
Las líneas de Fibonacci aparecerán entre esas 2 líneas y 3 niveles por encima o por debajo del 100%.
Puede cambiar el valor de cada nivel y ocultar una línea dentro del rango 0-100% y todos los niveles por encima o por debajo del 100%.
Parámetros de entrada:
- nBars = 24; - cantidad de barras donde se hará el cálculo de Soporte y Resistencia.
- Fibo = true; si es false sólo se mostrarán el Soporte y la Resistencia.
- Nivel_1 = true; - muestra el nivel Fibonacci.
- Fibo_Level_1 = 0.146; - el valor del nivel Fibonacci.
- ...
- FiboColorUp = Aqua;
- FiboColorDn = Naranja;