Crazy Dancing Levels
- Indikatoren
- Version: 2.21
- Aktivierungen: 5

Crazy Dancing bewegte RES/SUP Levels
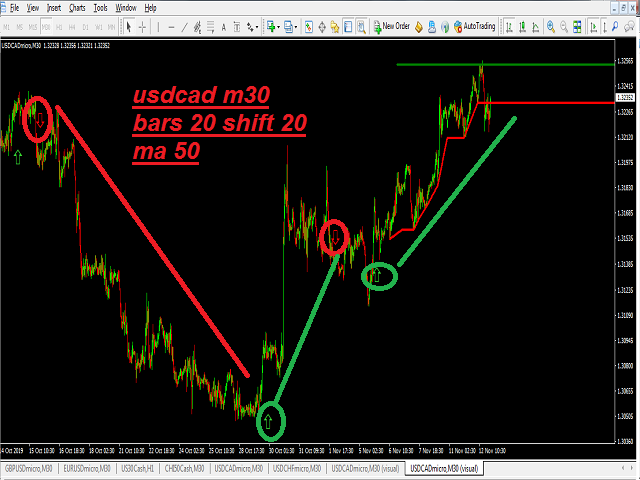
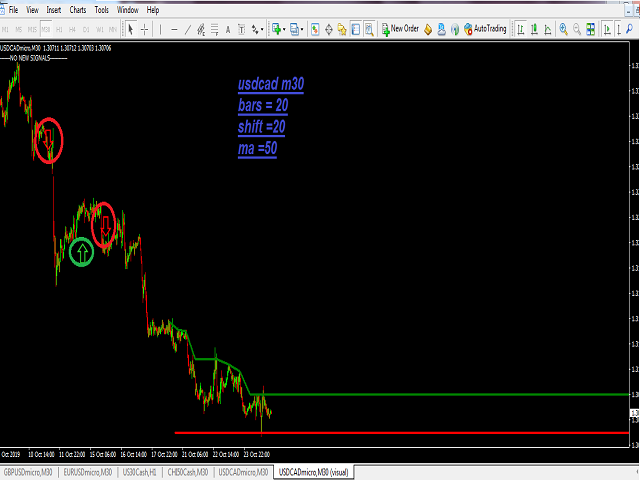
Automatisches Neuzeichnen von gleitenden Unterstützungs- und Widerstandsebenen
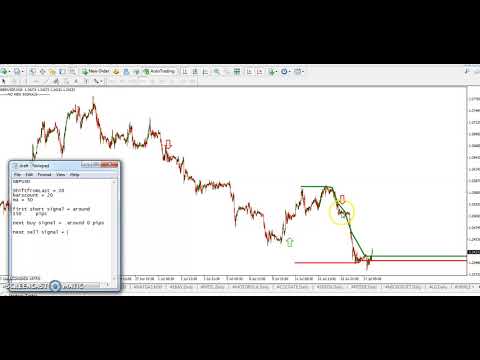
um anzuzeigen, dass der Preis Unterstützungen durchbricht (Signal SELL)
oder das Durchbrechen von Widerstandsniveaus (Signal BUY)
Sehr einfach erscheinender Indikator, aber auch sehr clever und intelligent !!!!
Wichtigste Eingaben:
# Anzahl der Balken für die Unterstützungs- und Widerstandsniveaus + die anfängliche Verschiebung vom Startpunkt + gleitender Durchschnitt für die Filtersignalisierung
Kleinere Werte für Balken / Shift-Eingaben bei höheren Zeitrahmen (D1-H4) und umgekehrt höhere Werte für niedrigere Zeitrahmen (M30-M5)
* ein Pfeil nach oben/unten im Falle von Bären-/Bullenmarktchancen
* Sie können auch die Farben der oberen/unteren gleitenden Ebenen verwalten
* ALERTS aktivieren/deaktivieren
Ein sehr hilfreicher und intelligenter Indikator für alle Zeitrahmen und alle Symbole
MEINE BEVORZUGTEN EINSTELLUNGEN:
H1: Anzahl der Balken = 5 bis 20; ShiftFromStar = 10-20; MA = 25
M30: Anzahl der Balken = 10 bis 40; ShiftFromStar = 25-50; MA = 50
M1: Anzahl der Balken = 500 -1000; ShiftFromStar = 500-1000; MA = 1000
Sie werden die besten Kombinationen von Eingaben finden, die zu Ihrer Handelsstrategie passen!