Pro Sessions MT5
- 指标
- 版本: 1.90
- 更新: 16 四月 2024
- 激活: 10

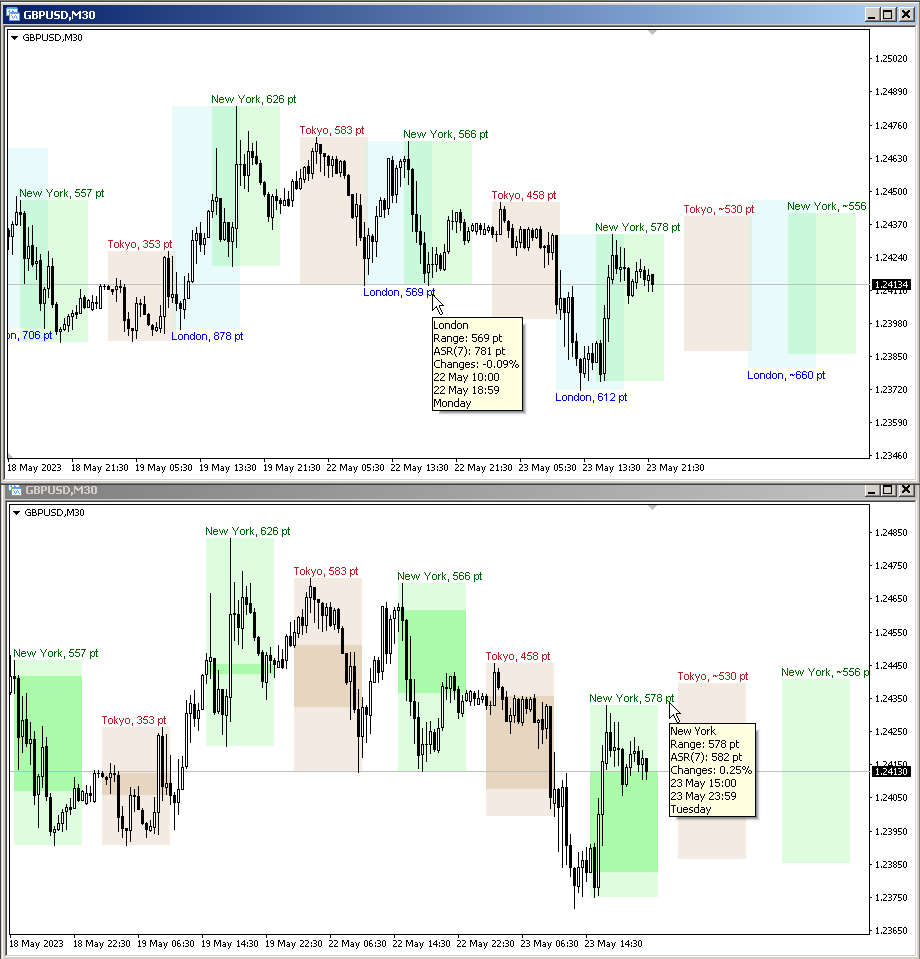
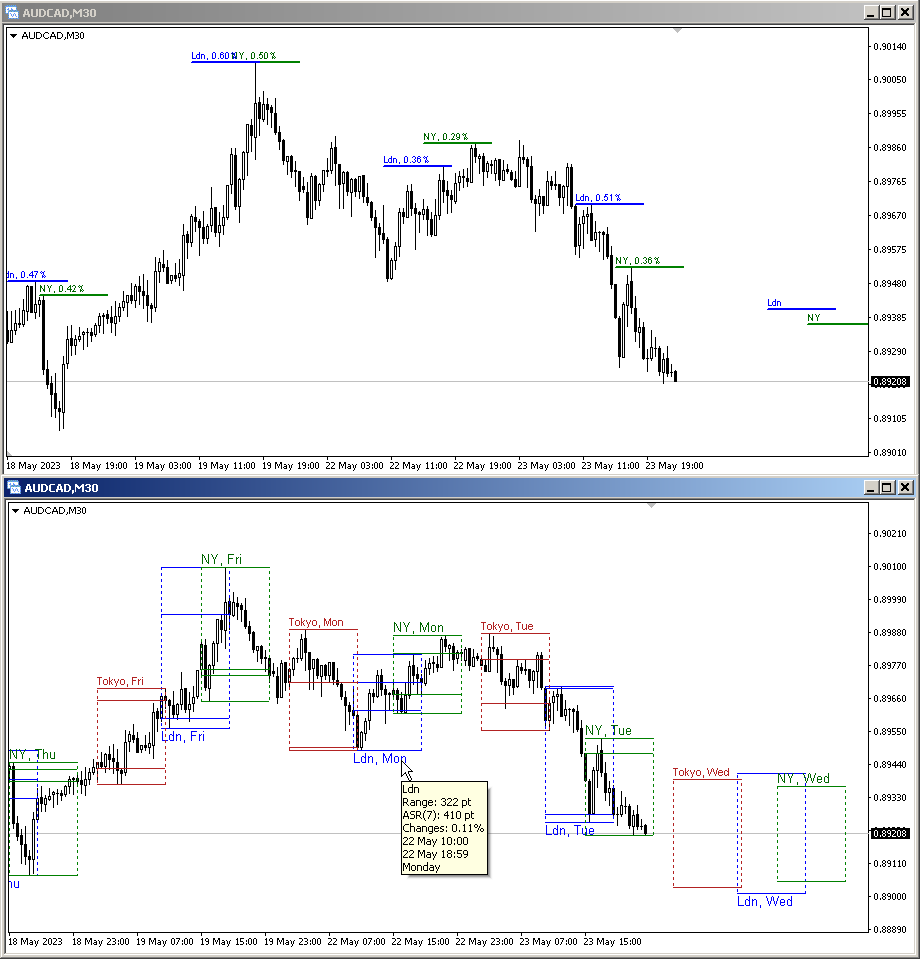
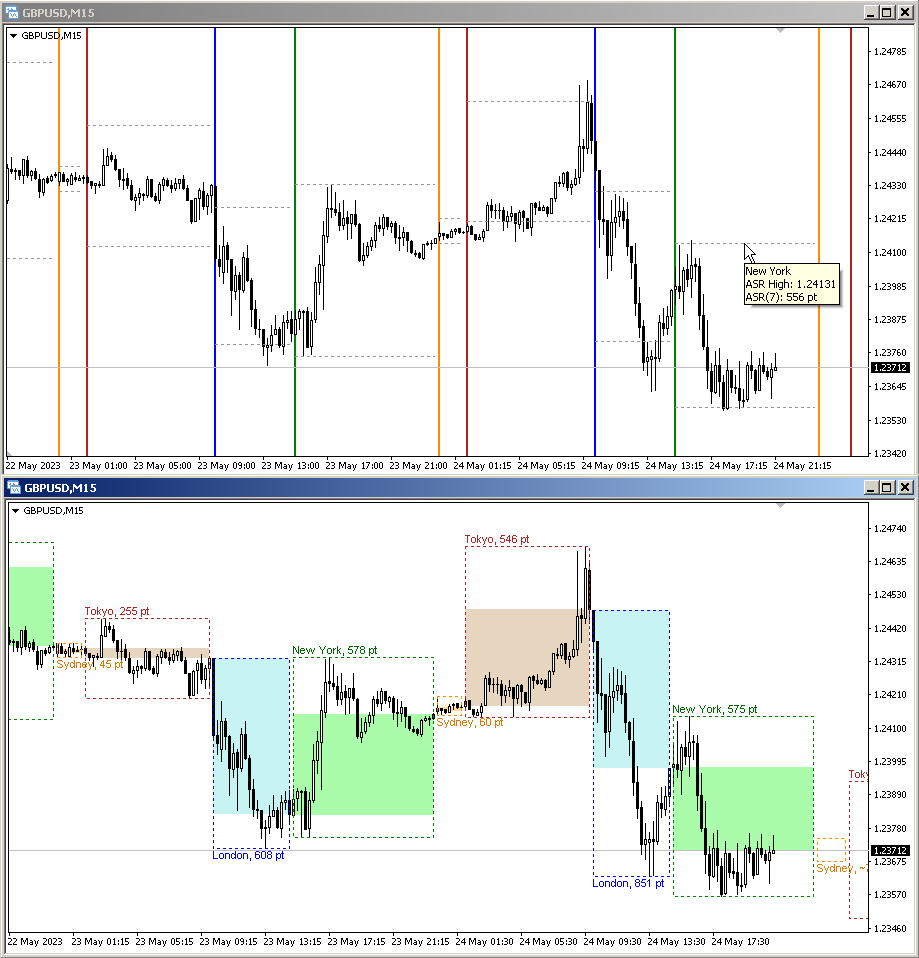
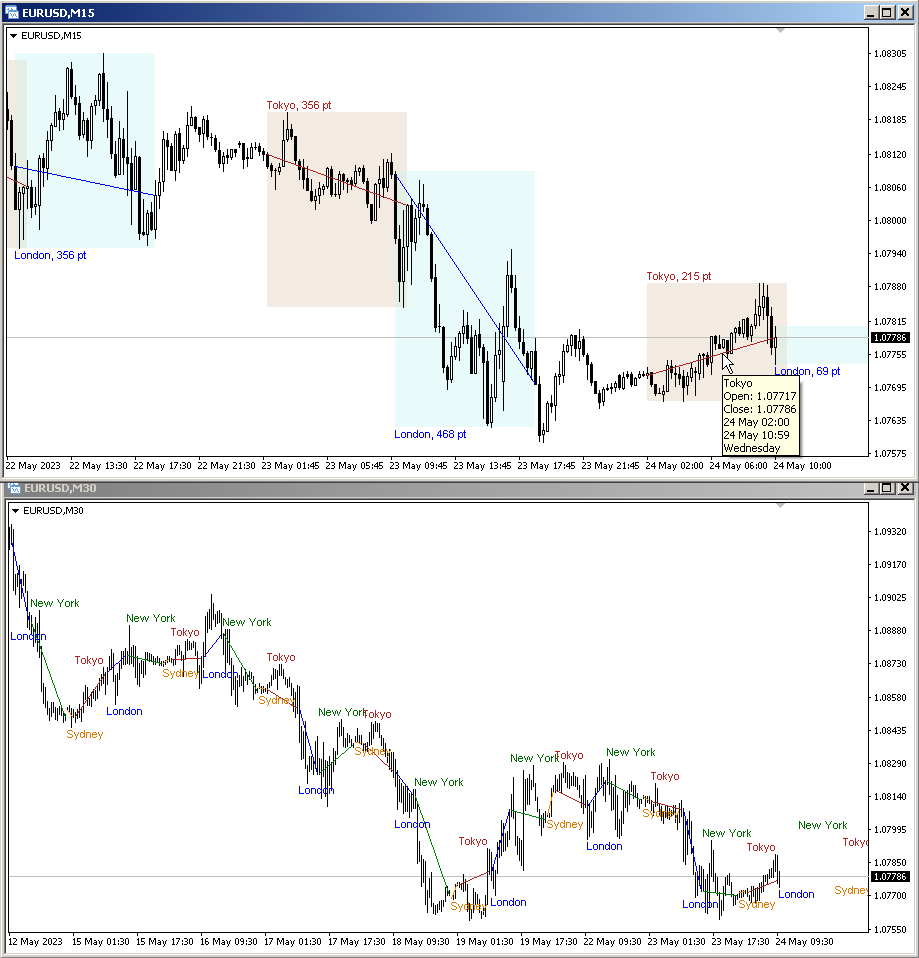
这是一个交易时段指标,可以显示四个交易时段的所有级别(开盘价-最高价-最低价-收盘价)。 该指标还可以预测会话级别。 会话可以用线条或矩形(空的或填充的)绘制,线条可以延伸到下一个会话。 您可以通过按热键(默认为“1”、“2”、“3”、“4”)轻松隐藏/显示每个会话.
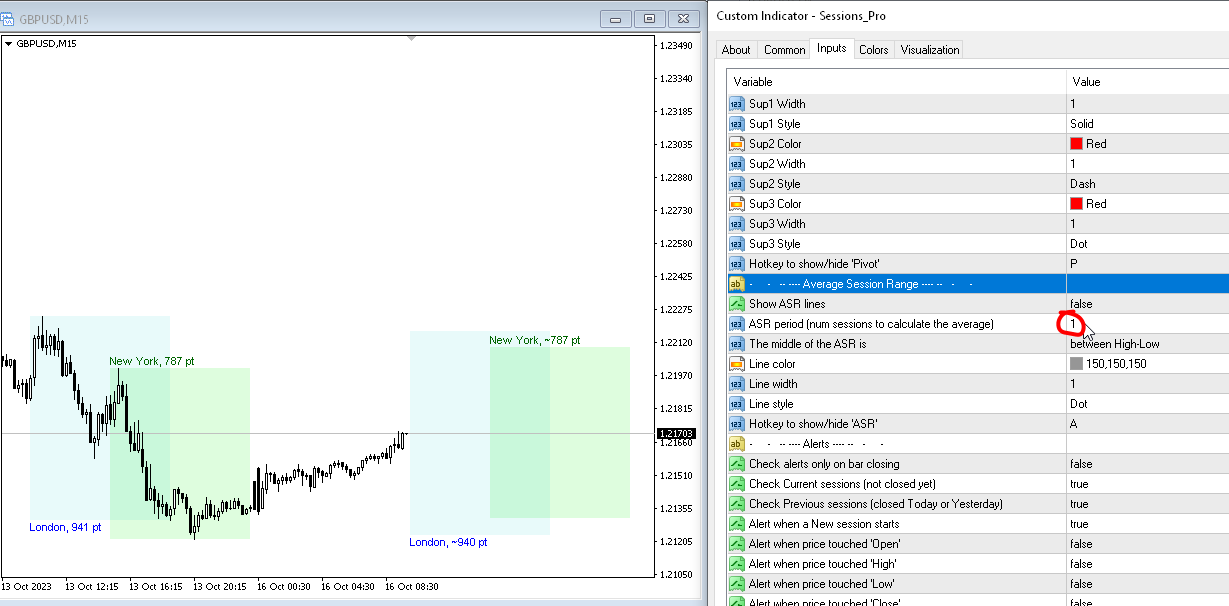
您可以看到 ASR(平均会话范围)线(默认热键“A”)。 这与 ADR 计算类似,只是它是根据最后一个 X 交易时段计算的,这使您可以看到当前(和之前)交易时段的潜在范围(今天价格可以移动多远)。 平均值的计算方式为之前会话的总和除以会话数(参数“ASR 周期(计算平均值的会话数)”),每个会话都有自己的 ASR 值。
该指标计算并绘制未来的会话及其大小。 正确识别报价历史记录中的漏洞。
它还可以在每个会话开始时绘制垂直分隔符。
指标自动确定图表的配色方案。
当价格触及会话水平或价格突破已关闭会话指定距离时,它还会发送警报。 可以禁用每个会话的警报。
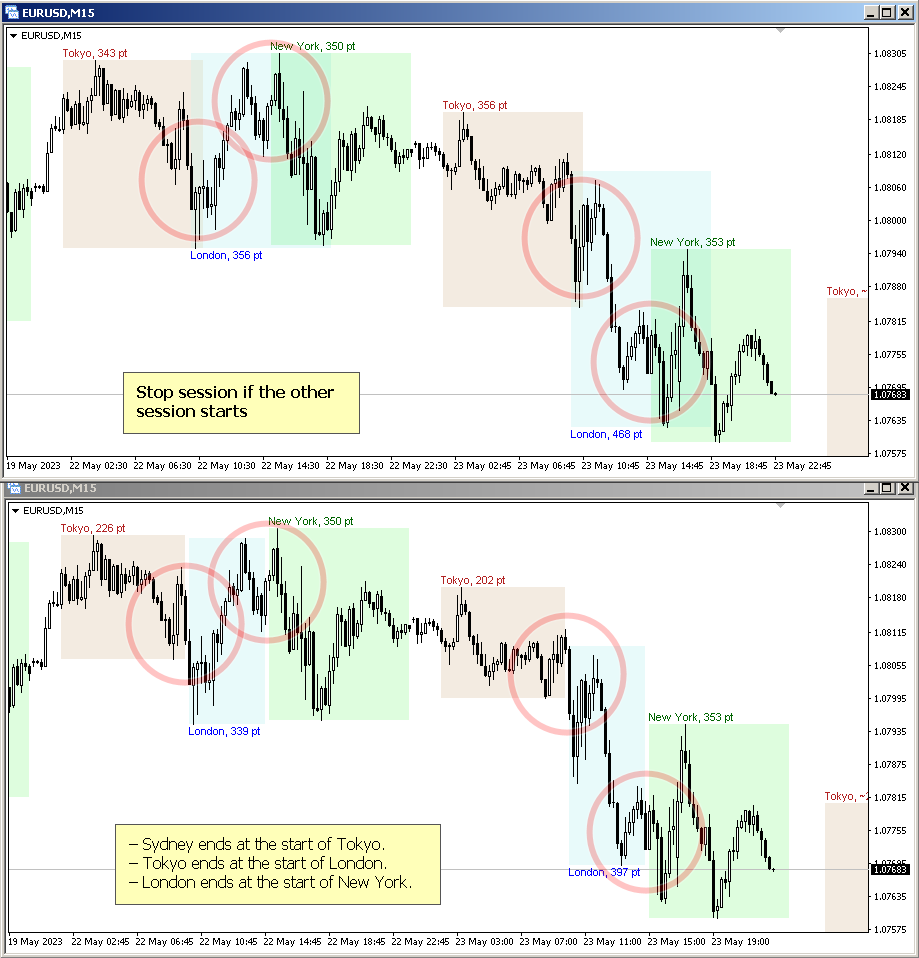
参数“如果其他会话启动则停止会话”(热键“S”)允许您停止过时的会话,并在新会话中断时接收警报。
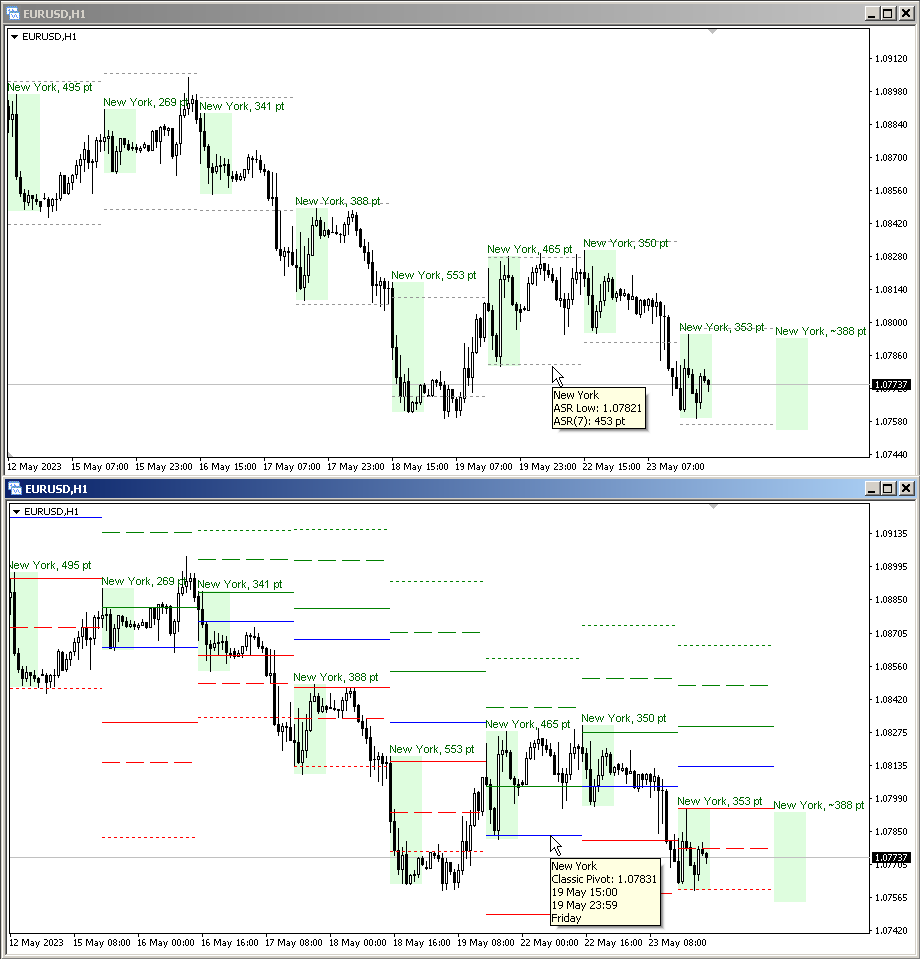
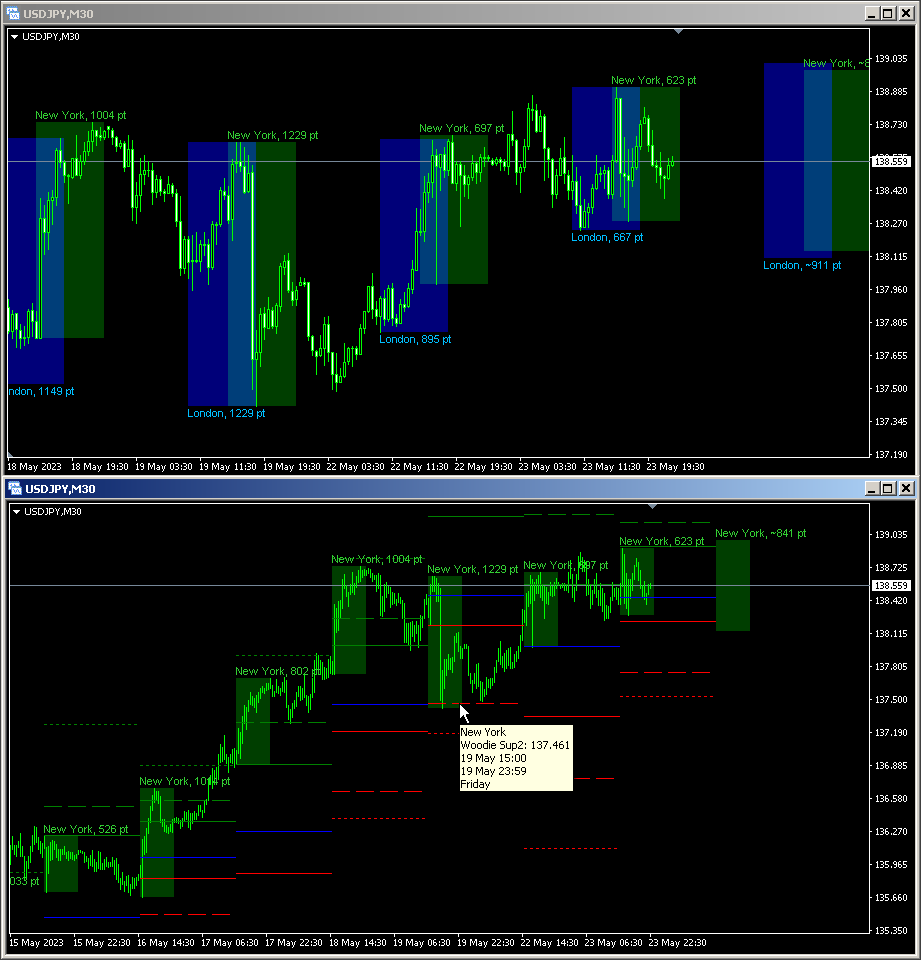
该指标可以绘制枢轴水平并就其发送警报。 这些级别是根据之前会话的值计算的(默认热键“P”).
参数
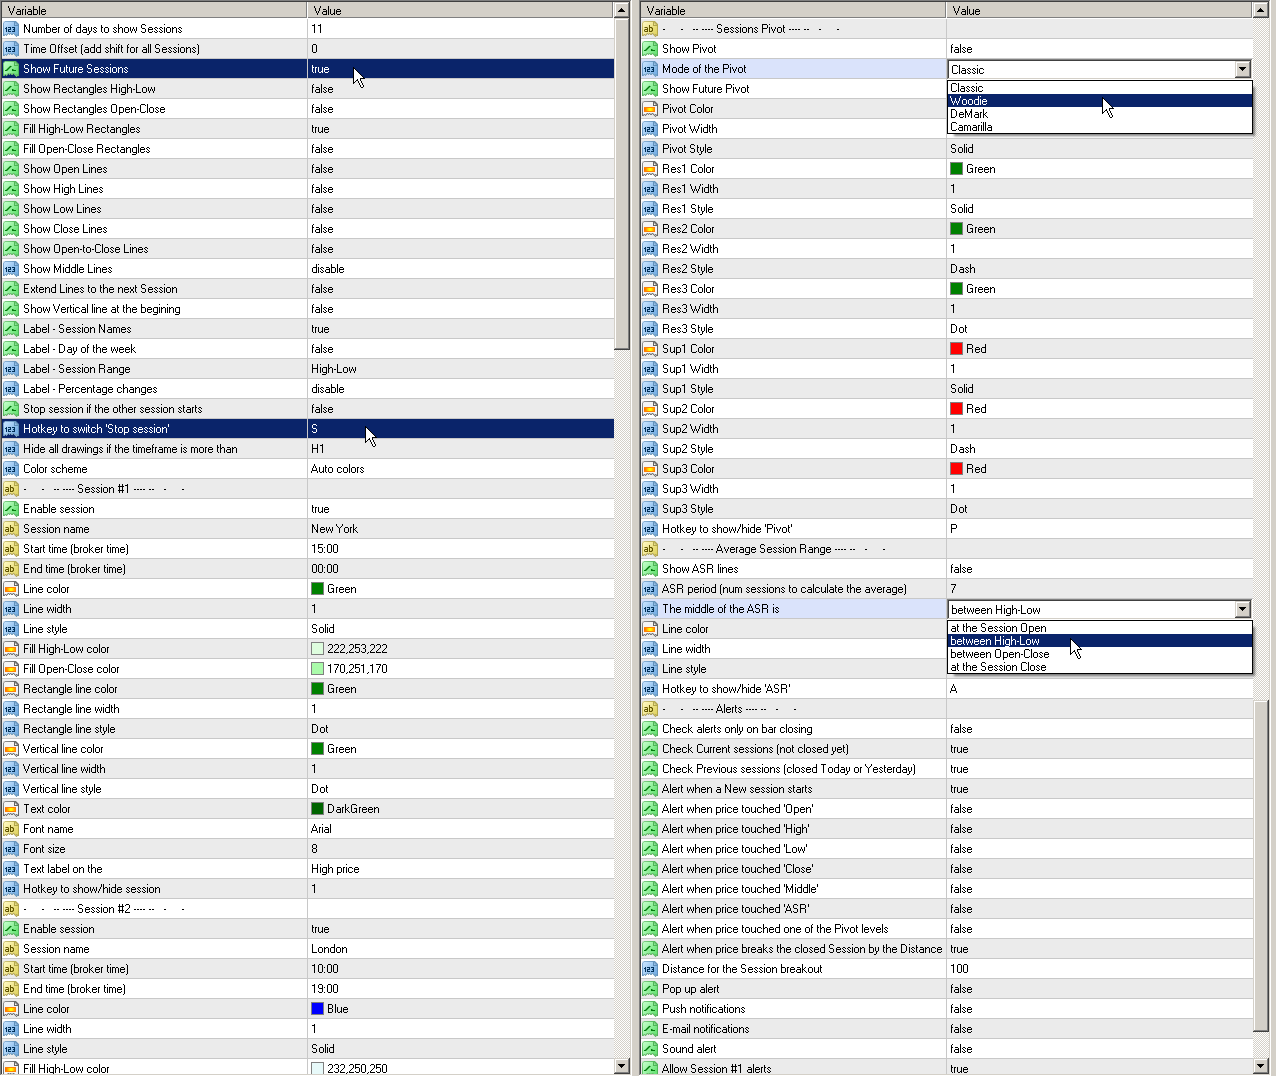
Number of days to calculate — 抽奖天数。
Time Offset (add shift for all Sessions) — 时间偏移(为所有会话添加班次)。
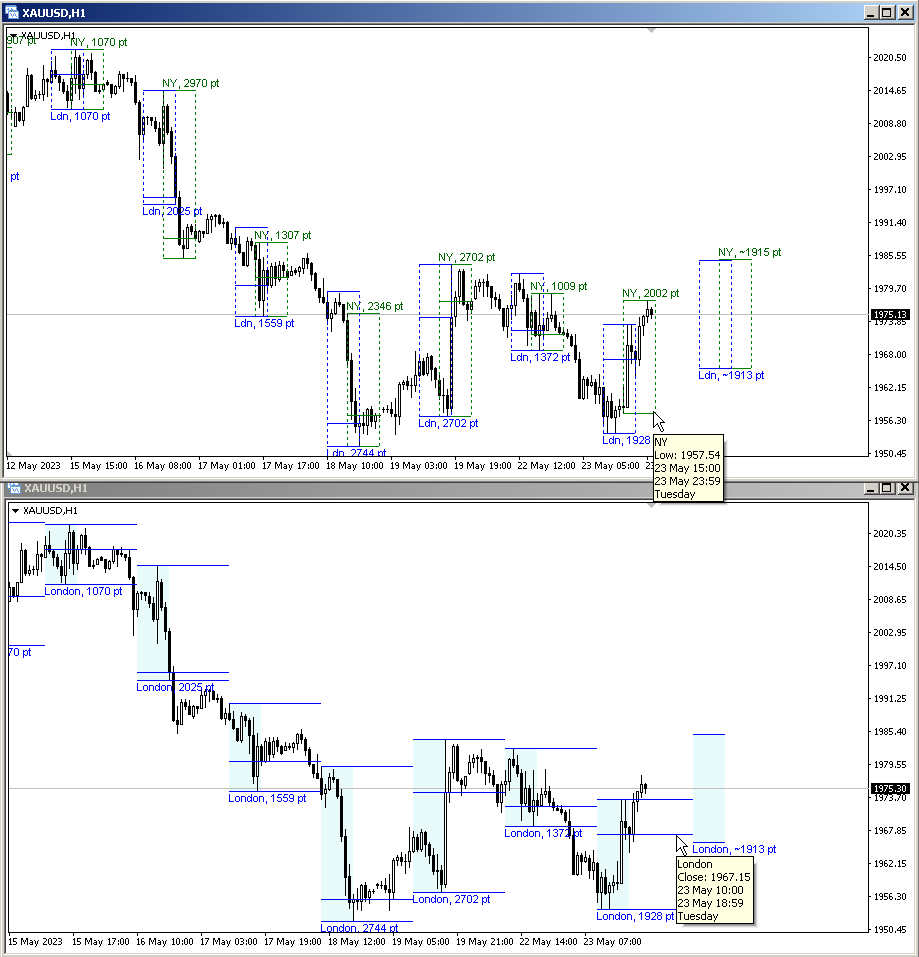
Show Future Sessions — 显示未来的预期会议。
Show Open lines — 显示开放线路。
Show High lines — 显示高线。
Show Low lines — 显示低线。
Show Close lines — 显示关闭线。
Show Middle lines (between High-Low) — 显示中线(高低之间)
Extend lines to the next Session — 将线路延长到下一个会话。
Show Rectangles High-Low — 显示矩形高低。
Show Rectangles Open-Close — 显示矩形开闭。
Fill High-Low — 填充高低。
Fill Open-Close — 填充开闭。
Show Vertical line at the begining — 在开头显示垂直线。
Show Session Names — 显示会话名称。
Show Day of the week — 显示星期几。
Show Session Range — 显示会话范围。
Show Percentage changes — 显示交易时段开盘价和收盘价之间或交易时段高点和低点之间的价格百分比变化。
Stop session if the other session starts — 悉尼在东京开始时结束。 东京的终点是伦敦的起点。伦敦的终点是纽约的起点。
Hotkey to switch 'Stop session' — 切换“停止会话”的热键
Color scheme — 配色方案。
第 1 节
Enable session — 启用会话。
Session name — 会话名称。
Start time (broker time) — 开始时间(经纪人时间)。
End time (broker time) — 结束时间(经纪人时间)。
Line color — 线条颜色。
Line width — 行宽。
Line style — 线条样式。
Fill High-Low color — 填充高低颜色。
Fill Open-Close color — 填充开闭颜色。
Rectangle line color — 矩形线条颜色。
Rectangle line width — 矩形线宽。
Rectangle line style — 矩形线条样式。
Vertical line color — 垂直线颜色。
Vertical line width — 垂直线宽。
Vertical line style — 垂直线条样式。
Text color — 文字颜色。
Font name — 字体名称。
Font size — 字体大小。
Text label on the — 上的文字标签。
Hotkey to switch session — 切换会话的热键。
会话 #2、#3、#4 的参数相同。
会话枢轴 ( Sessions Pivot )
Show Pivot — 显示枢轴
Mode of the Pivot — 枢轴模式:
- Classic
- Woodie
- DeMark
- Camarilla
Show Future Pivot — 显示未来枢轴。
平均会话范围 ( Average Session Range )
Show ASR lines — 显示 ASR 线。
ASR period (num sessions to calculate the average) — ASR 周期(计算平均值的会话数)。
The middle of the ASR is: — ASR 的中间部分是:
- at the Session Open — 在会议开幕式上
- between High-Low — 高低之间
- between Open-Close — 开-关之间
- at the Session Close — 会议结束时
Hotkey to switch 'ASR' — 切换“ASR”的热键。
警报
Check Current sessions (not closed yet) — 检查当前会话(尚未关闭)
Check Previous sessions (closed Today or Yesterday) — 查看之前的会议(今天或昨天关闭)
Alert when price touched 'Open' — 当价格触及“开盘”时发出警报
Alert when price touched 'High' — 当价格触及“高位”时发出警报
Alert when price touched 'Low' — 当价格触及“低”时发出警报
Alert when price touched 'Close' — 当价格触及“收盘价”时发出警报
Alert when price touched 'Middle' — 当价格触及“中间”时发出警报
Alert when price touched 'ASR' — 当价格触及“ASR”时发出警报
Alert when price touched one of the Pivot levels — 当价格触及某一枢轴水平时发出警报
Check alerts only on bar closing — 仅在柱关闭时检查警报
Alert when a New session starts — 新会话开始时发出警报
Alert when price breaks the closed Session by the Distance — 当价格突破收盘时段的距离时发出警报
Distance for the Session breakout — 会话突破的距离
Pop up alert — 弹出警报
Push notifications — 推送通知
E-mail notifications — 电子邮件通知
Sound alert — 声音警报
Allow Session #1 alerts — 允许会话 #1 警报
Allow Session #2 alerts — 允许会话 #2 警报
Allow Session #3 alerts — 允许会话 #3 警报
Allow Session #4 alerts — 允许会话 #4 警报


It is an essential indicator for international traders. I am very satisfied. Simple and great results, I don't have to look at the clock every time. And a friendly creator. Why don't you buy this?