ZigZag Dashboard for MT5
- 指标
- 版本: 6.40
- 更新: 17 六月 2026
- 激活: 10

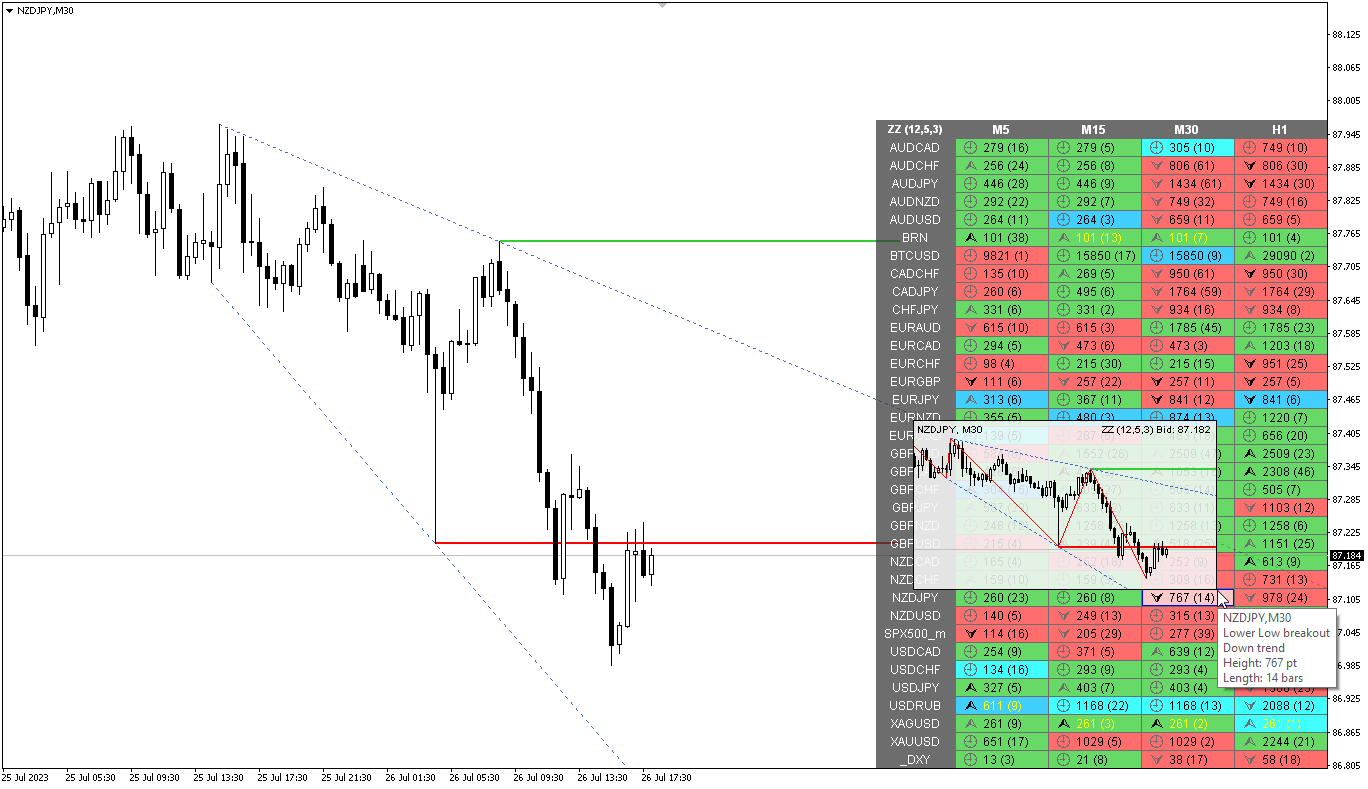
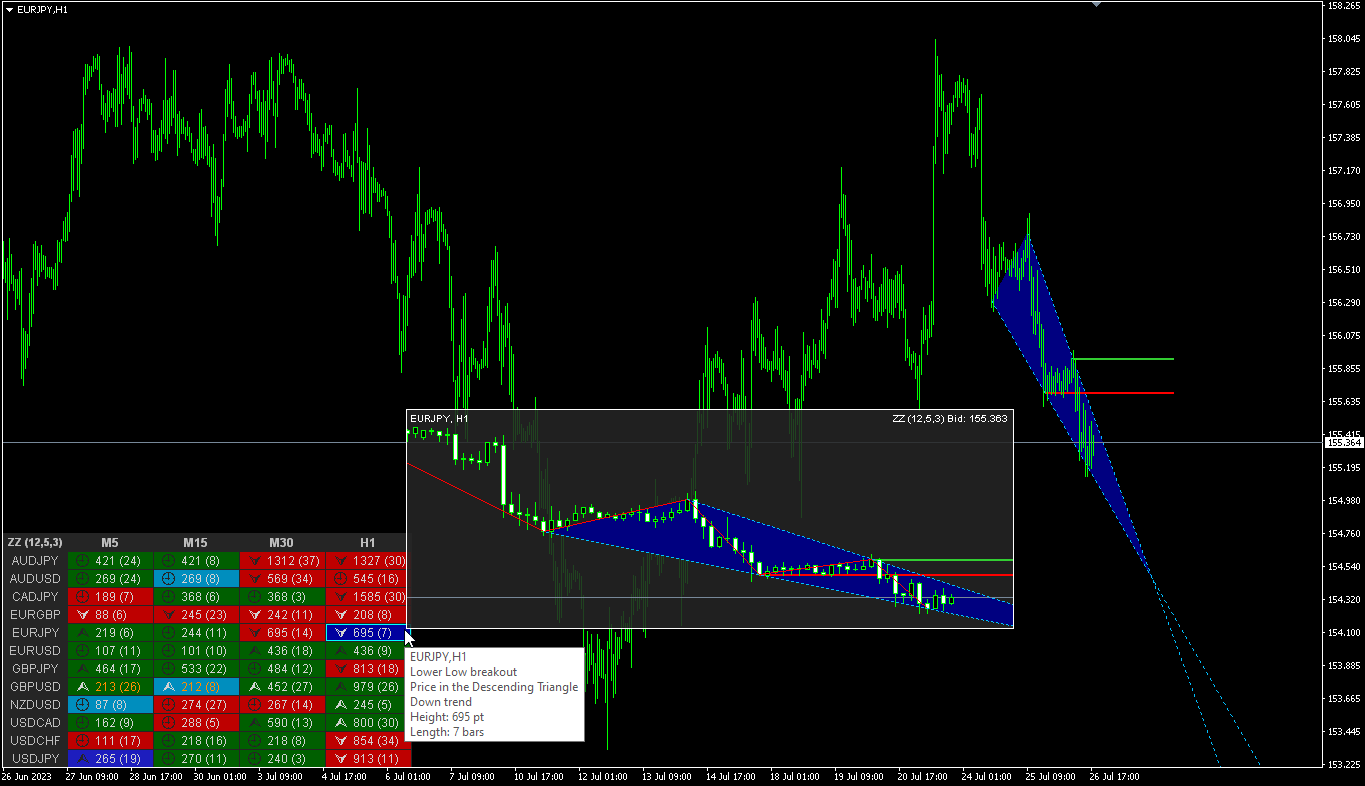
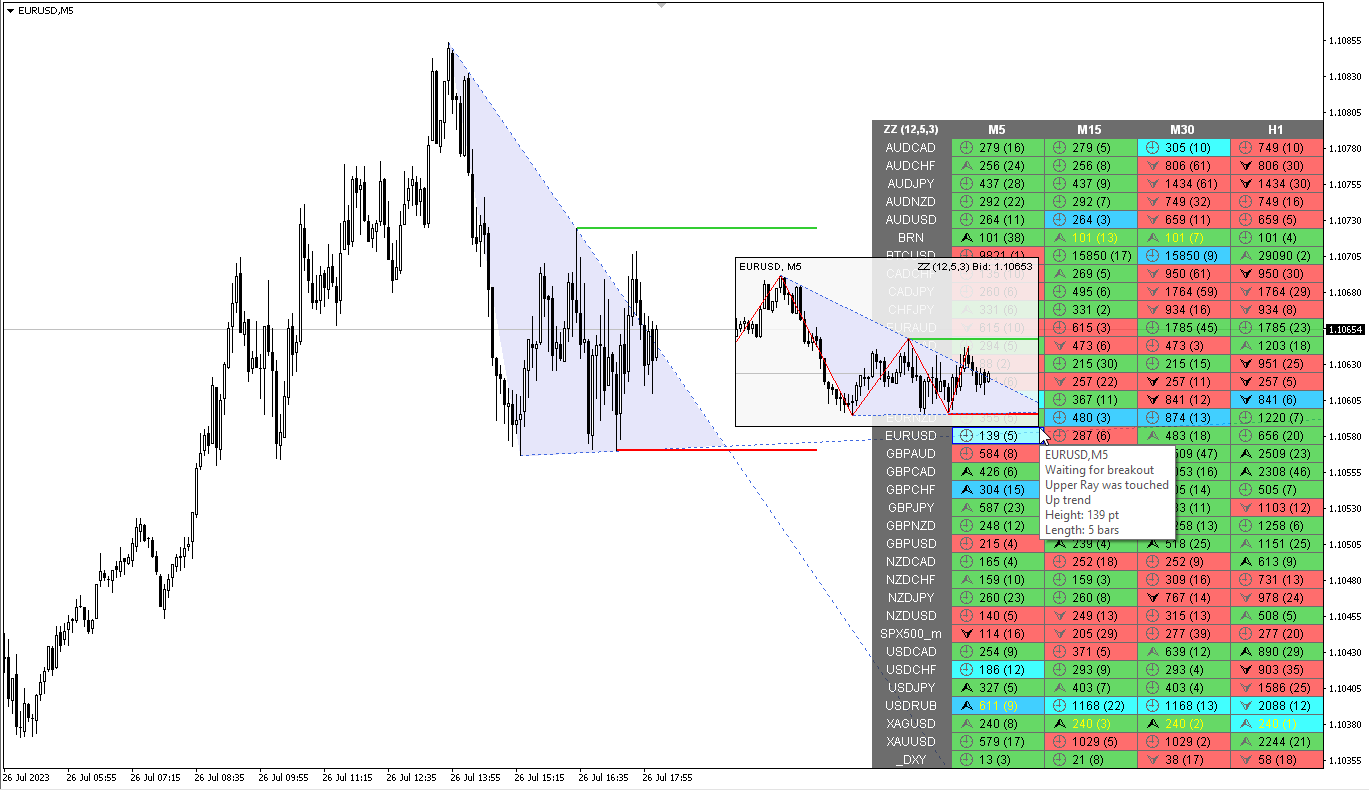
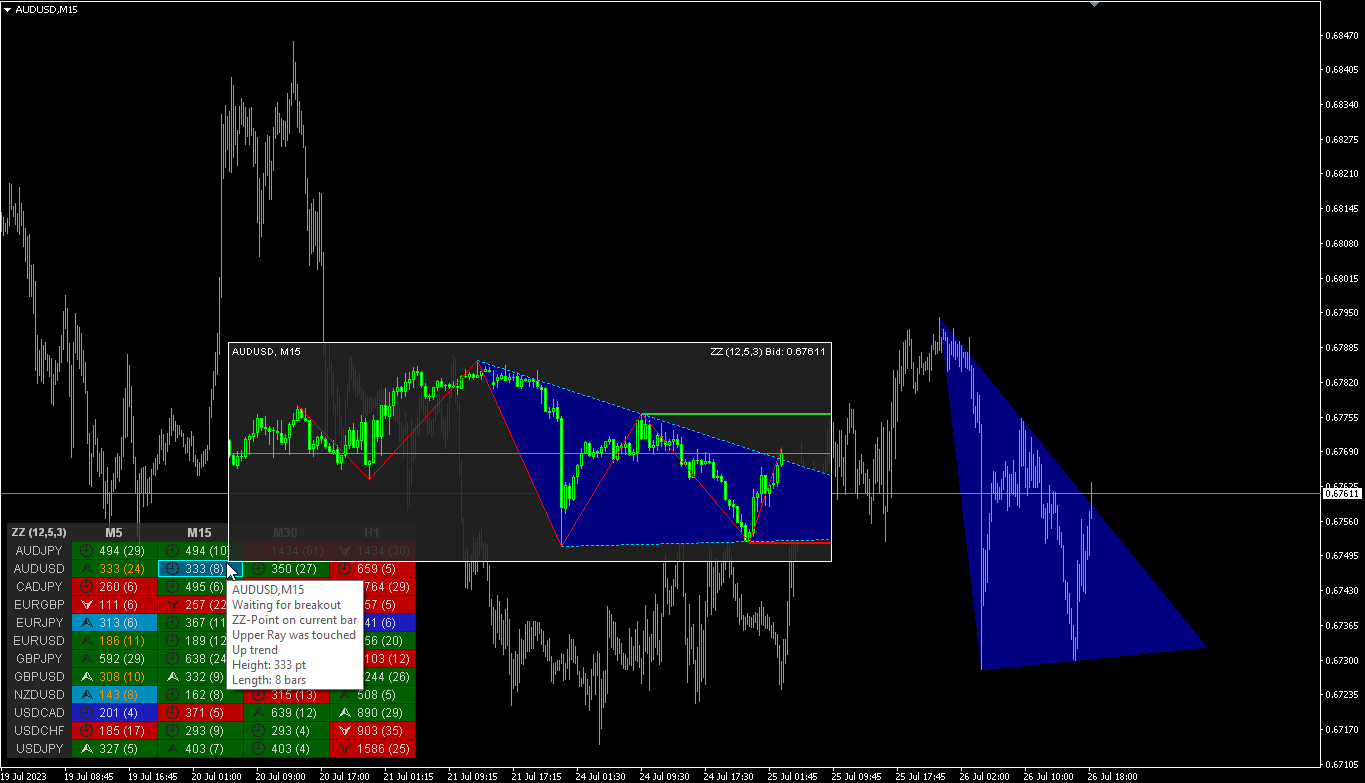
ZigZag 指标的多货币和多时间框架修改。 显示市场的当前方向、上次走势的高度、本次走势中的柱数以及锯齿形调整浪(水平线)的前一个点的突破。 这是 MTF 扫描仪。
您可以在参数中指定任何所需的货币和时间范围。 此外,当之字折线改变方向或突破前一点时,面板可以发送通知。 通过单击带有句点的单元格,将打开该符号和句点. 指标——连接关键低点和高点以显示趋势线
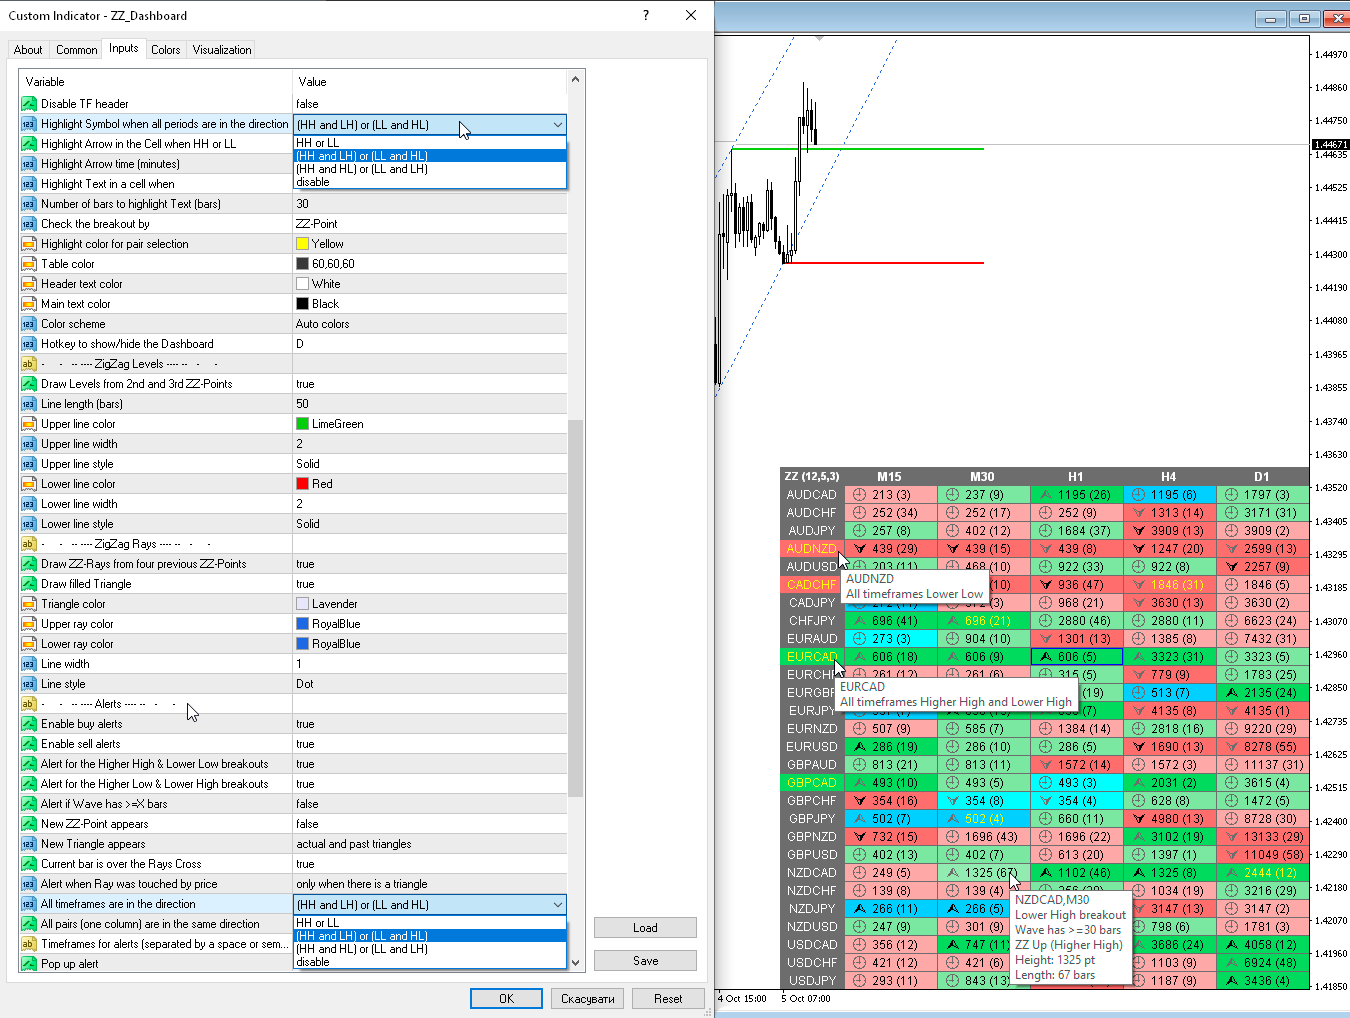
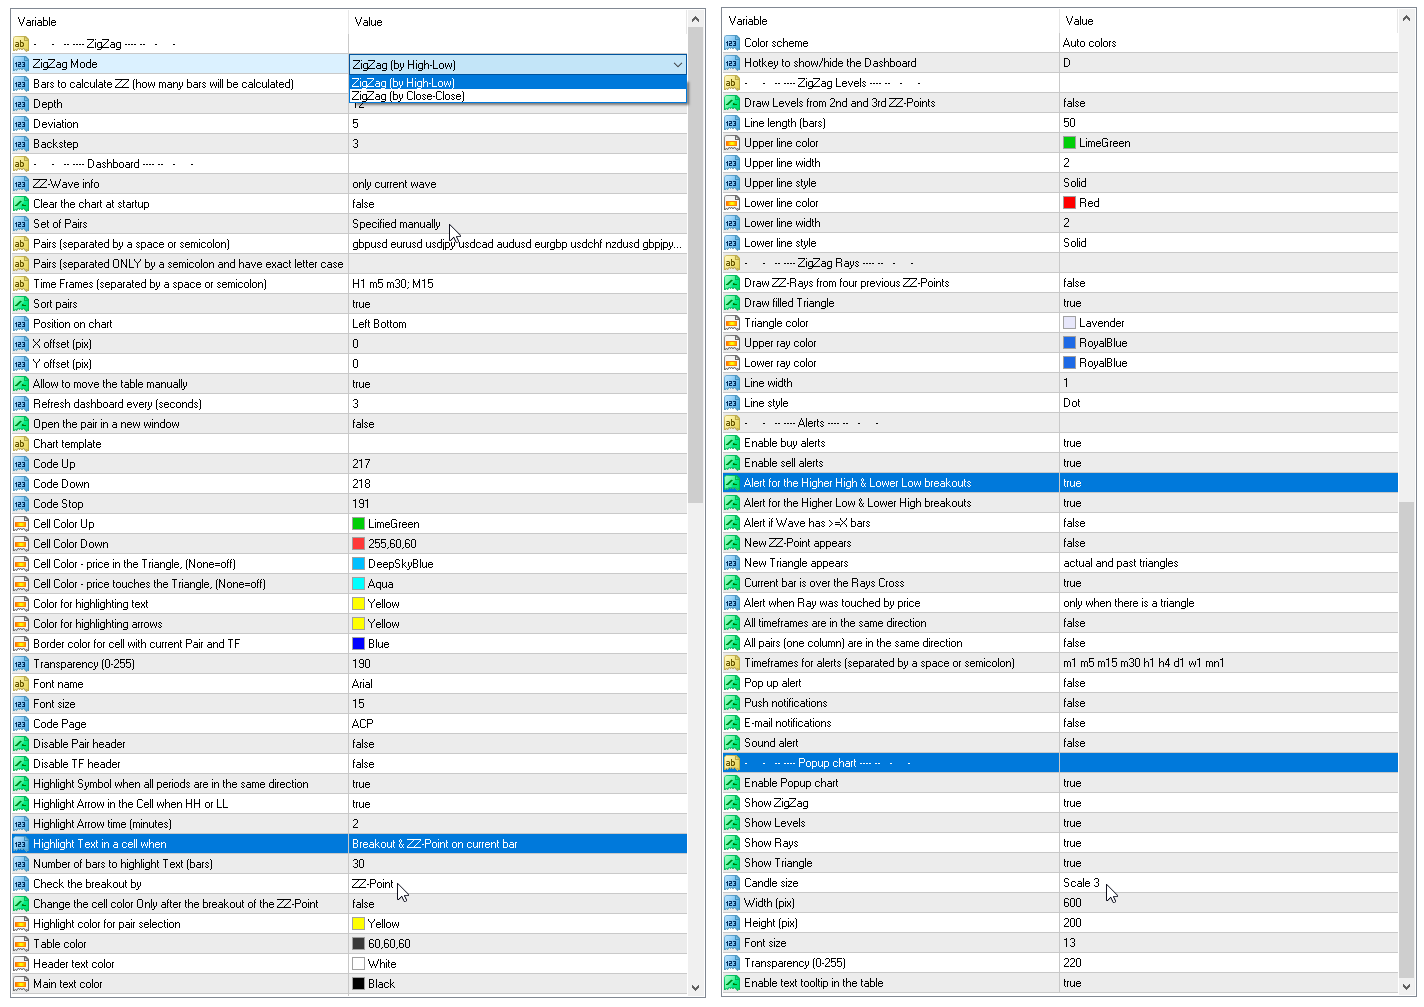
参数
Depth — 如果最后一根蜡烛的偏差小于(或大于)前一根,则 Zigzag 将不会绘制第二个最大值(或最小值)的烛台的最小数量;
Deviation — 锯齿形形成局部顶部/底部的两个相邻烛台的最高点/最低点之间的最小点数;
Backstep — 局部高点/低点之间的最小烛台数量;
Bars to calculate ZZ — 历史中用于查找 ZigZag 点的柱的数量.
ZZ-wave info — 表格中显示有关波形的哪些信息 — 仅当前波形或当前波形 + 上一个波形;
Highlight the symbol when all periods are in the same direction — 方向时突出显示该符号;
Symbol highlight time (minutes, 0-all the time) — 符号高亮时间(分钟,0-一直);
Highlight cells mode — 突出显示单元格模式
— Wave has >=X bars — 突出显示条数大于或等于 X 的单元格;— Breakout & ZZ-pt on current bar — 当上一个 ZigZag 点被突破时突出显示单元格(ZZ 点位于当前柱上);— ZZ-pt on current bar — 当 ZZ 点出现在当前栏上时突出显示单元格。 新的或变化的浪潮;— Price touched ZZ-Ray — 当 ZigZag 射线触及价格时突出显示单元格;— disable - 禁用-禁用单元格突出显示;
Number of bars to highlight cells (bars) — ZigZag 波形中应有多少条形图突出显示单元格;
Clear the chart at startup — 启动时清除图表。
Set of Pairs — 符号集
— Market Watch — 来自 MT 的“市场观察”的货币对。不要使用太多符号,这可能会导致指标变慢;— Specified manually — 在参数“Pairs”中手动指定对;— Current pair — 当前对;
Pairs (separated by a space or semicolon) — 由空格或分号分隔的符号列表。 货币名称的书写方式应与经纪商的名称完全相同,并保留大小写和前缀/后缀。
Time Frames (separated by a space or semicolon) — 由空格或分号分隔的时间范围列表(多个时间范围)。
Sort pairs — 对对列表进行排序。
Position on chart — 在图表上显示面板的角落。
X offset (pix) — 沿 X 轴移动面板;
Y offset (pix) — 沿 Y 轴移动面板;
Refresh dashboard every (seconds) — 所有货币对和时间范围的更新周期。
Open the pair in a new window — 通过单击在新图表窗口中打开交易品种。
Chart template — 图表模板的名称(如果图表在新窗口中打开)。
Color Up — 如果指示器增加,则单元格颜色。
Color Down — 如果指标下降,则单元格颜色。
Color Highlight — 文本突出显示颜色。
Transparency (0-255) — 面板的透明度。
Font name — 字体名称。
Font size — 字体大小。
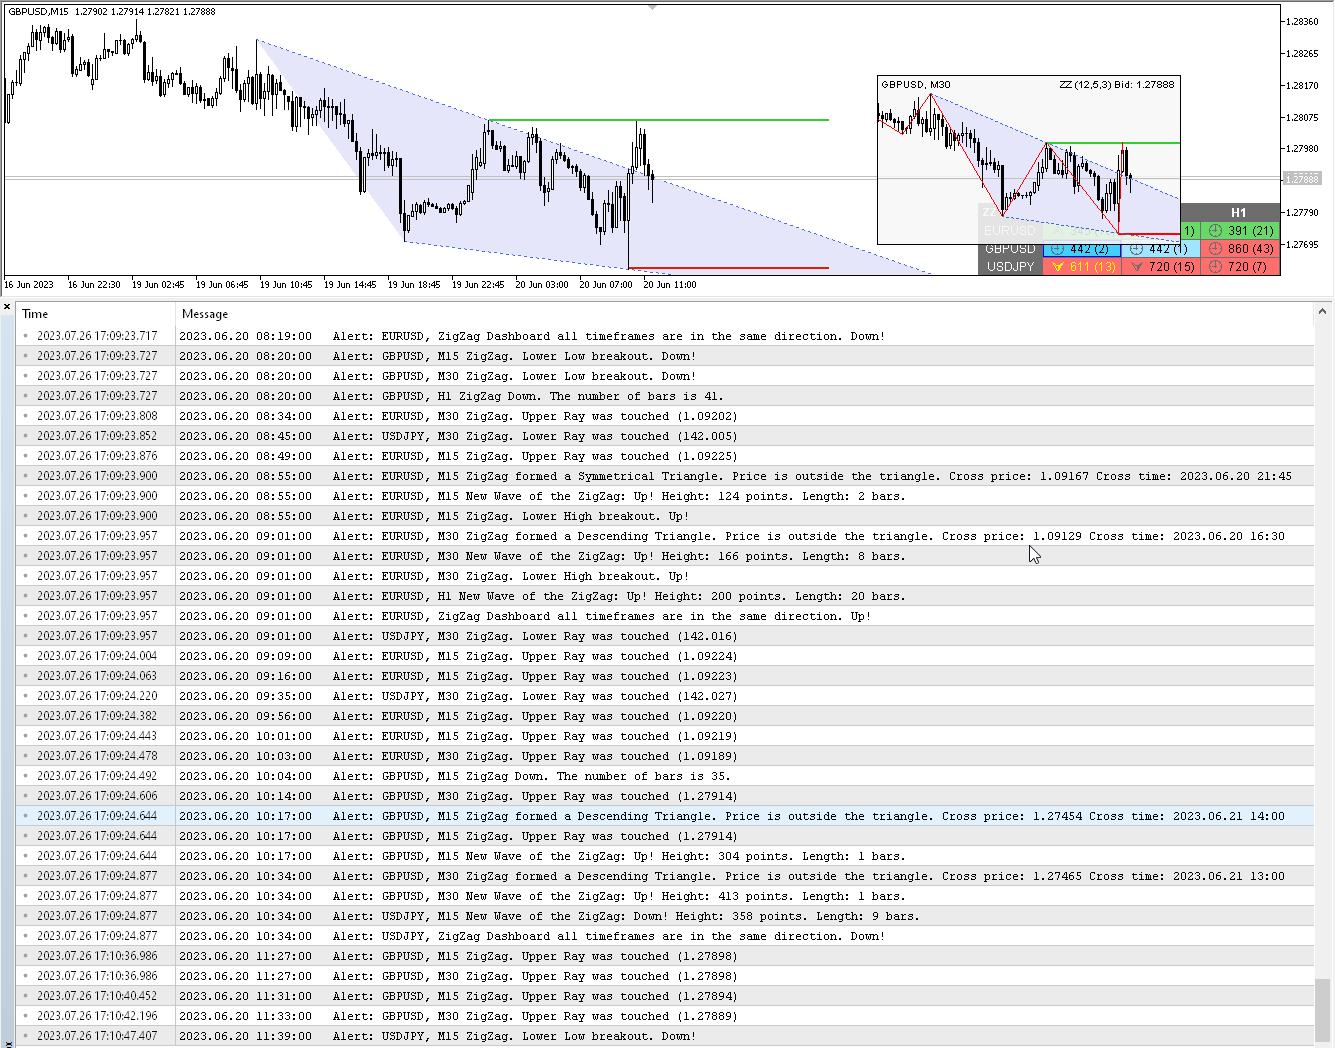
警报
Timeframes for alerts (separated by a space or semicolon) — 发送警报的时间段列表(以空格或分号分隔)。
Alert if wave has >= X bars — 如果锯齿形调整浪的条数大于或等于 X,则发出警报。
Alert for the Higher High & Lower Low breakouts — 如果之前的高点或低点被突破,则发出警报。
Alert for the Higher Low & Lower High breakouts — 如果先前的 HL 或 LH 被突破,则发出警报。
New ZZ-Point appears — 如果出现新的锯齿形调整浪点,则会发出警报。
New Triangle appears — 新的三角形出现。
Current bar is over the Rays Cross — 当前柱位于射线十字上方。
Alert when Ray was touched by price — 当雷被价格触动时发出警报。
All timeframes are in the same direction — 所有时间范围都朝同一方向。
All pairs (one column) are in the same direction — 所有对(一列)都处于同一方向。
All timeframes are in the same direction — 当所有时间范围都在同一方向时发出警报。
All pairs (one column) are in the same direction — 所有对(一列)都处于同一方向。
Pop up alert — 弹出警报。
Push notifications — 推送通知。
E-mail notifications — 电子邮件通知。
Sound alert — 声音警报。


ZigZag Dashboard is a super tool —exceptional at observing market shifts. It runs flawlessly under heavy data loads, and while there’s a bit of a learning curve, once you master it, its value in guiding everyday trade choices shines through. Best of all, Taras’s support is lightning-fast, turning every suggestion into real improvements—five stars simply aren’t enough! Asante sana Taras!
Back again to give credit where due.... Taras has the most amazing support ever! If the world functioned as fast as him, problems would be solved before they even became problems!. Thank you Taras!
This is honestly a genius tool—if you don’t have it yet, I’d strongly encourage you to purchase it, take time to learn it, and just keep winning!