Taras Slobodyanik / 卖家
已发布的产品

ADX 指标用于确定趋势及其强度。 价格的方向由 +DI 和 -DI 值显示,ADX 值显示趋势的强度。 如果+DI高于-DI,则市场处于上升趋势,如果相反,则市场处于下降趋势。 如果 ADX 低于 20,则没有明确的方向。 一旦指标突破该水平,中等强度的趋势就会开始。 值高于 40 表示强劲趋势(下降趋势或上升趋势)。
平均方向运动指数 (ADX) 指标的多货币和多时间框架修改。 您可以在参数中指定任何所需的货币和时间范围。 此外,当趋势强度水平被交叉时,以及当 +DI 和 -DI 线被交叉时,指标可以发送通知。 通过单击带有句点的单元格,将打开该符号和句点。 这是 MTF 扫描仪。
与货币强度计类似,仪表板可以自动选择包含指定货币的货币对,或以该货币为基础货币的货币对。该指标在“货币对集合”中指定的所有货币对中搜索货币;其他货币对将被忽略。并根据这些货币对计算该货币的总 ADX。您可以看到该货币的强弱程度。
默认情况下,从图表中隐藏仪表板的键是“D” 您可以将数据从 ADX 仪表板导出到 CSV 文件。该文件将保存到终端文件夹:\MQL5\Files。 数据将根据计时器 -

The indicator draws the time scale on the chart. You can specify the time offset, adjust the size and font to display on the chart ( it is displaying your local time on your chart instead of MT time ). You can also select the desired format for displaying the date and time. You may be interested in my other product , which contains a more advanced version of the Time Scale .
You can also find my other products here . Parameters Hours (time shift) — time shift (hours); Minutes (time shift) — tim
FREE

多货币和多时间框架 Heikin Ashi 指标。 显示了当前的市场状况。 在扫描仪面板上,您可以看到当前趋势的方向、强度和条形数量。 盘整/反转蜡烛也用颜色显示。 您可以在参数中指定任何所需的货币和期间。 此外,当趋势发生变化或出现反转和盘整蜡烛(十字星)时,指标可以发送通知。 通过单击单元格,将打开该符号和句点。 这是 MTF 扫描仪. Heikin-Ashi 是日本的交易指标和金融图表,意思是“平均速度”。 Heikin-Ashi 图表类似于烛台图,但具有更平滑的外观,因为它们跟踪一系列价格变动,而不是像烛台那样跟踪每个价格变动。 Heikin-Ashi 由 Munehisa Homma 在 1700 年代创建,他还创建了烛台图。 交易者和投资者使用这些图表来帮助确定和预测价格变动
参数 Averaging Method for Smoothing — 选择平滑蜡烛价格的方法. — Simple MA — 简单 MA
— Exponential MA — 指数 MA
— Smoothed MA — 平滑 MA
— Linear weighted MA — 线性加权 MA
—

This is the famous FX Sniper's T3 CCI indicator. It is a fixed version additionally containing search for classical and reverse (hidden) divergence. The classical divergence is displayed as a solid line, the reverse divergence is shown as a dotted line. Divergences are drawn in the indicator and on the chart (if you select the appropriate options).
Parameters
CCI Period — Commodity Channel Index indicator period CCI Type of price — price used for indicator calculation T3 Period — Sniper period

该指标显示当前交易品种的盈利(亏损)。 您可以自由拖放线条来显示当前的盈利或亏损。 You can find my products here .
参数 Calculation in money or in points — 以点数或货币计算利润/损失。 Add pending orders to calculate — 在计算中考虑挂单。 Magic Number (0 - all orders on symbol) — 幻数,如果需要评估特定订单。 Offset for first drawing (points from the average price) — 线距第一次开始时的平均价格的偏移量。 Decimal places for calculating the Sum — 显示总和的小数点后的位数。 Decimal places for calculating the Percentage — 显示百分比的小数点后的位数。
Tuning 调音 Color of the profit line — 利润线的颜色。 Color of the loss line
FREE

相对强弱指数 (RSI) 指标的多货币和多时间框架修改。 您可以在参数中指定任何所需的货币和时间范围。 此外,该面板还可以在跨越超买和超卖水平时发送通知。 通过单击带有句点的单元格,将打开该符号和句点。 这是 MTF 扫描仪。
默认情况下,从图表中隐藏仪表板的键是“D”
与货币强度计类似,仪表板可以自动选择包含指定货币的货币对,或以该货币为基础货币的货币对。该指标在“货币对集合”中指定的所有货币对中搜索货币;其他货币对将被忽略。并根据这些货币对计算该货币的总 RSI。您可以看到该货币的强弱程度.
参数 RSI Period — 平均周期。 RSI Applied price — 价格类型。 Clear the chart at startup — 启动时清除图表 Set of Pairs — 符号集 — Market Watch — 来自 MT 的“市场观察”的货币对。 — Specified manually — 在参数“Pairs”中手动指定对。 — Current pair — 仅显示当前对。 Pairs (separated by a space or semico

该指标具有三个主要工具:放大镜(缩放图表)、标尺(时间和价格刻度)和十字准线。 您可以用鼠标移动它并自定义不同的显示格式,自定义每个元素的大小和颜色。
放大镜(缩放图表)允许您显示任何时间范围和不同比例的蜡烛。 默认热键:“Q”- 更高的时间范围,“A”- 更低的时间范围,“W”- 减小蜡烛尺寸,“S”- 增加蜡烛尺寸,“Z”- 显示/隐藏缩放图表. 您可以在评论页面找到最新的演示。 → 演示版仅适用于 USDJPY 货币对 时间刻度根据时间周期标记图表。 您可以设置时移,以便您可以在刻度上看到您的当地时间,而不是经纪商的时间(因此它会在图表上显示您的当地时间,而不是 MT 时间)。 时间格式可以设置为 24 小时制或 12 小时制。 热键“T”- 显示/隐藏时间刻度。
价格刻度垂直标记图表。 您可以设置显示数字和四舍五入价格的格式。 热键“P”- 显示/隐藏价格等级。
十字线可以显示价格、时间、柱数、点数、百分比、根据指定手数计算的利润(按手数计算的利润)、根据指定金额计算的手数(按风险手数)。 热键“C”- 显示/隐藏十字准线。 如果金额计算不正确,请尝试启用“如果符号货币

该指标具有三个主要工具:放大镜(缩放图表)、标尺(时间和价格刻度)和十字准线。 您可以用鼠标移动它并自定义不同的显示格式,自定义每个元素的大小和颜色。
放大镜(缩放图表)允许您显示任何时间范围和不同比例的蜡烛。 默认热键:“Q”- 更高的时间范围,“A”- 更低的时间范围,“W”- 减小蜡烛尺寸,“S”- 增加蜡烛尺寸,“Z”- 显示/隐藏缩放图表 您可以在评论页面找到最新的演示。 → 演示版仅适用于 USDJPY 货币对 时间刻度根据时间周期标记图表。 您可以设置时移,以便您可以在刻度上看到您的当地时间,而不是经纪商的时间(因此它会在图表上显示您的当地时间,而不是 MT 时间)。 时间格式可以设置为 24 小时制或 12 小时制。 热键“T”- 显示/隐藏时间刻度。
价格刻度垂直标记图表。 您可以设置显示数字和四舍五入价格的格式。 热键“P”- 显示/隐藏价格等级。
十字线可以显示价格、时间、柱数、点数、百分比、根据指定手数计算的利润(按手数计算的利润)、根据指定金额计算的手数(按风险手数)。 热键“C”- 显示/隐藏十字准线。 如果金额计算不正确,请尝试启用“如果符号货币与

多时间框架锯齿形调整浪指标。 它显示支撑/阻力水平线及其突破,并绘制当前的市场目标。 它还可以显示分形指标的线条和其他时期(最多季度)的蜡烛。指标——连接关键低点和高点以显示趋势线。
该指标重新绘制最后一个(当前)点,并且在某些情况下可以更改最后 2-3 个点。
所有线条均绘制为对象( 不是指标缓冲区,但有可能接收 EA 的数据 )。 在 Expert Advisor 中使用时,您可以使用 iCustom 读取 ZigZag 点
设置 Mode — 根据计算支撑位和阻力位 — Zig Zag — ZigZag 指标; — ZigZag Close — 之字折线收盘指标; — Fractals — 分形指标; — High-Low of the period — 通过高低水平构建指标。 时间范围在Period参数中指定; — Candles only — 仅绘制蜡烛; Depth — 如果最后一根蜡烛的偏差小于(或大于)前一根,则 Zigzag 将不会绘制第二个最大值(或最小值)的烛台的最小数量; Deviation — 锯齿形形成局部顶部/底部的两个相邻烛台的最高点/

该指标根据 ZigZag 指标、交易时段、分形或蜡烛(包括非标准时间范围:年、6 个月、4 个月、3 个月、2 个月)自动绘制斐波那契水平(自动斐波那契回撤)。 您可以选择任何更高的时间范围进行斐波纳奇计算。 每次当前柱关闭时都会重新绘制级别。 当超过指定级别时可以启用警报。
您还可以分析历史水平。 为此,需要在“过去的斐波纳奇数”参数中指定斐波纳奇位的数量
参数
Calculate Fibo according to — 斐波纳奇计算模式: Candles (High-Low) — 根据最高价-最低价构建斐波那契; Candles (Close-Close) — 基于收盘价-收盘价构建斐波那契; ZigZags — 通过 ZigZag 点构建斐波那契; Sessions — 通过交易会话构建斐波那契; Fractals — 通过分形点构建斐波那契。 Minimum fibo size, points (0-any) — 最小斐波那契尺寸,以点为单位。 如果斐波那契尺寸小于此大小,则忽略它。 TF for Candle — 用于构建斐波那契水平的蜡烛时间范围; Number

相对强弱指数 (RSI) 指标的多货币和多时间框架修改。 您可以在参数中指定任何所需的货币和时间范围。 此外,该面板还可以在跨越超买和超卖水平时发送通知。 通过单击带有句点的单元格,将打开该符号和句点。 这是 MTF 扫描仪。
默认情况下,从图表中隐藏仪表板的键是“D”
与货币强度计类似,仪表板可以自动选择包含指定货币的货币对,或以该货币为基础货币的货币对。该指标在“货币对集合”中指定的所有货币对中搜索货币;其他货币对将被忽略。并根据这些货币对计算该货币的总 RSI。您可以看到该货币的强弱程度.
参数 RSI Period — 平均周期。 RSI Applied price — 价格类型。 Clear the chart at startup — 启动时清除图表 Set of Pairs — 符号集 — Market Watch — 来自 MT 的“市场观察”的货币对。 — Specified manually — 在参数“Pairs”中手动指定对。 — Current pair — 仅显示当前对。 Pairs (separated by a space or semico

移动平均线 (MA) 指标的多货币和多时间范围修改。 在仪表板上,您可以看到指标的当前状态 - 快速 MA 和慢速 MA 的突破和触及(按价格),以及 MA 线彼此之间的交叉点(移动平均线交叉)。 在参数中,您可以指定任何所需的货币和时间范围。 此外,该指标还可以发送有关价格触及线及其交叉的通知。 通过单击带有句点的单元格,将打开该符号和句点。 这是 MTF 扫描仪。您可以在图表上运行多个仪表板。
该指标在当前图表上显示快速 MA 线和慢速 MA 线。 您可以为图表选择 MA 时间范围并从其他时间范围观察 MA (MTF MA)。 两组MA的热键默认为“1”和“2”。
默认情况下,从图表中隐藏仪表板的键是“D”
参数 Fast MA — 快速MA Averaging period — 平均周期. Shift — 转移。 Averaging method — 平均法。 Applied price — 适用价格。
Slow MA — 慢MA Averaging period — 平均周期。 Shift — 转移。 Averaging method — 平均法。 Applied

The indicator draws the time scale on the chart. You can specify the time offset, adjust the size and font to display on the chart (it is displaying your local time on your chart instead of MT time). You can also select the desired format for displaying the date and time. While holding down the middle mouse button, and moving the cursor, a slider will appear on the scale. You may be interested in my other product , which contains a more advanced version of the Time Scale.
You can also find my o
FREE

该指标显示当前交易品种的盈利(亏损)。 您可以自由拖放线条来显示当前的盈利或亏损。 You can find my products here .
参数 Calculation in money or in points — 以点数或货币计算利润/损失。 Add pending orders to calculate — 在计算中考虑挂单。 Magic Number (0 - all orders on symbol) — 幻数,如果需要评估特定订单。 Offset for first drawing (points from the average price) — 线距第一次开始时的平均价格的偏移量。 Decimal places for calculating the Sum — 显示总和的小数点后的位数。 Decimal places for calculating the Percentage — 显示百分比的小数点后的位数。
Tuning 调音 Color of the profit line — 利润线的颜色。 Color of the loss line
FREE

多货币和多时间框架指标 MACD。 仪表板可以显示传统(真实)MACD 和 MetaTrader 中内置的 MACD。
在面板上,您可以看到指标的当前状态 - MACD 线的移动方向、它们的交点以及带有指标图表的弹出窗口。 在参数中,您可以指定任何所需的交易品种和时间范围。 扫描仪还可以发送有关线相互交叉以及线穿过零电平的通知。 通过单击单元格,将打开给定的符号和句点。
您还可以看到价格和 MACD 线之间的差异(常规和隐藏),以及价格和直方图之间的差异。 因此,您可以轻松扫描所有时间范围的所有货币对和交易品种,以找到 MACD 主线和信号线或零水平的交叉点。
显示/隐藏仪表板的热键默认为“D”。 默认情况下,启用/禁用弹出图表的热键为“C”。 用于切换图表“1”和“2”上的箭头的热键. MACD(移动平均收敛/发散)指标(或“振荡指标”)是根据历史价格数据(最常见的是收盘价)计算得出的三个时间序列的集合。 这三个系列是:MACD 系列本身、“信号”或“平均”系列以及“背离”系列(两者之间的区别)。 MACD 系列是价格系列的“快速”(短期)指数移动平均线 (EMA) 和“慢速

The EA creates an order grid using labels. Opening and closing of the grid is done either automatically by the system signals or manually. In the same grid can be both Limit and Stop orders. It is possible to reverse the grid on specified condition. You can enter the breakdown/rebound from established levels. All types of Sell limit, Buy limit, Buy stop, Sell stop orders are supported. The grid is rebuilt with a single click. The stop loss and take profit lines can be easily modified You are fre

ADX 指标用于确定趋势及其强度。 价格的方向由 +DI 和 -DI 值显示,ADX 值显示趋势的强度。 如果+DI高于-DI,则市场处于上升趋势,如果相反,则市场处于下降趋势。 如果 ADX 低于 20,则没有明确的方向。 一旦指标突破该水平,中等强度的趋势就会开始。 值高于 40 表示强劲趋势(下降趋势或上升趋势)。
平均方向运动指数 (ADX) 指标的多货币和多时间框架修改。 您可以在参数中指定任何所需的货币和时间范围。 此外,当趋势强度水平被交叉时,以及当 +DI 和 -DI 线被交叉时,指标可以发送通知。 通过单击带有句点的单元格,将打开该符号和句点。 这是 MTF 扫描仪。
与货币强度计类似,仪表板可以自动选择包含指定货币的货币对,或以该货币为基础货币的货币对。该指标在“货币对集合”中指定的所有货币对中搜索货币;其他货币对将被忽略。并根据这些货币对计算该货币的总 ADX。您可以看到该货币的强弱程度。
默认情况下,从图表中隐藏仪表板的键是“D” 您可以将数据从 ADX 仪表板导出到 CSV 文件。该文件将保存到终端文件夹:\MQL4\Files。 数据将根据计时器 -

随机振荡器的多货币和多时间框架修改。 您可以在参数中指定任何所需的货币和时间范围。 该面板显示当前值和线的交点 - 信号线和主线(随机交叉)。 此外,该指标还可以在跨越超买和超卖水平时发送通知。 通过单击带有句点的单元格,将打开该符号和句点。 这是 MTF 扫描仪。 与货币强度计类似,仪表板可以自动选择包含指定货币的货币对,或以该货币为基础货币的货币对。该指标在“货币对集合”中指定的所有货币对中搜索货币;其他货币对将被忽略。并根据这些货币对计算该货币的总随机指标。您可以看到该货币的强弱程度。
默认情况下,从图表中隐藏仪表板的键是“D”
参数 %K Period — K 线的周期。 %D Period — D 线的周期。 Slowing — 放慢; Method — 平均法; Price field — 价格类型。 Line of indicator — 线索引。 Clear the chart at startup — 启动时清除图表 Set of Pairs — 符号集: — Market Watch — 来自 MT 的“市场观察”的货币对。 — Specified man

布林带指标的多货币和多时间框架修改。 在仪表板上,您可以看到布林带的突破和触及。 在参数中,您可以指定任何所需的货币和时间范围。 当价格触及布林线、当前波动率发生变化(扩大或下跌)以及价格触及所有布林线时,该指标还可以发送通知。 通过单击带有句点的单元格,将打开该符号和句点。 这是 MTF 扫描仪。
默认情况下,从图表中隐藏仪表板的键是“D”
参数 Bollinger Bands Settings Averaging period — 计算指标的平均周期。 Standard deviations — 与主线的标准差数。 Bands shift — 指标相对于价格图表的移动。 Applied price — 用于计算的价格。 Show BB on the current chart — 在当前图表上显示 BB
仪表板 Clear the chart at startup — 启动时清除图表。 Set of Pairs — 符号集 — Market Watch — 来自 MT 的“市场观察”的货币对。 — Specified manually — 在参数“Pairs”中手动指定对。

多货币和多时间范围指标 Inside Bar (IB)。 在参数中,您可以指定任何所需的货币和时间范围。 该面板显示最后找到的内部柱线(和母柱线)形态、当前价格位置以及母线和内部柱线水平的突破。 您可以设置单元格中的条形和文本的大小和颜色。 当水平被突破时,该指标还可以发送通知。 通过单击带有句点的单元格,将打开指定的交易品种和句点。 这是 MTF 扫描仪。
默认情况下,从图表中隐藏仪表板的键是“D”
参数 How long pattern will be valid after first breakout (bars) — 信号将在单元格中显示多少柱 IB body must be inside of the MB body - IB 主体必须位于 MB 主体内部。 IB body and wicks must be inside the MB body - IB 主体和灯芯必须位于 MB 主体内。 If MB is IB, choose the next MB — 如果找到的母柱是前一个信号的内柱,则将显示前一个信号。 MB body must be large than

多时间框架锯齿形调整浪指标。 它显示支撑/阻力水平线及其突破,并绘制当前的市场目标。 它还可以显示分形指标的线条和其他时期(最多季度)的蜡烛。指标——连接关键低点和高点以显示趋势线。
该指标重新绘制最后一个(当前)点,并且在某些情况下可以更改最后 2-3 个点。
所有线条均绘制为对象(不是指标缓冲区,但有可能接收 EA 的数据)。 在 Expert Advisor 中使用时,您可以使用 iCustom 读取 ZigZag 点
设置 Mode — 根据计算支撑位和阻力位 — Zig Zag — ZigZag 指标; — ZigZag Close — 之字折线收盘指标; — Fractals — 分形指标; — High-Low of the period — 通过高低水平构建指标。 时间范围在Period参数中指定; — Candles only — 仅绘制蜡烛; Depth — 如果最后一根蜡烛的偏差小于(或大于)前一根,则 Zigzag 将不会绘制第二个最大值(或最小值)的烛台的最小数量; Deviation — 锯齿形形成局部顶部/底部的两个相邻烛台的最高点/最低

该仪表板显示来自三个来源的当前新闻:来自 ForexFactory.com 网站(FFC 日历)、来自 Investing.com 网站和来自 mql5.com 的经济日历。 您可以按影响力和国家对新闻进行排序,并一键将其显示在图表上。 通过按住“Ctrl”键,您可以选择几种不同的“货币”或“影响”进行排序。 此外,该实用程序不仅显示预测,还显示它们出现在网站上后的实际值。 您可以为每条新闻设置单独的通知。 来自 mql5.com 的新闻,采用您的 MT5 语言。
您可以使用 EA 或指标来阅读新闻。 更多详情请参阅评论中的描述。 EA 可以在新闻发布前关闭市场头寸和挂单,将止损移至盈亏平衡点并在当天结束时平仓.
另外,在评论中,您可以找到一个脚本,该脚本可以从仪表板读取新闻,并通过单击“Algo Trading”按钮停止所有 EA 的交易。
该程序从互联网获取信息,因此您需要在终端设置中启用对 ForexFactory 和 Investing.com 网站的访问。 按“ctrl+O”、“Expert Advisors”、“Allow WebRequest”,然后将链接复制到列

江恩箱(或江恩方)是一种基于 W.D. Gann 的“市场预测的数学公式”文章的市场分析方法。 该指标可以绘制三种正方形模型:90、52(104)、144。有六种网格变体和两种弧形变体。 您可以在一张图表上同时绘制多个方块
参数 Square — 江恩方格模型的选择: 90 — 90 的平方(或 9 的平方); 52 (104) — 52(或 104)的平方; 144 — 144的万能平方; 144 (full) — 正方形的“完整”版本,结合了其他正方形的线条。 据我们所知,W.D.江恩并没有这样的加价; for Arcs — 圆弧的简化正方形; Grid — 网格的变体: 4x4 (52) — 4 x 4 网格,52 个标记; 5x5 (40); 8x8 (90); 8x8 (104); 8x8 (144); 16x16 (144); 36x36 (144); disable — 禁用网格; Arcs — 弧线的变体: 4x4; 5x5; disable — 禁用弧; 开始时的方形参数: Length of Square, Bars (X-axis) — 正方形的长度(以条为

布林带指标的多货币和多时间框架修改。 在仪表板上,您可以看到布林带的突破和触及。 在参数中,您可以指定任何所需的货币和时间范围。 当价格触及布林线、当前波动率发生变化(扩大或下跌)以及价格触及所有布林线时,该指标还可以发送通知。 通过单击带有句点的单元格,将打开该符号和句点。 这是 MTF 扫描仪。
默认情况下,从图表中隐藏仪表板的键是“D”
参数 Bollinger Bands Settings Averaging period — 计算指标的平均周期。 Standard deviations — 与主线的标准差数。 Bands shift — 指标相对于价格图表的移动。 Applied price — 用于计算的价格。 Show BB on the current chart — 在当前图表上显示 BB
仪表板 Clear the chart at startup — 启动时清除图表。 Set of Pairs — 符号集 — Market Watch — 来自 MT 的“市场观察”的货币对。 — Specified manually — 在参数“Pairs”中手动指定对。

ZigZag 指标的多货币和多时间框架修改。 显示市场的当前方向、上次走势的高度、本次走势中的柱数以及锯齿形调整浪(水平线)的前一个点的突破。 这是 MTF 扫描仪。
您可以在参数中指定任何所需的货币和时间范围。 此外,当之字折线改变方向或突破前一点时,面板可以发送通知。 通过单击带有句点的单元格,将打开该符号和句点. 指标——连接关键低点和高点以显示趋势线.
参数 Depth — 如果最后一根蜡烛的偏差小于(或大于)前一根,则 Zigzag 将不会绘制第二个最大值(或最小值)的烛台的最小数量; Deviation — 锯齿形形成局部顶部/底部的两个相邻烛台的最高点/最低点之间的最小点数; Backstep — 局部高点/低点之间的最小烛台数量; Bars to calculate ZZ — 历史中用于查找 ZigZag 点的柱的数量. ZZ-wave info — 表格中显示有关波形的哪些信息 — 仅当前波形或当前波形 + 上一个波形; Highlight the symbol when all periods are in the same direction — 方向时突出

多货币和多时间范围指标 Inside Bar (IB)。 在参数中,您可以指定任何所需的货币和时间范围。 该面板显示最后找到的内部柱线(和母柱线)形态、当前价格位置以及母线和内部柱线水平的突破。 您可以设置单元格中的条形和文本的大小和颜色。 当水平被突破时,该指标还可以发送通知。 通过单击带有句点的单元格,将打开指定的交易品种和句点。 这是 MTF 扫描仪。
默认情况下,从图表中隐藏仪表板的键是“D”
参数 How long pattern will be valid after first breakout (bars) — 信号将在单元格中显示多少柱 IB body must be inside of the MB body - IB 主体必须位于 MB 主体内部。 IB body and wicks must be inside the MB body - IB 主体和灯芯必须位于 MB 主体内。 If MB is IB, choose the next MB — 如果找到的母柱是前一个信号的内柱,则将显示前一个信号。 MB body must be large than

多货币和多时间框架 Heikin Ashi 指标。 显示了当前的市场状况。 在扫描仪面板上,您可以看到当前趋势的方向、强度和条形数量。 盘整/反转蜡烛也用颜色显示。 您可以在参数中指定任何所需的货币和期间。 此外,当趋势发生变化或出现反转和盘整蜡烛(十字星)时,指标可以发送通知。 通过单击单元格,将打开该符号和句点。 这是 MTF 扫描仪 Heikin-Ashi 是日本的交易指标和金融图表,意思是“平均速度”。 Heikin-Ashi 图表类似于烛台图,但具有更平滑的外观,因为它们跟踪一系列价格变动,而不是像烛台那样跟踪每个价格变动。 Heikin-Ashi 由 Munehisa Homma 在 1700 年代创建,他还创建了烛台图。 交易者和投资者使用这些图表来帮助确定和预测价格变动.
参数 Averaging Method for Smoothing — 选择平滑蜡烛价格的方法. — Simple MA — 简单 MA
— Exponential MA — 指数 MA
— Smoothed MA — 平滑 MA
— Linear weighted MA — 线性加权 MA
—

商品通道指数 (CCI) 指标的多货币和多时间框架修改。 您可以在参数中指定任何所需的货币和时间范围。 此外,该面板还可以在跨越超买和超卖水平时发送通知。 通过单击带有句点的单元格,将打开该符号和句点。 这是 MTF 扫描仪。
默认情况下,从图表中隐藏仪表板的键是“D”
参数 CCI Period — 平均周期. CCI Applied price — 价格类型。 Clear the chart at startup — 启动时清除图表。 Set of Pairs — 符号集 — Market Watch — 来自 MT 的“市场观察”的货币对; — Specified manually — 在参数“Pairs”中手动指定对。 — Current pair — 当前对。 Pairs (separated by a space or semicolon) — 由空格或分号分隔的符号列表。 货币名称的书写方式应与经纪商的名称完全相同,并保留大小写和前缀/后缀。 Time Frames (separated by a space or semicolon) — 由空格或分号分隔的时

这是一个交易时段指标,可以显示四个交易时段的所有级别(开盘价-最高价-最低价-收盘价)。 该指标还可以预测会话级别。 会话可以用线条或矩形(空的或填充的)绘制,线条可以延伸到下一个会话。 您可以通过按热键(默认为“1”、“2”、“3”、“4”)轻松隐藏/显示每个会话
您可以看到 ASR(平均会话范围)线(默认热键“A”) 。 这与 ADR 计算类似,只是它是根据最后一个 X 交易时段计算的,这使您可以看到当前(和之前)交易时段的潜在范围(今天价格可以移动多远)。 平均值的计算方式为之前会话的总和除以会话数(参数“ASR 周期(计算平均值的会话数)”),每个会话都有自己的 ASR 值。
该指标计算并绘制未来的会话及其大小。 正确识别报价历史记录中的漏洞。 它还可以在每个会话开始时绘制垂直分隔符。
指标自动确定图表的配色方案。
当价格触及会话水平或价格突破已关闭会话指定距离时,它还会发送警报。 可以禁用每个会话的警报。
参数“如果其他会话启动则停止会话”(热键“S”)允许您停止过时的会话,并在新会话中断时接收警报。
该指标可以绘制枢轴水平并就其发送警报。 这些级别是根据之

移动平均线 (MA) 指标的多货币和多时间范围修改。 在仪表板上,您可以看到指标的当前状态 - 快速 MA 和慢速 MA 的突破和触及(按价格),以及 MA 线彼此之间的交叉点(移动平均线交叉)。 在参数中,您可以指定任何所需的货币和时间范围。 此外,该指标还可以发送有关价格触及线及其交叉的通知。 通过单击带有句点的单元格,将打开该符号和句点。 这是 MTF 扫描仪。您可以在图表上运行多个仪表板。
该指标在当前图表上显示快速 MA 线和慢速 MA 线。 您可以为图表选择 MA 时间范围并从其他时间范围观察 MA (MTF MA)。 两组MA的热键默认为“1”和“2”。
默认情况下,从图表中隐藏仪表板的键是“D”
参数 Fast MA — 快速MA Averaging period — 平均周期. Shift — 转移。 Averaging method — 平均法。 Applied price — 适用价格。
Slow MA — 慢MA Averaging period — 平均周期。 Shift — 转移。 Averaging method — 平均法。 Applied

The indicator calculates the angle between the Highs, Lows and Closes of neighboring bars. The angle can be measured in degrees or radians. A linear chart or a histogram is drawn in a subwindow. You can set the scale for the calculation — floating or fixed. For use in the EA, you need to specify a fixed scale.
Parameters Angular measure — degrees or radians. Scale mode for calculation — scaling mode. Free scale — free transformation, the indicator will calculate values each time the chart scale
FREE

The indicator calculates the inclination angle between the Highs, Lows and Closes of adjacent bars. The angle can be measured in degrees or radians. A linear graph or a histogram is drawn in a subwindow. You can set the scale for the calculation — floating or fixed. For use in Expert Advisors or indicators, you need to specify a fixed scale.
Parameters Angular measure — degrees or radians. Scale mode for calculation — scaling mode. Free scale — free transformation, the indicator will calculate
FREE
The Tetris — the most famous time killer is now on MT. Game develops active logic, attention and speed of decision making. This is a classic version of the game, no frills, but you can still adjust the size of the glass, the scale of the game, the color of the figures, and the desired speed. The game is made as an indicator. Control Keys: 'W,A,S,D' or 'Cursor' or 'NumPad'. S — Start new game. C — Continue previous game. P — pause on / off. Space — drop a figure. Esc — exit to menu.
FREE
The Tetris — the most famous time killer is now on MT. Game develops active logic, attention and speed of decision making. This is a classic version of the game, no frills, but you can still adjust the size of the glass, the scale of the game, the color of the figures, and the desired speed. The game is made as an indicator. Control Keys: 'WASD' or 'Cursor' or 'NUMPAD'. S — Start new game. C — Continue previous game. P — pause on / off. Space — drop a figure. Esc— exit to menu.
FREE

The indicator determines the inside bar and marks its High/Low. It is plotted based on the closed candles (does not redraw). The identified inside bar can be displayed on the smaller periods. You may set a higher period (to search for the inside bar) and analyze on a smaller one. Also you can see the levels for Mother bar.
Indicator Parameters Period to find Inside Bar — the period to search for the inside bar. If a specific period is set, the search will be performed in that period Type of ind

该指标根据 ZigZag 指标、交易时段、分形或蜡烛(包括非标准时间范围:年、6 个月、4 个月、3 个月、2 个月)自动绘制斐波那契水平(自动斐波那契回撤)。 您可以选择任何更高的时间范围进行斐波纳奇计算。 每次当前柱关闭时都会重新绘制级别。 当超过指定级别时可以启用警报。
您还可以分析历史水平。 为此,需要在“过去的斐波纳奇数”参数中指定斐波纳奇位的数量
参数
Calculate Fibo according to — 斐波纳奇计算模式: Candles (High-Low) — 根据最高价-最低价构建斐波那契; Candles (Close-Close) — 基于收盘价-收盘价构建斐波那契; ZigZags — 通过 ZigZag 点构建斐波那契; Sessions — 通过交易会话构建斐波那契; Fractals — 通过分形点构建斐波那契。 Minimum fibo size, points (0-any) — 最小斐波那契尺寸,以点为单位。 如果斐波那契尺寸小于此大小,则忽略它。 TF for Candle — 用于构建斐波那契水平的蜡烛时间范围; Number

该指标显示其他(和非标准)时间范围的最高价/最低价/开盘价/收盘价 - 年、6 个月、4 个月、3 个月、2 个月、月、周、日、H3-H6-H8-H12 小时 M45 M90。 您还可以设置打开蜡烛的班次并构建虚拟蜡烛。 这些时间范围之一的“周期分隔符”以垂直线的形式提供。 可以针对当前或先前水平的突破(突破昨天/上周的高点/低点等)配置警报。 您还可以将所有级别向右移动一个周期。 也就是说,当前周期将显示前一周期的最高价/最低价.
参数 Number of levels to calculate (0-all) — 屏幕上将显示多少条。 Change the opening of bars (hours) — 将蜡烛的开盘移动 n 小时。 该指标将根据新的开盘时间绘制虚拟柱。 MN1 以上的周期不会改变。 Move the levels to the right — 将所有级别向右移动一格。 您将看到当前蜡烛的先前水平。 Period Separator (vertical lines) — 显示垂直线、周期分隔符。 Show High Lines (trigger for

分形指标的多货币和多时间框架修改。 显示最后两个分形 - 它们的序列(以及哪一个被破坏),或它们之间的距离。 您可以在参数中指定任何所需的货币和时间范围。 此外,该面板还可以发送有关分形突破的通知。 通过单击带有句点的单元格,将打开该符号和句点。 这是 MTF 扫描仪。
默认情况下,从图表中隐藏仪表板的键是“D”
参数 Calculation of fractals based on — 分形搜索模式: — standart indicator — 按标准指标; — user bars — 按自定义栏的数量(可调整分形); Bars before (user calc) — 分形之前的柱数; Bars after (user calc) — 分形后的条数 Indicator mode — 显示模式 — Arrows — 分形的最后两个箭头; — Distance — 最后两个分形之间的距离; Show fractals on the chart — 在图表上显示当前分形; Clear the chart at startup — 启动时清除图表。 Set of Pairs —

This is a multicurrency and multitimeframe indicator that calculates the angle between two points. Points for measuring the angle can be taken from the ZigZag (the last two points), or from the Moving Average (between two given bars), or it can be the closing prices of bars.
Angle measurement is possible in degrees or in radians. You can select the scale for the calculation. For a better understanding of the indicator, you can study the free Angle High Low indicator. In the parameters you can
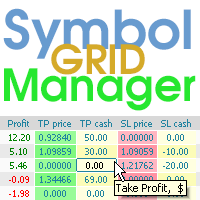
Symbol Manager or Grid Manager, designed to group orders into one position (by Symbol or by Magic Number). This utility will be useful to multi-currency traders (many EAs), who can have multiple orders on several pairs. You will be able to see the total number of lots, the total profit, and set virtual stop loss and virtual take profit. To set a real TP (or SL), you must first set the virtual value, and then enter the command in this cell: "set". If you want to set real TP/SL for all orders at

标准偏差通道的多货币和多时间框架指标。 显示市场的当前方向。 在面板上,您可以看到线性回归通道水平的突破和触及(按价格)。 在参数中,您可以指定任何所需的货币和时间范围。 此外,该指标还可以在触及水平时发送通知。 通过单击单元格,将打开该符号和句点。 这是 MTF 扫描仪.
默认情况下,从图表中隐藏仪表板的键是“D” «标准偏差通道建立在线性回归趋势的基础上,代表使用最小二乘法在价格图表上的两点之间构建的常见趋势线。 结果,这条线被证明是价格变化的确切中线。 它可以被视为一条均衡价格线,任何向上或向下的偏转分别表明买家或卖家的超活跃性。
标准偏差通道由两条平行线组成,与线性回归趋势上下等距。 通道框架与回归线之间的距离等于收盘价与回归线的标准差值。 所有价格变化都发生在标准偏差通道内,其中下框作为支撑线,上框作为阻力线。 价格通常会在短时间内超过通道框架。 如果它们在通道框架之外停留的时间比平时更长,则预测趋势转向的可能性»
参数 Show Linear Regression on the chart — 在当前图表上绘制标准偏差通道。
Standard Deviation

这是一个交易时段指标,可以显示四个交易时段的所有级别(开盘价-最高价-最低价-收盘价)。 该指标还可以预测会话级别。 会话可以用线条或矩形(空的或填充的)绘制,线条可以延伸到下一个会话。 您可以通过按热键(默认为“1”、“2”、“3”、“4”)轻松隐藏/显示每个会话
您可以看到 ASR(平均会话范围)线(默认热键“A”) 。 这与 ADR 计算类似,只是它是根据最后一个 X 交易时段计算的,这使您可以看到当前(和之前)交易时段的潜在范围(今天价格可以移动多远)。 平均值的计算方式为之前会话的总和除以会话数(参数“ASR 周期(计算平均值的会话数)”),每个会话都有自己的 ASR 值。
该指标计算并绘制未来的会话及其大小。 正确识别报价历史记录中的漏洞。 它还可以在每个会话开始时绘制垂直分隔符。
指标自动确定图表的配色方案。
当价格触及会话水平或价格突破已关闭会话指定距离时,它还会发送警报。 可以禁用每个会话的警报。
参数“如果其他会话启动则停止会话”(热键“S”)允许您停止过时的会话,并在新会话中断时接收警报。
该指标可以绘制枢轴水平并就其发送警报。 这些级别是根据之前会

MACD - the Moving Averages Convergence/Divergence indicator displays information simultaneously from different periods in one subwindow of the chart.
Parameters Fast EMA — period for Fast average calculation. Slow EMA — period for Slow average calculation. MACD SMA — period for their difference averaging. Type of price — price used. Timeframes for MACD — list of periods, separated by a space or comma or semicolon. Number of bars for each period — the number of bars displayed for each period. So

多货币和多时间框架指标 MACD。 仪表板可以显示传统(真实)MACD 和 MetaTrader 中内置的 MACD。
在面板上,您可以看到指标的当前状态 - MACD 线的移动方向、它们的交点以及带有指标图表的弹出窗口。 在参数中,您可以指定任何所需的交易品种和时间范围。 扫描仪还可以发送有关线相互交叉以及线穿过零电平的通知。 通过单击单元格,将打开给定的符号和句点。
您还可以看到价格和 MACD 线之间的差异(常规和隐藏),以及价格和直方图之间的差异。 因此,您可以轻松扫描所有时间范围的所有货币对和交易品种,以找到 MACD 主线和信号线或零水平的交叉点。
显示/隐藏仪表板的热键默认为“D”。 默认情况下,启用/禁用弹出图表的热键为“C”。 用于切换图表“1”和“2”上的箭头的热键. MACD(移动平均收敛/发散)指标(或“振荡指标”)是根据历史价格数据(最常见的是收盘价)计算得出的三个时间序列的集合。 这三个系列是:MACD 系列本身、“信号”或“平均”系列以及“背离”系列(两者之间的区别)。 MACD 系列是价格系列的“快速”(短期)指数移动平均线 (EMA) 和“慢速

The EA creates an order grid using labels. Opening and closing of the grid is done either automatically by the system signals or manually. In the same grid can be both Limit and Stop orders. It is possible to reverse the grid on specified condition. You can enter the breakdown/rebound from established levels. All types of Sell limit, Buy limit, Buy stop, Sell stop orders are supported. The grid is rebuilt with a single click. The stop loss and take profit lines can be easily modified You are fre

Stochastic Oscillator displays information simultaneously from different periods in one subwindow of the chart.
Parameters %K Period — K-period (number of bars for calculations). %D Period — D-period (period of first smoothing). Slowing — final smoothing. Method — type of smoothing. Price field — stochastic calculation method . Timeframes for Stochastic — list of periods, separated by a space or comma or semicolon. Number of bars for each period — the number of bars displayed for each period. S

Multi-timeframe indicator Relative Strength Index displays information simultaneously from different periods in one subwindow of the chart.
Parameters Period of averaging — averaging period for the RSI calculation. Type of price — price used. Timeframes for RSI — list of periods, separated by a space or comma or semicolon. Number of bars for each period — the number of bars displayed for each period. Sort periods — sort periods if they are listed in no particular order. Current period first — d

Multi-timeframe indicator Commodity Channel Index displays information simultaneously from different periods in one subwindow of the chart.
Parameters Period of averaging — averaging period for the CCI calculation. Type of price — price used. Timeframes for CCI — list of periods, separated by a space or comma or semicolon. Number of bars for each period — the number of bars displayed for each period. Sort periods — sort periods if they are listed in no particular order. Current period first — d

The Moving Averages Convergence/Divergence indicator displays information simultaneously from different periods in one subwindow of the chart.
Parameters Fast EMA — period for Fast average calculation. Slow EMA — period for Slow average calculation. MACD SMA — period for their difference averaging. Type of price — price used. Timeframes for MACD — list of periods, separated by a space or comma or semicolon. Number of bars for each period — the number of bars displayed for each period. Sort peri

The indicator determines the inside bar and marks its High/Low. It is plotted based on the closed candles (does not redraw). The identified inside bar can be displayed on the smaller periods. You may set a higher period (to search for the inside bar) and analyze on a smaller one. Also you can see the levels for Mother bar.
Indicator Parameters Period to find Inside Bar — the period to search for the inside bar. If a specific period is set, the search will be performed in that period Type of ind

该指标显示其他(和非标准)时间范围的最高价/最低价/开盘价/收盘价 - 年、6 个月、4 个月、3 个月、2 个月、月、周、日、H3-H6-H8-H12 小时 M45 M90。 您还可以设置打开蜡烛的班次并构建虚拟蜡烛。 这些时间范围之一的“周期分隔符”以垂直线的形式提供。 可以针对当前或先前水平的突破(突破昨天/上周的高点/低点等)配置警报。 您还可以将所有级别向右移动一个周期。 也就是说,当前周期将显示前一周期的最高价/最低价.
参数 Number of levels to calculate (0-all) — 屏幕上将显示多少条。 Change the opening of bars (hours) — 将蜡烛的开盘移动 n 小时。 该指标将根据新的开盘时间绘制虚拟柱。 MN1 以上的周期不会改变。 Move the levels to the right — 将所有级别向右移动一格。 您将看到当前蜡烛的先前水平。 Period Separator (vertical lines) — 显示垂直线、周期分隔符。 Show High Lines (trigger for

分形指标的多货币和多时间框架修改。 显示最后两个分形 - 它们的序列(以及哪一个被破坏),或它们之间的距离。 您可以在参数中指定任何所需的货币和时间范围。 此外,该面板还可以发送有关分形突破的通知。 通过单击带有句点的单元格,将打开该符号和句点。 这是 MTF 扫描仪。
默认情况下,从图表中隐藏仪表板的键是“D”
参数 Calculation of fractals based on — 分形搜索模式: — standart indicator — 按标准指标; — user bars — 按自定义栏的数量(可调整分形); Bars before (user calc) — 分形之前的柱数 Bars after (user calc) — 分形后的条数; Indicator mode — 显示模式 — Arrows — 分形的最后两个箭头; — Distance — 最后两个分形之间的距离; Show fractals on the chart — 在图表上显示当前分形; Clear the chart at startup — 启动时清除图表。 Set of Pairs —

This is a multicurrency and multitimeframe indicator that calculates the angle between two points. Points for measuring the angle can be taken from the ZigZag (the last two points), or from the Moving Average (between two given bars), or it can be the closing prices of bars.
Angle measurement is possible in degrees or in radians. You can select the scale for the calculation. For a better understanding of the indicator, you can study the free Angle High Low indicator. In the parameters you can

标准偏差通道的多货币和多时间框架指标。 显示市场的当前方向。 在面板上,您可以看到线性回归通道水平的突破和触及(按价格)。 在参数中,您可以指定任何所需的货币和时间范围。 此外,该指标还可以在触及水平时发送通知。 通过单击单元格,将打开该符号和句点。 这是 MTF 扫描仪。
默认情况下,从图表中隐藏仪表板的键是“D” «标准偏差通道建立在线性回归趋势的基础上,代表使用最小二乘法在价格图表上的两点之间构建的常见趋势线。 结果,这条线被证明是价格变化的确切中线。 它可以被视为一条均衡价格线,任何向上或向下的偏转分别表明买家或卖家的超活跃性。
标准偏差通道由两条平行线组成,与线性回归趋势上下等距。 通道框架与回归线之间的距离等于收盘价与回归线的标准差值。 所有价格变化都发生在标准偏差通道内,其中下框作为支撑线,上框作为阻力线。 价格通常会在短时间内超过通道框架。 如果它们在通道框架之外停留的时间比平时更长,则预测趋势转向的可能性».
参数 Show Linear Regression on the chart — 在当前图表上绘制标准偏差通道。
Standard Deviatio

Symbol Manager or Grid Manager, designed to group orders into one position (by Symbol or by Magic Number). This utility will be useful to multi-currency traders (many EAs), who can have multiple orders on several pairs. You will be able to see the total number of lots, the total profit, and set virtual stop loss and virtual take profit. To set a real TP (or SL), you must first set the virtual value, and then enter the command in this cell: "set". If you want to set real TP/SL for all orders at

该仪表板显示来自三个来源的当前新闻:来自 ForexFactory.com 网站(FFC 日历)、来自 Investing.com 网站和来自 mql5.com 的经济日历。 您可以按影响力和国家对新闻进行排序,并一键将其显示在图表上。 通过按住“Ctrl”键,您可以选择几种不同的“货币”或“影响”进行排序。 此外,该实用程序不仅显示预测,还显示它们出现在网站上后的实际值。 您可以为每条新闻设置单独的通知。 来自 mql5.com 的新闻,采用您的 MT5 语言。
您可以使用 EA 或指标来阅读新闻。 更多详情请参阅评论中的描述。 EA 可以在新闻发布前关闭市场头寸和挂单,将止损移至盈亏平衡点并在当天结束时平仓。
另外,在评论中,您可以找到一个脚本,该脚本可以从仪表板读取新闻,并通过单击“Algo Trading”按钮停止所有 EA 的交易。
该程序从互联网获取信息,因此您需要在终端设置中启用对 ForexFactory 和 Investing.com 网站的访问。 按“ctrl+O”、“Expert Advisors”、“Allow WebRequest”,然后将链接复制到列