Heikin Ashi Dashboard
- 指标
- 版本: 2.80
- 更新: 19 七月 2026
- 激活: 10

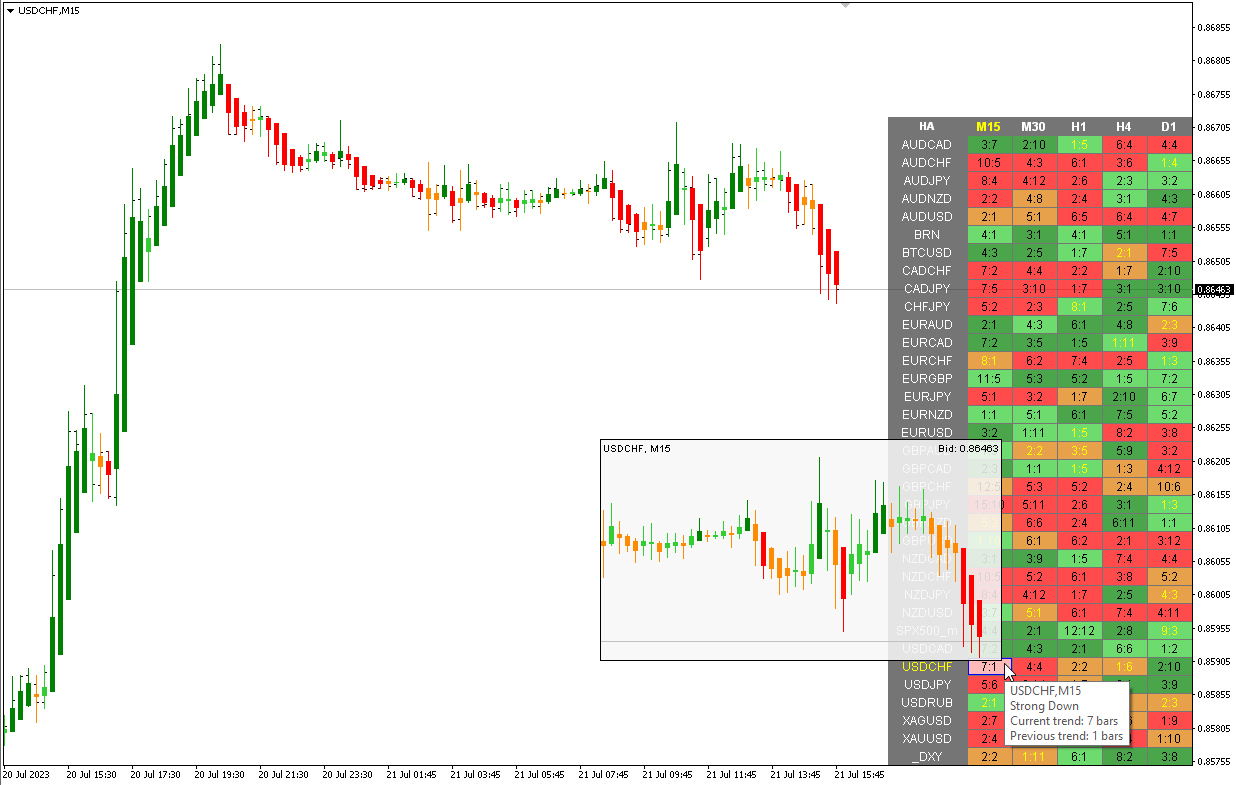
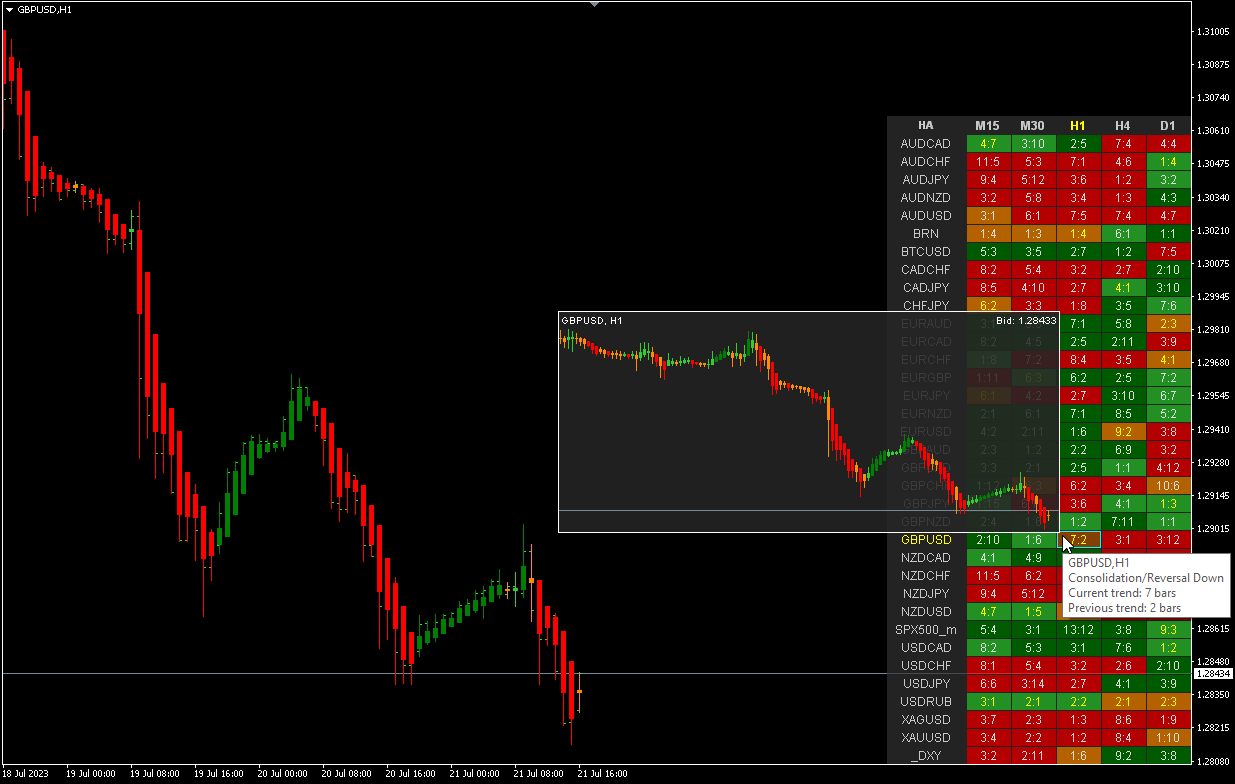
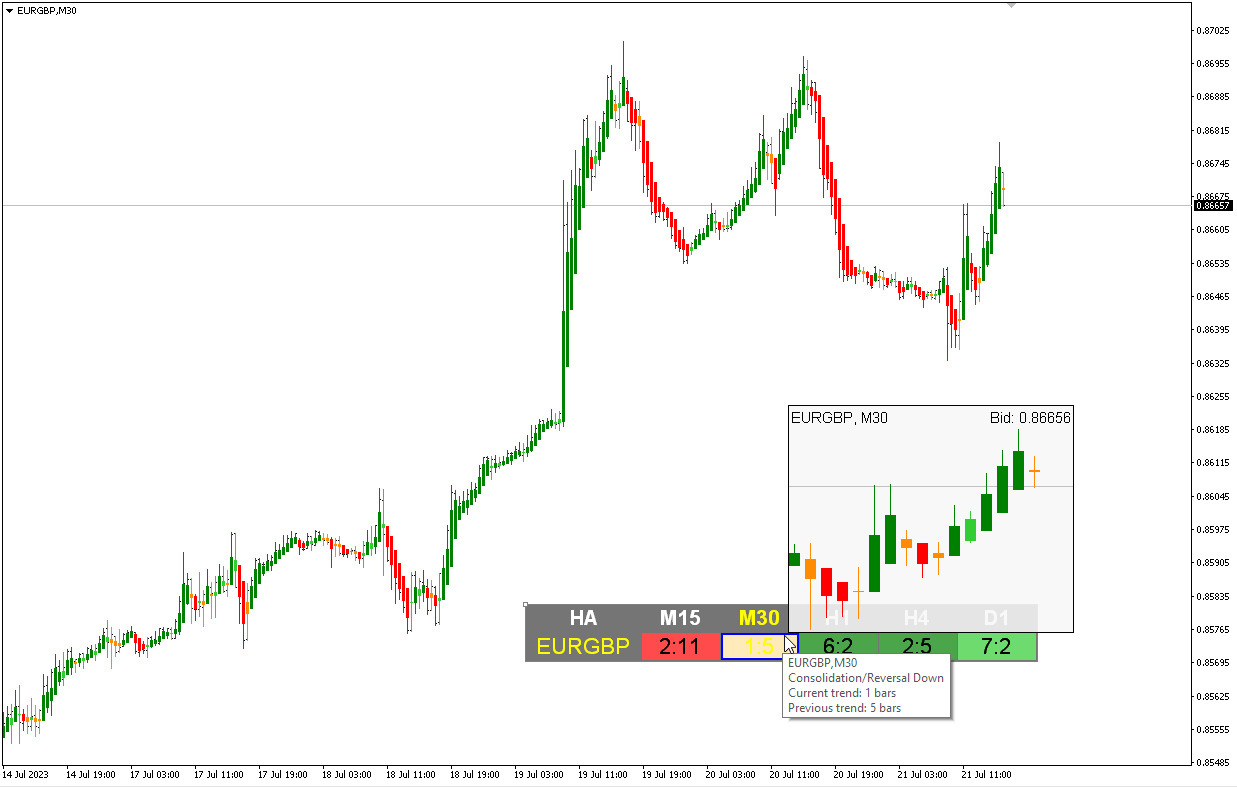
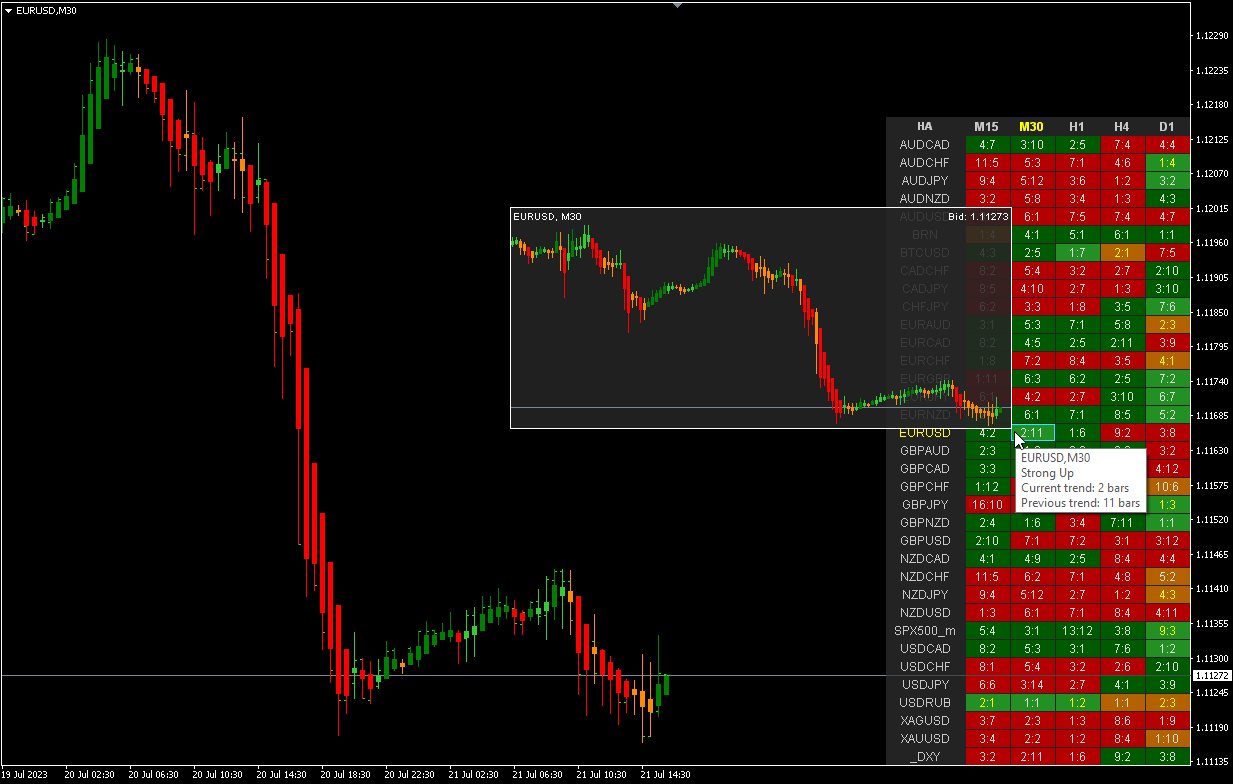
多货币和多时间框架 Heikin Ashi 指标。 显示了当前的市场状况。 在扫描仪面板上,您可以看到当前趋势的方向、强度和条形数量。 盘整/反转蜡烛也用颜色显示。 您可以在参数中指定任何所需的货币和期间。 此外,当趋势发生变化或出现反转和盘整蜡烛(十字星)时,指标可以发送通知。 通过单击单元格,将打开该符号和句点。 这是 MTF 扫描仪
Heikin-Ashi 是日本的交易指标和金融图表,意思是“平均速度”。 Heikin-Ashi 图表类似于烛台图,但具有更平滑的外观,因为它们跟踪一系列价格变动,而不是像烛台那样跟踪每个价格变动。 Heikin-Ashi 由 Munehisa Homma 在 1700 年代创建,他还创建了烛台图。 交易者和投资者使用这些图表来帮助确定和预测价格变动.
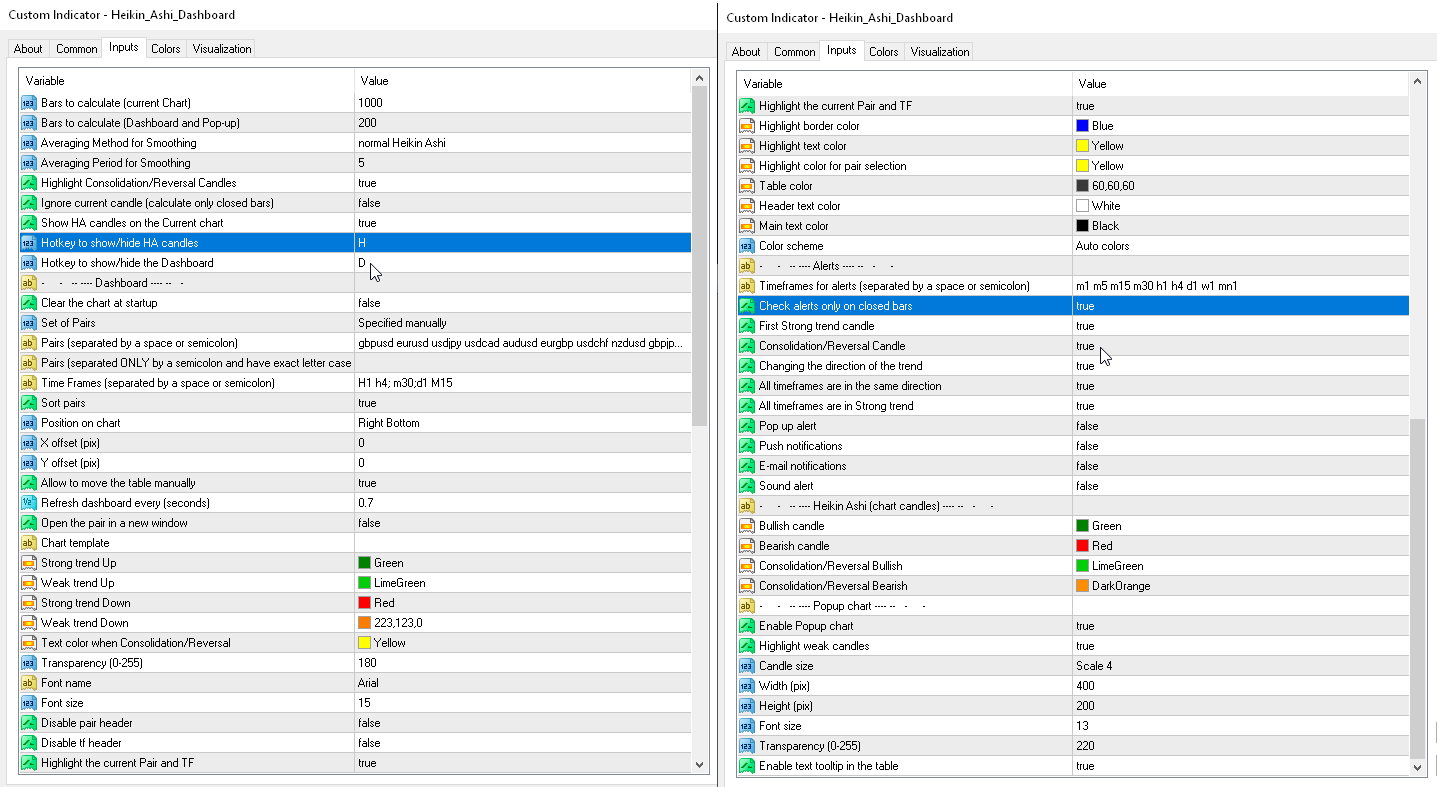
参数
- Averaging Method for Smoothing — 选择平滑蜡烛价格的方法.
— Simple MA — 简单 MA
— Exponential MA — 指数 MA
— Smoothed MA — 平滑 MA
— Linear weighted MA — 线性加权 MA
— normal Heikin Ashi — 正常 Heikin Ashi
- Averaging Period for Smoothing — 选择平滑周期
- Ignore current candle (calculate only closed bars) — 禁用当前(未关闭的)蜡烛图的显示。
- Show HA candles on the current chart — Heiken Ashi 蜡烛将在当前图表上绘制。
- Show Consolidation/Reversal Candles (Doji) — 显示盘整/反转蜡烛(十字星)。
- Doji. Body length to the Candle length ratio, % (body<=%) — 参数将蜡烛主体的大小设置为相对于整个蜡烛大小的百分比。 身体应该<=这个百分比。
- Doji. Wick length to the Candle length ratio, % (each wick>=%) 参数将上下灯芯的尺寸设置为相对于整个蜡烛尺寸的百分比。 每个灯芯必须 >= 该百分比。
- Hotkey to show/hide HA candles — 显示/隐藏 HA 蜡烛的热键。
- Hotkey to show/hide the Dashboard — 显示/隐藏仪表板的热键。
仪表板
Clear the chart at startup — 启动时清除图表。
Set of Pairs — 符号集
— Market Watch — 来自 MT 的“市场观察”的货币对。— Specified manually — 在参数“Pairs”中手动指定对。— Current pair — 仅显示当前对。
Pairs (separated by a space or semicolon) — 由空格或分号分隔的符号列表。 货币名称的书写方式应与经纪商的名称完全相同,并保留大小写和前缀/后缀。
Time Frames (separated by a space or semicolon) — 由空格或分号分隔的时间范围列表(多个时间范围)。
Sort pairs — 对对列表进行排序。
Position on chart — 在图表上显示面板的角落。
X offset (pix) — 沿 X 轴移动面板;
Y offset (pix) — 沿 Y 轴移动面板;
Refresh dashboard every (seconds) — 所有货币对和时间范围的更新周期。
Open the pair in a new window — 通过单击在新图表窗口中打开交易品种。
Chart template — 图表模板的名称(如果图表在新窗口中打开)。
Strong trend Up — 代表强劲上升趋势的颜色。
Weak trend Up — 弱上升趋势的颜色。
Strong trend Down — 表示强劲下降趋势的颜色。
Weak trend Down — 弱下降趋势的颜色。
Text color when Consolidation/Reversal — 盘整/反转柱的突出显示颜色(以及图表上的蜡烛)。
Transparency (0-255) — 透明度(0-255)。
Font name — 字体名称。
Font size — 字体大小。
警报
Timeframes for alerts (separated by a space or semicolon) — 警报的时间范围(用空格或分号分隔)。
Check alerts only when the candle is closed — 仅当蜡烛关闭时才检查警报。
First Strong trend candle — 警惕第一个强趋势蜡烛。
Consolidation/Reversal Candle — 当盘整/反转蜡烛出现时发出警报。
Changing the direction of the trend — 趋势方向改变时发出警报。
All timeframes are in Strong trend — 这些警报根据仪表板中的最短时间范围每条发送一次。 他们不会查看“警报时间范围”参数。
All timeframes are in the same direction — 这些警报根据仪表板中的最短时间范围每条发送一次。 他们不会查看“警报时间范围”参数。
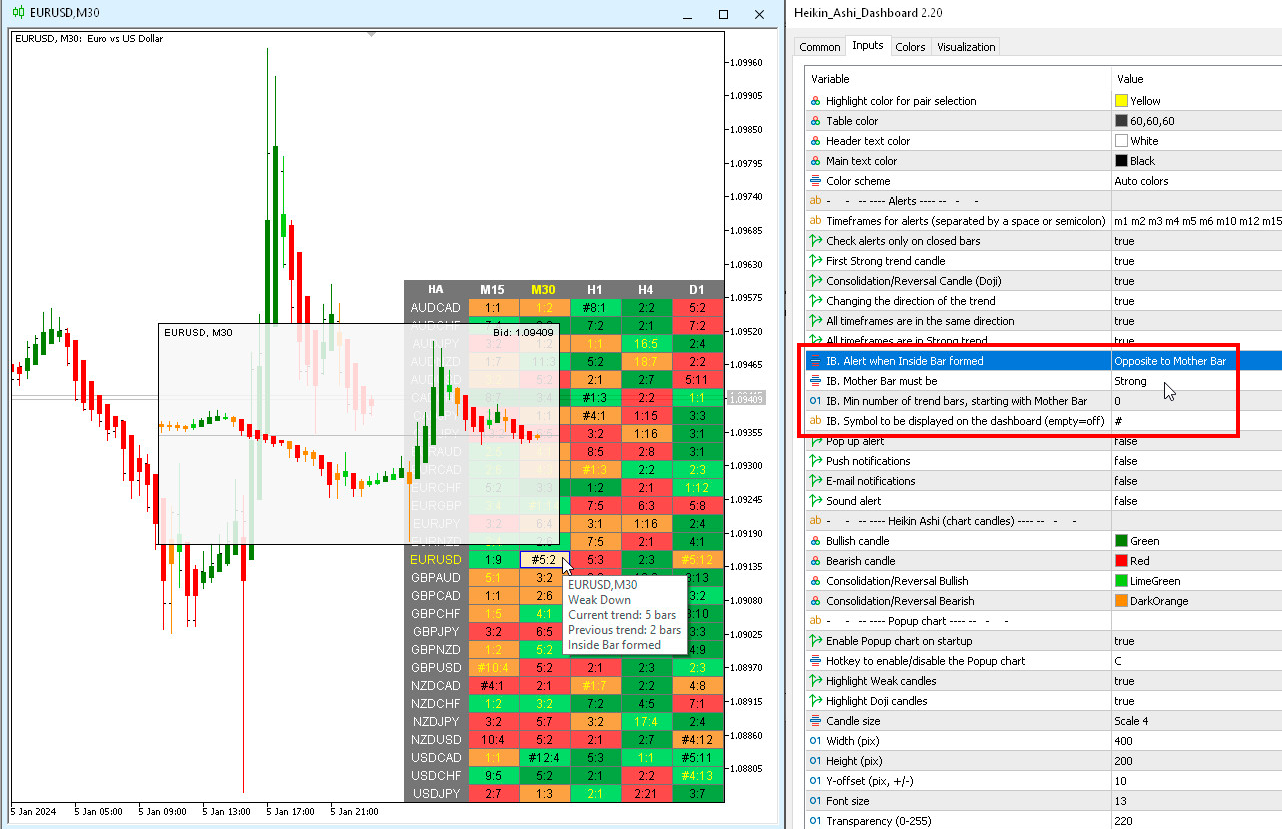
IB. Alert when Inside Bar formed — IB。 当内线形成时发出警报。
IB. Mother Bar must be — IB。 妈妈吧一定是。
IB. Min number of trend bars, starting with Mother Bar — IB。 趋势柱的最小数量,从母柱开始。
IB. Symbol to be displayed on the dashboard (empty=off) — IB。 显示在仪表板上的符号(空=关闭)。


If you want to look for an alternative to candle sticks and look for more peace of mind during 5 minutes or much longer time frame trading, this indicator dashboard has all that you need. Works very well, keeps you in trends and helps you even during choppy markets. More relaxed trading for certain. Good job. !