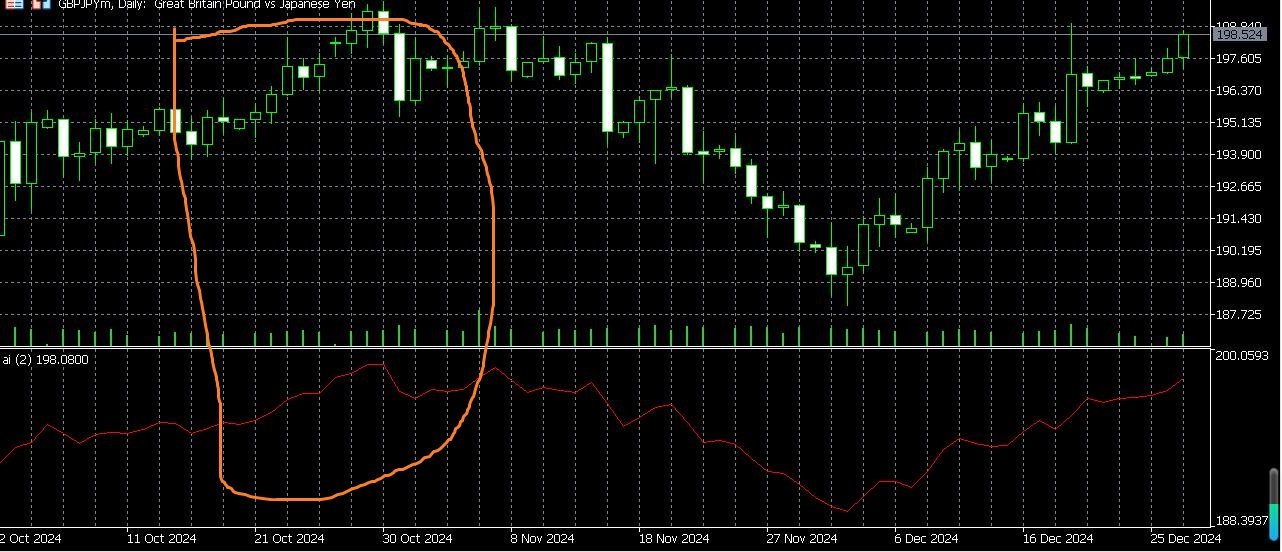
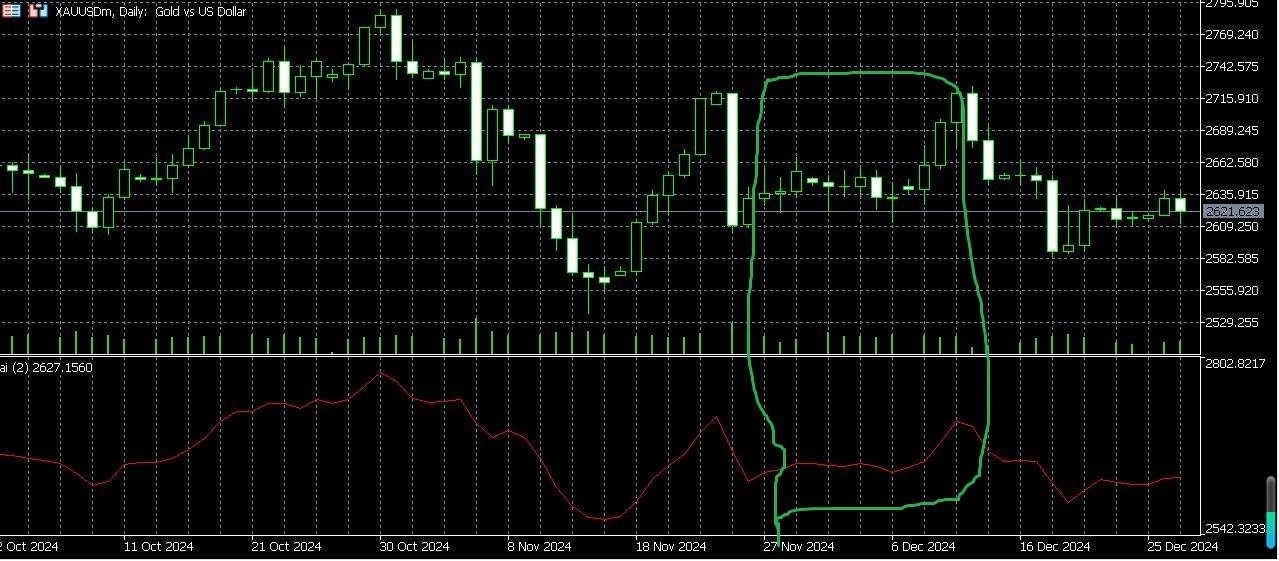
This indicator obeys the popular maxim that: "THE TREND IS YOUR FRIEND" It paints a GREEN line for BUY and also paints a RED line for SELL. (you can change the colors). It gives alarms and alerts of all kinds. IT DOES NOT REPAINT and can be used for all currency pairs and timeframes. Yes, as easy and simple as that. Even a newbie can use it to make great and reliable trades. NB: For best results, get my other premium indicators for more powerful and reliable signals. Get them here: https://www.m
Free automatic Fibonacci is an indicator that automatically plots a Fibonacci retracement based on the number of bars you select on the BarsToScan setting in the indicator. The Fibonacci is automatically updated in real time as new highest and lowest values appears amongst the selected bars. You can select which level values to be displayed in the indicator settings. You can also select the color of the levels thus enabling the trader to be able to attach the indicator several times with differe
Our offer also includes a free panel — Indicator Panel — which allows you to show or hide indicators created by BOToBRACIA.
High and Low Points is a practical technical analysis indicator that plots levels corresponding to the highs and lows from previous periods (day / week / month) — levels that, in the Smart Money Concepts (SMC) and ICT approach, are treated as liquidity zones, while in classical technical analysis they serve as potential support and resistance levels. Indicator settings:
•
The Penta-O is a 6-point retracement harmonacci pattern which usually precedes big market movements. Penta-O patterns can expand and repaint quite a bit. To make things easier this indicator implements a twist: it waits for a donchian breakout in the right direction before signaling the trade. The end result is an otherwise repainting indicator with a very reliable trading signal. The donchian breakout period is entered as an input. [ Installation Guide | Update Guide | Troubleshooting | FAQ | A
FlatBreakout MT5 (Free Version) Flat Range Detector and Breakout Panel for MT5 — GBPUSD Only FlatBreakout MT5 is the free version of the professional FlatBreakoutPro MT5 indicator, specially designed for flat (range) detection and breakout signals on the GBPUSD pair only.
Perfect for traders who want to experience the unique fractal logic of FlatBreakout MT5 and test breakout signals on a live market without limitations. Who Is This Product For? For traders who prefer to trade breakout of
GDS Renko Pip ST - Fixed Brick Renko Chart Tool for MetaTrader 5 GDS Renko Pip ST is a Renko chart tool for MetaTrader 5 designed for traders who want to build and study fixed brick Renko movement using a practical pip or point-based setup. The purpose of this tool is simple: create a cleaner Renko structure so the trader can observe direction, brick runs, pullbacks, support and resistance behavior without normal candle noise. This is not a signal indicator and it does not predict the market. It
Introducing VFI (Volume Flow Indicator) – a trading indicator that analyzes the relationship between volume and price movement to identify key trading opportunities. The indicator displays the strength and direction of volume flow, providing clear signals about potential entry and exit points. Signals are formed based on zero line crossovers, crossovers between the VFI line and its exponential moving average (EMA), and when the indicator exits overbought and oversold zones.
Attention! This stra
Donchian Channel is an indicator created by Richard Donchian. It is formed by taking the highest high and the lowest low of the last specified period in candles. The area between high and low is the channel for the chosen period.
Its configuration is simple. It is possible to have the average between the upper and lower lines, plus you have alerts when price hits one side. If you have any questions or find any bugs, please contact me. Enjoy!
Are you tired of drawing trendlines every time you're analyzing charts? Or perhaps you would like more consistency in your technical analysis. Then this is for you. This indicator will draw trend lines automatically when dropped on a chart. How it works Works similar to standard deviation channel found on mt4 and mt5. It has 2 parameters: 1. Starting Bar 2. Number of bars for calculation The starting bar is the bar which drawing of the trend lines will begin, while the number of bars for c
PROMETHEUS TECHNICAN VERSION Free | By THE SONS A gift from The Sons — no strings, no trial, no expiry. Every trader deserves access to professional-grade market intelligence. That belief is why Prometheus Technical Version exists, and why it costs nothing. Consider it our handshake to the trading community. What You're Getting This is not a simplified tool dressed up as a gift. Prometheus Technican Version is a fully built, institutional-quality technical analysis indicator running a dual-model
Introducing the MACD Enhanced – an advanced MACD (Moving Average Convergence Divergence) indicator that provides traders with extended capabilities for trend and momentum analysis in financial markets. The indicator uses the difference between the fast and slow exponential moving averages to determine momentum, direction, and strength of the trend, creating clear visual signals for potential entry and exit points. Attention! To achieve the best results, it is recommended to adapt the indicator
The Donchian Channel Channels are among the most popular tools of technical analysis, as they visually convey to the analyst the limits within which most price movement tends to occur. Channel users know that valuable information can be obtained at any time, whether prices are in the central region of a band or close to one of the border lines.
One of the best known techniques to explore these concepts is Bollinger Bands. However, John Bollinger was not the only one to research the application
This is the famous Sunflower indicator for Metatrader5. This indicator marks possible tops and bottoms on price charts. The indicator identifies tops and bottoms in the asset's price history, keep in mind that the current sunflower of the last candle repaints, as it is not possible to identify a top until the market reverses and it is also not possible to identify a bottom without the market stop falling and start rising. If you are looking for a professional programmer for Metatrader5, please
The indicator highlights the points that a professional trader sees in ordinary indicators. VisualVol visually displays different volatility indicators on a single scale and a common align. Highlights the excess of volume indicators in color. At the same time, Tick and Real Volume, Actual range, ATR, candle size and return (open-close difference) can be displayed. Thanks to VisualVol, you will see the market periods and the right time for different trading operations. This version is intended f
How it works – Base-departure detection — algorithmically finds consolidation bases (overlapping range with compressed volatility) followed by displacement departures. Patterns: Drop-Base-Rally, Rally-Base-Drop, Rally-Base-Rally, Drop-Base-Drop — detected structurally, not by candle names. – Strength score (0–100) — from departure velocity, time-at-base, freshness (each revisit decays the score), higher-timeframe confluence and origin volume. – Lifecycle — Fresh, Tested (decaying), Broken
Easy Correlations Indicator The Easy Correlations Indicator is designed to help traders analyze the relationship between two correlated instruments. By monitoring the distance between their Relative Strength Index (RSI) values, the indicator highlights situations where one instrument has moved significantly further than the other. This creates potential trading opportunities: Sell the stronger instrument (overstretched RSI) Buy the weaker instrument (lagging RSI) Because the positions are opened
Friend of the Trend: Your Trend Tracker Master the market with Friend of the Trend , the indicator that simplifies trend analysis and helps you identify the best moments to buy, sell, or wait. With an intuitive and visually striking design, Friend of the Trend analyzes price movements and delivers signals through a colorful histogram: Green Bars : Signal an uptrend, indicating buying opportunities. Red Bars : Alert to a downtrend, suggesting potential selling points. Orange Bars : Represent cons
This indicator displays Pivot-Lines, preday high and low, preday close and the minimum and maximum of the previous hour. You just have to put this single indicator to the chart to have all these important lines, no need to setup many single indicators.
Why certain lines are important Preday high and low : These are watched by traders who trade in a daily chart. Very often, if price climbs over or falls under a preday low/high there is an acceleration in buying/selling. It is a breakout out of a
VolumeBasedColorsBars — Free Powerful Volume Analysis for All Traders
Unlock the hidden story behind every price bar! VolumeBasedColorsBars is a professional-grade, 100% FREE indicator that colorizes your chart candles based on real, adaptive volume analysis. Instantly spot surges in market activity, identify exhaustion, and catch the moves that matter.
This indicator gives you: • Dynamic color-coded bars for instant volume context • Adaptive thresholds based on historical, session-awar
The idea of a Value Chart indicator was presented in the very good book I read back in 2020 , " Dynamic Trading Indicators: Winning with Value Charts and Price Action Profile ", from the authors Mark Helweg and David Stendahl. The idea is simple and the result is pure genius: Present candlestick Price analysis in a detrended way!
HOW TO READ THIS INDICATOR
Look for Overbought and Oversold levels. Of course, you will need to test the settings a lot to find the "correct" one for your approach. It
MSX Hybrid Heiken Scalper Overview MSX Hybrid Heiken Scalper is a MetaTrader 5 indicator based on a modified Heiken Ashi methodology with closed-bar smoothing. The indicator is designed to display trend direction through color-coded candles while reducing sensitivity to short-term market fluctuations. All calculations are performed using completed candles, allowing historical values to remain fixed after bar close. Features • Modified Heiken Ashi calculation • Closed-bar processing • Color-code
Indicator Description 4 Hull MA Color + Envelopes is a powerful trend-following indicator for MetaTrader 5 that combines four Hull Moving Averages (HMA) with Moving Average Envelopes to clearly identify market direction, trend strength, and potential reversal or pullback zones. This indicator is designed to reduce noise, react quickly to price movement, and provide a clean visual structure for professional trading. Key Features 4 Hull Moving Averages (20, 50, 100, 200) Automatic color change
The indicator is based on Robert Miner's methodology described in his book "High probability trading strategies" and displays signals along with momentum of 2 timeframes. A Stochastic oscillator is used as a momentum indicator.
The settings speak for themselves period_1 is the current timeframe, 'current' period_2 is indicated - the senior timeframe is 4 or 5 times larger than the current one. For example, if the current one is 5 minutes, then the older one will be 20 minutes The rest of the s
GDS Renko Pip ST Chart - Pip-Based Renko Chart Indicator for MetaTrader 5 GDS Renko Pip ST Chart is a pip-based Renko chart indicator for MetaTrader 5. It helps traders build and study cleaner Renko price movement using a practical fixed pip or point-based brick structure. This tool is designed as a Renko chart foundation for manual analysis. It does not predict the market, does not generate buy or sell signals and does not decide whether a trade should be opened. What Pip ST Chart Does Renko ch
Indicator alerts for Dual Relative strength index rsi. Large rsi preset at 14 is below 30 small rsi preset at 4 is below 10 for buy bullish signals .
Large rsi preset are 14 is above 70 small rsi preset at 4 is above 90 for sell bearish signals . Includes mobile and terminal alerts. draws lines when alerts.
This indicator can help identify extremes and then the tops or bottoms of those extremes .
The indicator draws daily support and resistance lines on the chart, as well as the Pivot level (reversal level).
Adapted to work in MT5
The standard timeframe for calculating support and resistance levels is D1. You can choose other timeframes according to your strategy (for example, for M1-M15, the optimal timeframe for calculations is H1)
The function for calculating support and resistance levels has been updated; in this calculation option, fibonacci levels are taken into account, respec
Welcome to ENTRY IN THE ZONE AND SMC MULTI TIMEFRAME Entry In The Zone and SMC Multi Timeframe is a professional trading indicator built on Smart Money Concepts (SMC) , combining market structure analysis with a No Repaint BUY / SELL signal system in a single indicator. It helps traders understand market structure more clearly, identify key price zones, and focus on higher-quality trading opportunities. By combining Multi-Timeframe Analysis , Points of Interest (POIs) , and real-time signals, th
Neuro Poseidon is a new indicator by Daria Rezueva. It combines precise trading signals with adaptive TP/SL levels - creating best possible trades as a result!
Message me and get Neuro Poseidon Assistant as a gift to automize your trading process!
What makes it stand out?
1. Proven profitability on all assets and timeframes
2. Only confirmed BUY and SELL signals present on the chart
3. Adaptive TP & SL levels generated by the software for each trade
4. Easy to understand - suitable for al
Crystal Heikin Ashi Signals - Professional Trend & Signal Detection Indicator Advanced Heikin Ashi Visualization with Intelligent Signal System for Manual & Automated Trading
Final Price: $149 ---------> Price goes up $10 after every 10 sales .
Limited slots available — act fast .
Overview Crystal Heikin Ashi Signals is a professional-grade MetaTrader 5 indicator that combines pure Heikin Ashi candle visualization with an advanced momentum-shift detection system. Designed for both manual traders
ARIPoint is a powerful trading companion designed to generate high-probability entry signals with dynamic TP/SL/DP levels based on volatility. Built-in performance tracking shows win/loss stats, PP1/PP2 hits, and success rates all updated live. Key Features: Buy/Sell signals with adaptive volatility bands Real-time TP/SL/DP levels based on ATR Built-in MA Filter with optional ATR/StdDev volatility Performance stats panel (Success, Profit/Loss, PP1/PP2) Alerts via popup, sound, push, or email Cu
GEM Signal Pro GEM Signal Pro 是一款適用於 MetaTrader 5 的趨勢跟隨指標,專為希望在圖表上獲得更清晰訊號、更有結構的交易設定,以及更實用風險管理的交易者而設計。 它不僅僅顯示一個簡單的箭頭,GEM Signal Pro 還能以更清晰、更易讀的方式呈現完整的交易思路。當條件確認完成後,指標可在圖表上顯示進場價、止損價與止盈目標,幫助交易者更有效率地評估交易設定。 運作方式 該指標首先根據其內部邏輯識別有效的初始訊號。 當確認條件滿足後,GEM Signal Pro 會在圖表上顯示完整的交易設定。這讓交易者可以更清楚地看到交易結構,並減少手動分析與計算的工作量。 圖表上的交易價位 對於已確認的訊號,GEM Signal Pro 可顯示: 進場價
止損價
止盈 1
止盈 2
止盈 3
風險報酬比 這讓交易設定更容易理解,也有助於讓圖表分析更有條理。 內建風險管理 風險管理是此指標設計的重要部分。 止損位基於近期市場結構,結合附近的擺動高低點與可選的 ATR 緩衝距離。這能讓交易價位更貼近當前市場條件,而不只是依賴固定距離。 圖表資訊面板 GEM Si
SMC Pro ToolKit is a professional chart-based Smart Money Concepts indicator for MetaTrader 5. It helps traders read market structure, identify key liquidity areas, organize trade context, and plan setups directly from the chart. This is not a simple buy/sell arrow indicator. It is a complete visual trading toolkit that combines Smart Money Concepts, multi-timeframe analysis, session context, setup planning, risk assistance, and professional dashboard tools in one clean workspace. Watch setup
FX Power:分析货币强度,助您做出更明智的交易决策 概述
FX Power 是一款专业工具,帮助您全面了解主要货币和黄金在任何市场条件下的真实强度。通过识别强势货币用于买入,弱势货币用于卖出, FX Power 简化了交易决策,并帮助您发现高概率的交易机会。不论您是想跟随趋势还是通过极端的 Delta 值预测反转,这款工具都能完美适应您的交易风格。别再盲目交易——用 FX Power 让您的交易更加智慧。
1. 为什么 FX Power 对交易者极具价值 实时货币和黄金强度分析
• FX Power 实时计算并显示主要货币和黄金的相对强度,助您全面了解市场动态。
• 监控领先或落后资产,轻松识别值得交易的货币对。 全面的多时间框架视图
• 跟踪短期、中期和长期时间框架的货币和黄金强度,以便将您的交易策略与市场趋势保持一致。
• 无论是快进快出的短线交易还是更长期的投资策略, FX Power 都能为您提供所需的信息。 Delta 动态分析用于趋势和反转
• 极端 Delta 值常常预示反转机会,而平缓的 Delta 变化则确认趋势延续。
• 使用 Delta 分析,轻
The Oracle Pro:用于 MT5 的合成多周期偏向引擎 ️ 夏季上市优惠 — 早期买家可以 199 USD 获得 The Oracle Pro。价格将随关注度上升;最终价格 399 USD。 The Oracle Pro 是一款面向高要求与专业交易者的 MetaTrader 5 高级多周期 偏向引擎 。它以纪律回答一个问题:当前每个周期的方向偏向是什么、强度如何、各周期之间的一致程度如何?一切仅在已收盘的 K 线上计算——绝不重绘。 The Oracle Pro 是一套多因子共识系统。它将专有指标与优化算法整合为单一而精密的共识向量,并在单个指标实例内,跨当前周期与更高周期的堆栈进行读取——而不是在多个图表上堆叠互不相关的工具。 它是 Oracle 共识方法的专业进化版:完整重建为高级操作控制台,面向希望在一个纪律化工作流中获得深度、多周期背景与背离洞察的交易者。 是偏向引擎,而非信号生成器 The Oracle Pro 明确自身定位。它是一款提供纪律化方向背景的 多周期多因子偏向指标 。它 不是 信号生成器:不承诺入场、出场或盈利。偏向是背景——你在其方向上交易自己的设置
SkyHammer Signal Pro Professional No-Repaint Trend Signal Indicator with Locked Entry, SL and TP Levels SkyHammer Signal Pro is a structured trend and momentum signal indicator designed for traders who want clear, fixed, and verifiable trading signals. It works best on lower timeframes such as M1 and M5 . The indicator does not try to predict tops or bottoms. Instead, it waits for confirmed market structure, trend direction, momentum strength, volatility quality, and target space before generati
BTMM State Engine Pro is a MetaTrader 5 indicator for traders who use the Beat The Market Maker approach: Asian session context, kill zone timing, level progression, peak formation detection, and a multi-pair scanner from a single chart. It combines cycle state logic with a built-in scanner dashboard so you do not need the same tool on many charts at once.
What it does
Draws the Asian session range; session times can follow broker server offset or be set in inputs. Tracks level progression (L
MACD indicator, first indicator, loading 3 cycles, 3 windows, 5-minute, 1-hour, 1-day chart, accurate comparison ,Can be used in conjunction with my EMA metrics, The other moving average indicator I sell on MQL5 can prevent volatile market conditions, The signal line needs to be fixed after the color changes, and then the signal direction can be confirmed,For example, for a 5-minute chart, you need to wait until the next 5 minutes to confirm that the signal direction is good
The principle behind this indicator is lost,In theory, In theory, it can load infinitely on the chart, but requires different parameters,Recommend 5, 10, 20,This indicator is more accurate in 5 minutes, 1 hour, and 1 day,Can be combined with my MACD to use together, https://www.mql5.com/zh/market/product/129184?source=Site +Profile+Seller ea, Indicator,Strategy Analysis,strategy optimization,Need to write,Provide strategy,Write EA, indicators,contact Telegram @r24231