ADX Dashboard
- 指标
- 版本: 4.10
- 更新: 12 四月 2026
- 激活: 10

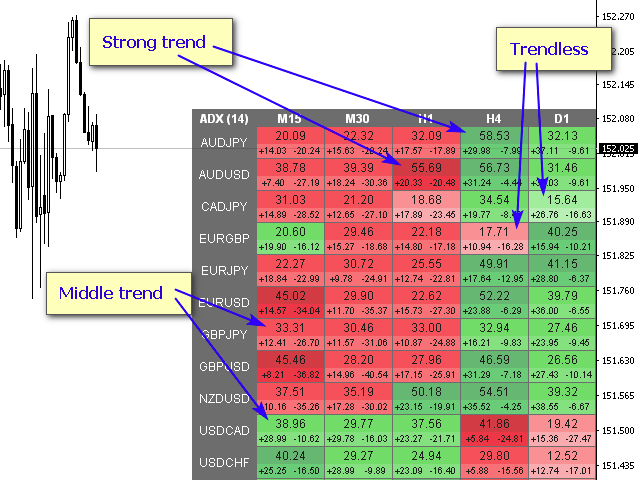
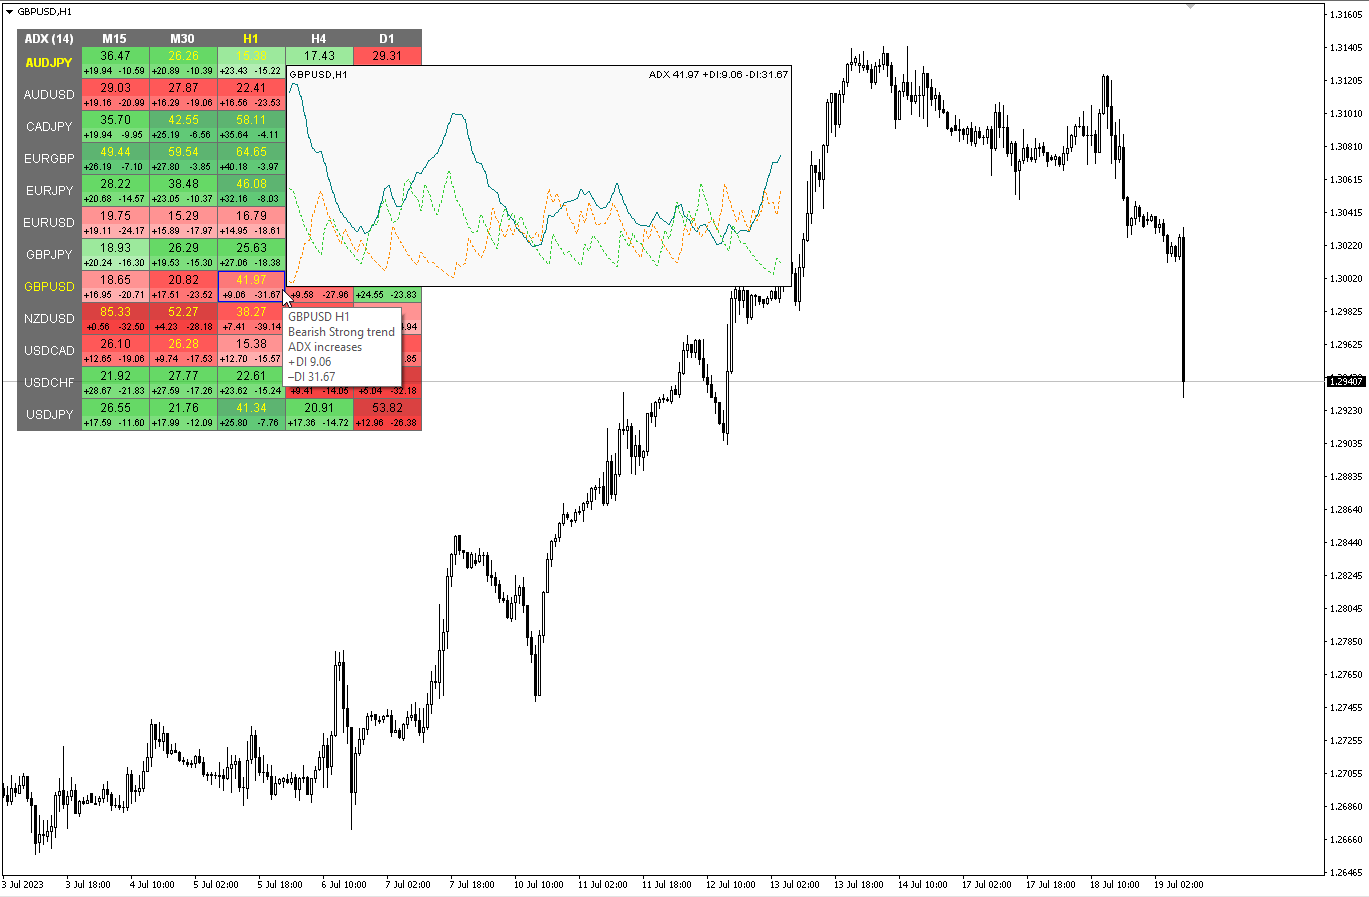
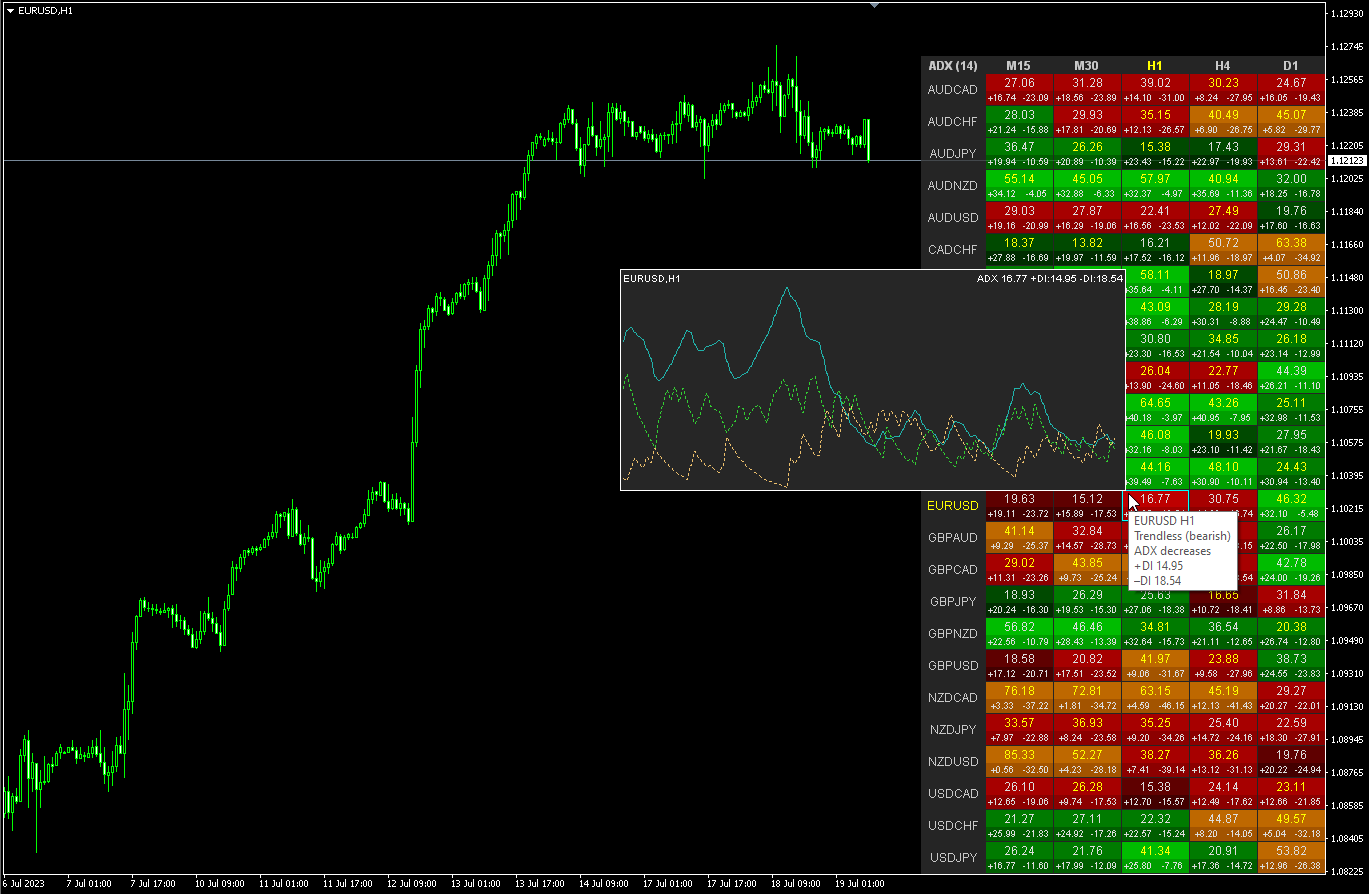
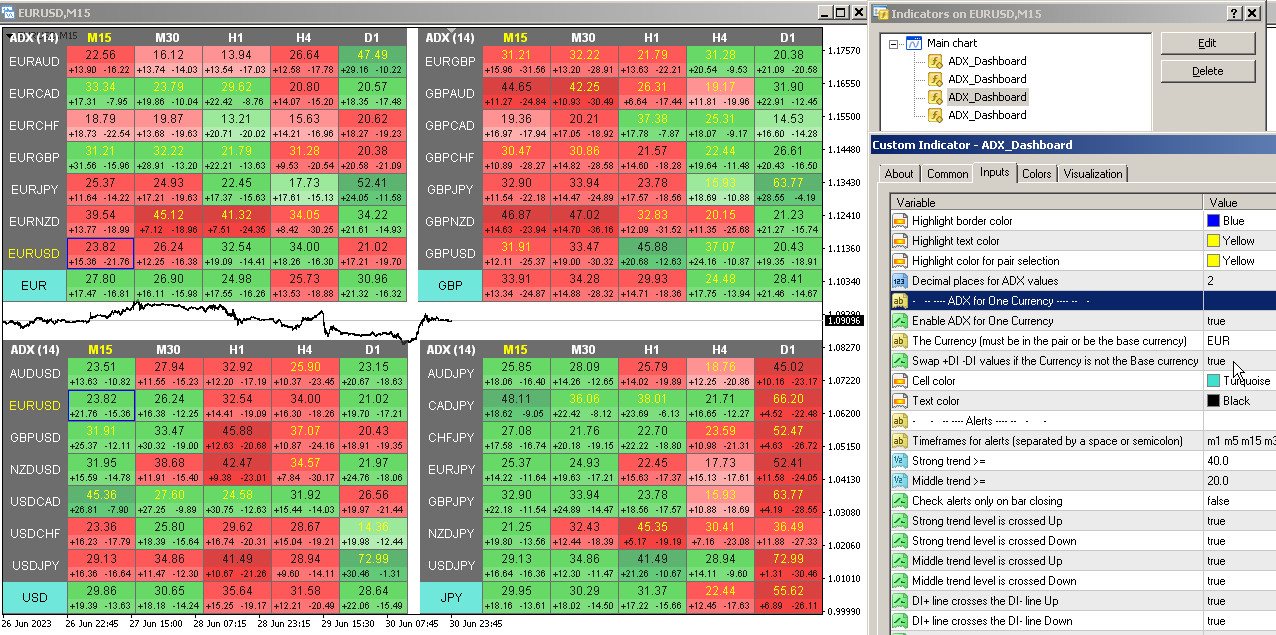
ADX 指标用于确定趋势及其强度。 价格的方向由 +DI 和 -DI 值显示,ADX 值显示趋势的强度。 如果+DI高于-DI,则市场处于上升趋势,如果相反,则市场处于下降趋势。 如果 ADX 低于 20,则没有明确的方向。 一旦指标突破该水平,中等强度的趋势就会开始。 值高于 40 表示强劲趋势(下降趋势或上升趋势)。
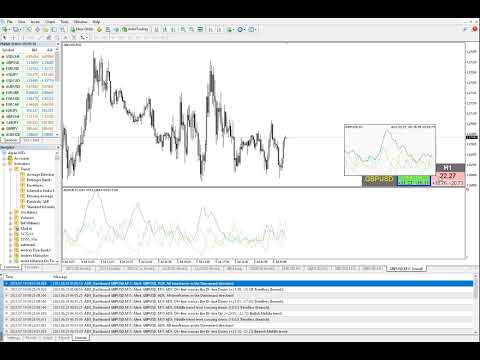
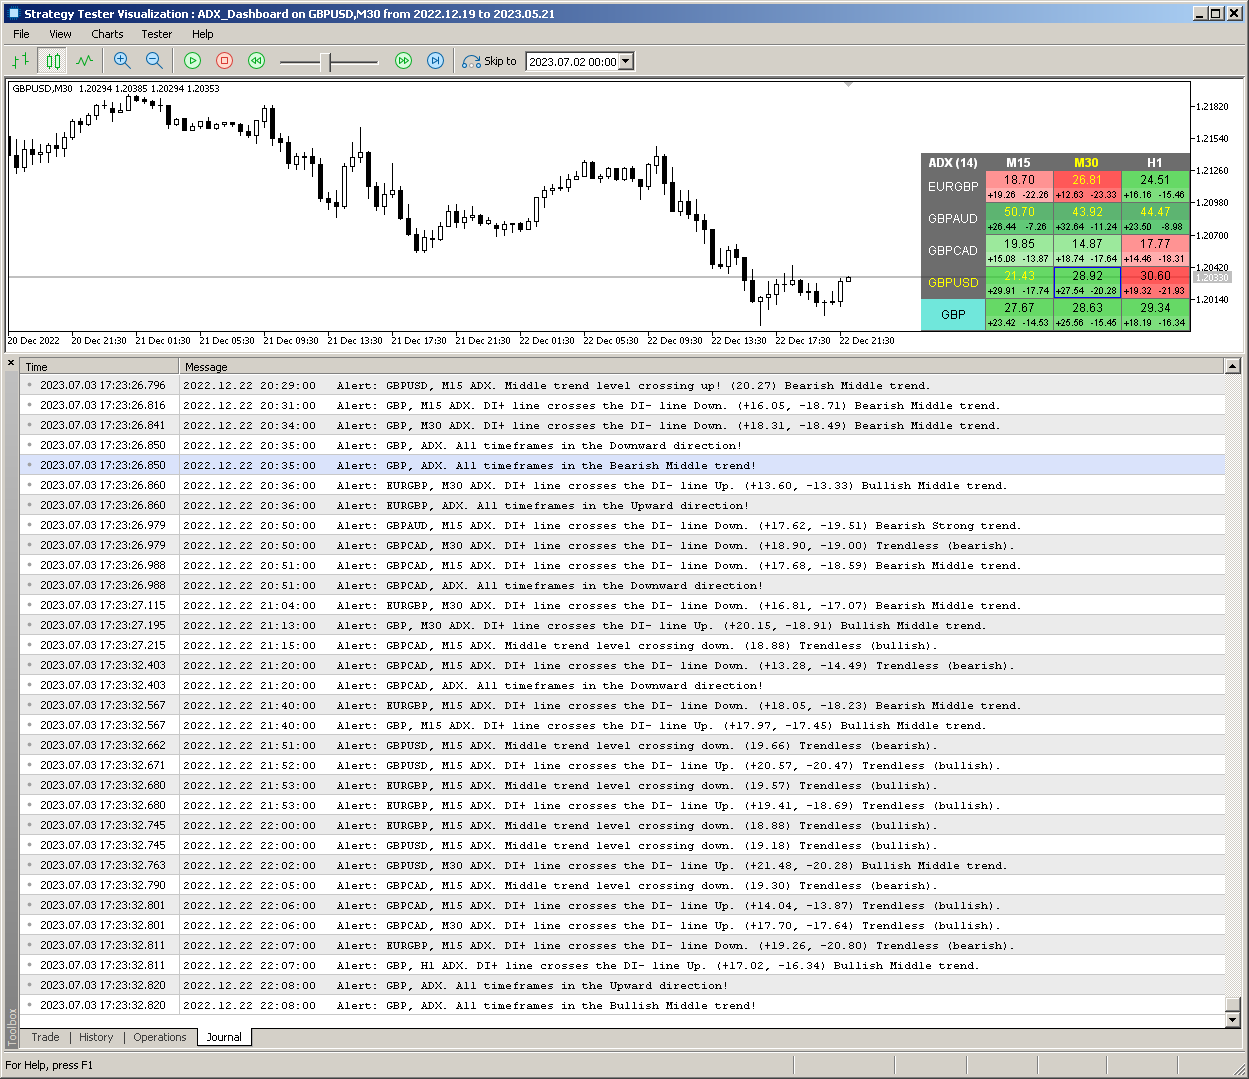
平均方向运动指数 (ADX) 指标的多货币和多时间框架修改。 您可以在参数中指定任何所需的货币和时间范围。 此外,当趋势强度水平被交叉时,以及当 +DI 和 -DI 线被交叉时,指标可以发送通知。 通过单击带有句点的单元格,将打开该符号和句点。 这是 MTF 扫描仪。
与货币强度计类似,仪表板可以自动选择包含指定货币的货币对,或以该货币为基础货币的货币对。该指标在“货币对集合”中指定的所有货币对中搜索货币;其他货币对将被忽略。并根据这些货币对计算该货币的总 ADX。您可以看到该货币的强弱程度。
默认情况下,从图表中隐藏仪表板的键是“D”
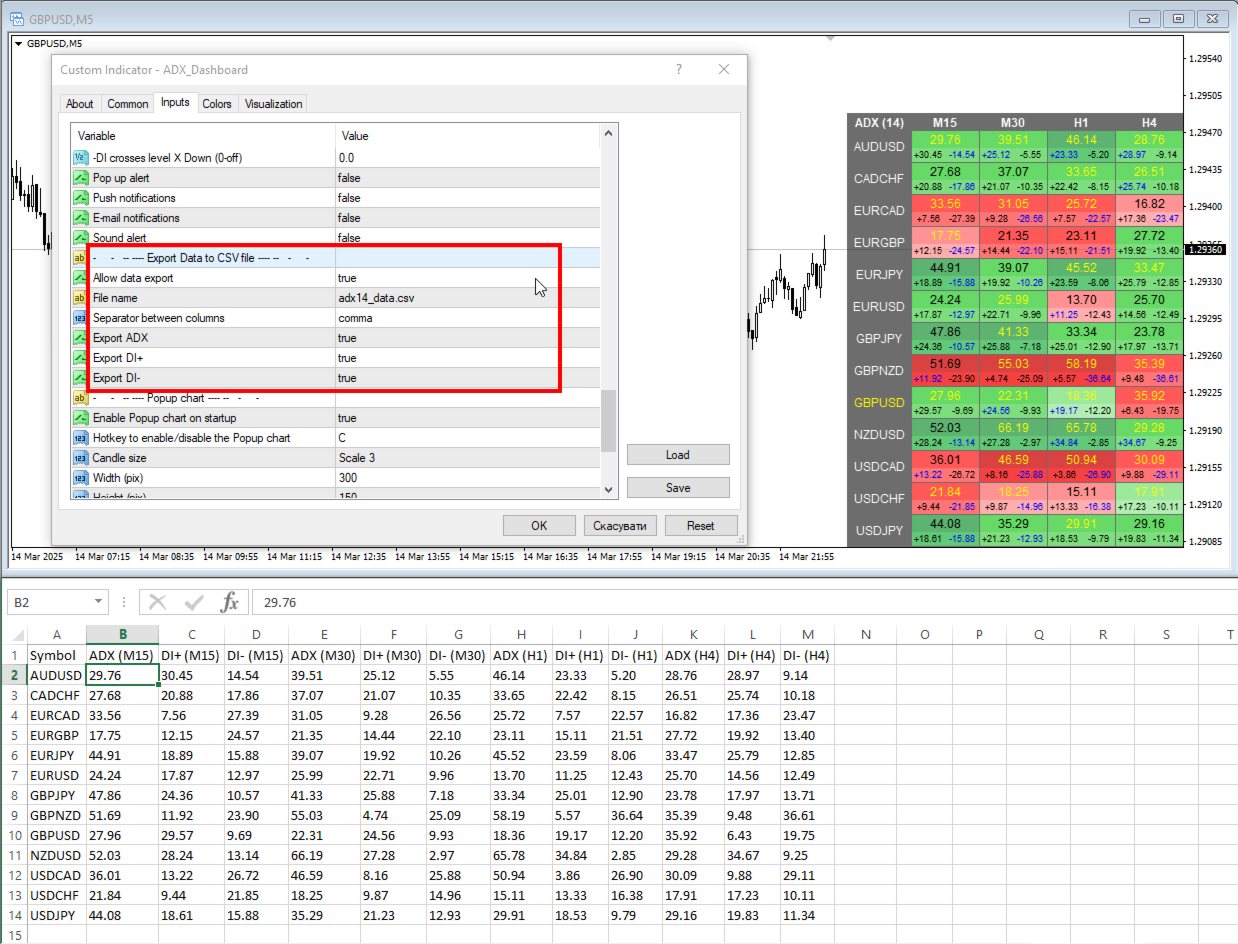
您可以将数据从 ADX 仪表板导出到 CSV 文件。该文件将保存到终端文件夹:\MQL4\Files。
数据将根据计时器 - “每隔(秒)刷新仪表板”进行记录。
要在 Excel 中打开时更新保存的文件,您需要通过“数据选项卡”-“从文本获取外部数据”将其打开。然后仪表板和 Excel 中将更新该文件。
参数
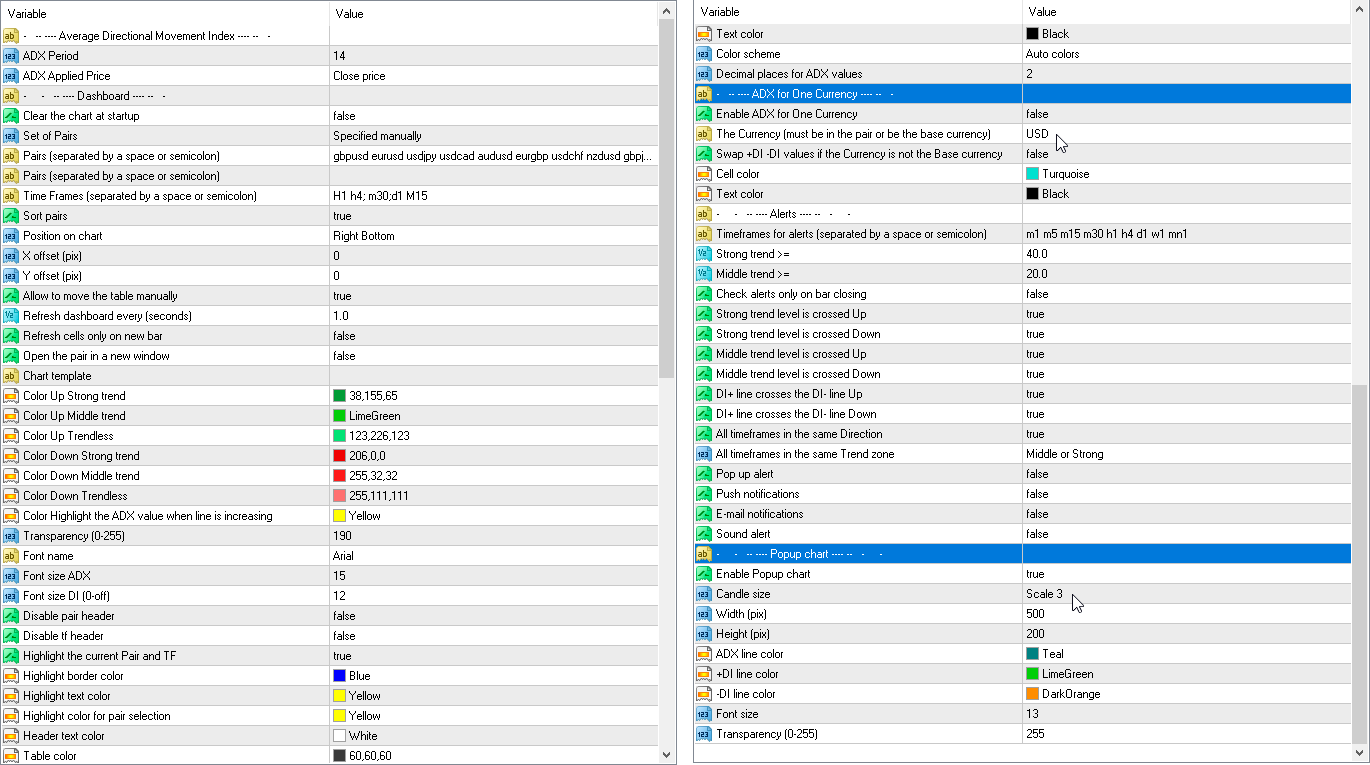
ADX Period — 平均周期。
ADX Applied Price — 价格类型。
Clear the chart at startup — 启动时清除图表
Set of Pairs — 符号集
— Market Watch — 来自 MT 的“市场观察”的货币对。— Specified manually — 在参数“Pairs”中手动指定对。— Current pair — 仅显示当前对。
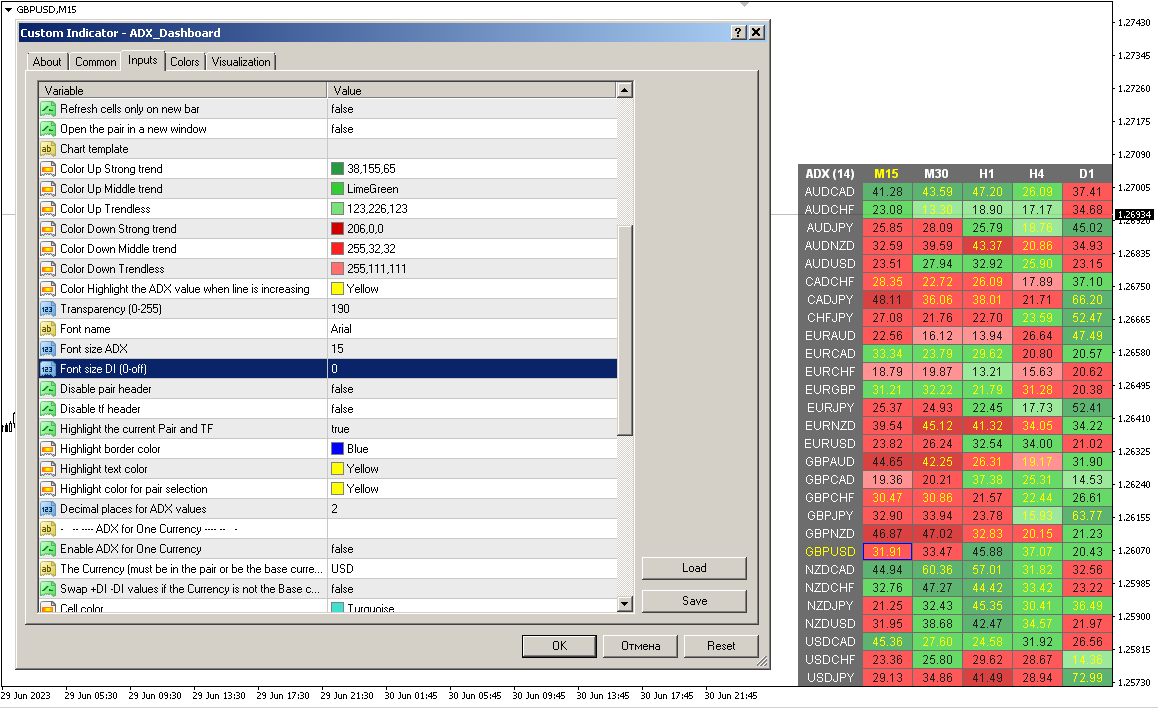
Pairs (separated by a space or semicolon) — 由空格或分号分隔的符号列表。 货币名称的书写方式应与经纪商的名称完全相同,并保留大小写和前缀/后缀。
Time Frames (separated by a space or semicolon) — 由空格或分号分隔的时间范围列表(多个时间范围)。
Sort pairs — 对对列表进行排序。
Position on chart — 在图表上显示面板的角落。
X offset (pix) — 沿 X 轴移动面板。
Y offset (pix) — 沿 Y 轴移动面板。
Allow to move the table manually - 允许使用鼠标移动桌子。
Refresh dashboard every (seconds) — 所有货币对和时间范围的更新周期。
Refresh cells only on new bar - 仅当出现新栏时才会发生单元格更新(和警报)。
Open the pair in a new window — 通过单击在新图表窗口中打开交易品种。
Chart template — 图表模板的名称(如果图表在新窗口中打开)。
颜色设置
Color Up Strong trend — 如果存在强趋势,则单元格颜色。
Color Up Middle trend — 单元格颜色(如果是中间趋势)。
Color Up Trendless — 如果没有趋势,则单元格颜色。
Color Down Strong trend — 如果存在强趋势,则单元格颜色。
Color Down Middle trend — 单元格颜色(如果是平均趋势)。
Color Down Trendless — 如果没有趋势,则单元格颜色。
Transparency (0-255) — 面板的透明度。
Font name - 字体名称。
Font size - 字体大小 ADX。
Font size DI (0-off) - 字体大小 DI(0 关闭)。
警报
Timeframes for alerts (separated by a space or semicolon) — 发送警报的时间段列表(以空格或分号分隔)。
Strong trend >= — 强趋势的水平
Middle trend >= — 中间趋势的水平。
Check alerts only on bar closing - 仅在柱收盘后检查平交。
Strong trend level is crossed Up — 当 ADX 交叉强趋势水平时发出警报。
Strong trend level is crossed Down — 当 ADX 交叉强趋势水平向下时发出警报。
Middle trend level is crossed Up — 当中间趋势水平向上交叉时发出警报。
Middle trend level is crossed Down — 当中间趋势水平向下交叉时发出警报。
DI+ line crosses the DI- line Up — 当 DI+ 与 DI- 向上交叉时发出警报。
DI+ line crosses the DI- line Down — 当 DI+ 向下穿过 DI- 时发出警报。
All timeframes in the same direction - 当所有单元格显示相同方向时发出警报。
DI+ changes direction - DI+改变方向。
DI- changes direction - DI-改变方向。
DI+ crosses level X (0-off) - DI+ 穿过 X 级(0 关闭)。
DI- crosses level X (0-off) - DI- 穿过 X 级(0 关闭)。
Pop up alert - 弹出警报。
Push notifications - 推送通知。
E-mail notifications - 电子邮件通知。
Sound alert - 声音警报。
Export Data to CSV file
Allow data export
File name
Separator between columns
Export ADX
Export DI+
Export DI-
Allow data export
File name
Separator between columns
Export ADX
Export DI+
Export DI-
弹出图表
Enable Popup chart - 启用弹出图表
Candle size - 蜡烛尺寸
Width (pix) - 宽度(像素)
Height (pix) - 高度(像素)
Font size - 字体大小
Transparency (0-255) - 透明度(0-255)


Another excellent piece of work from this talented programmer!
A thousand thanks, Taras!