ADX Dashboard
- Indicatori
- Versione: 4.10
- Aggiornato: 12 aprile 2026
- Attivazioni: 10

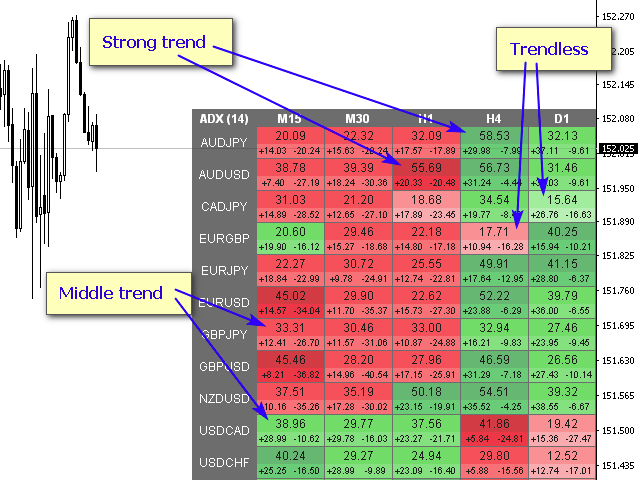
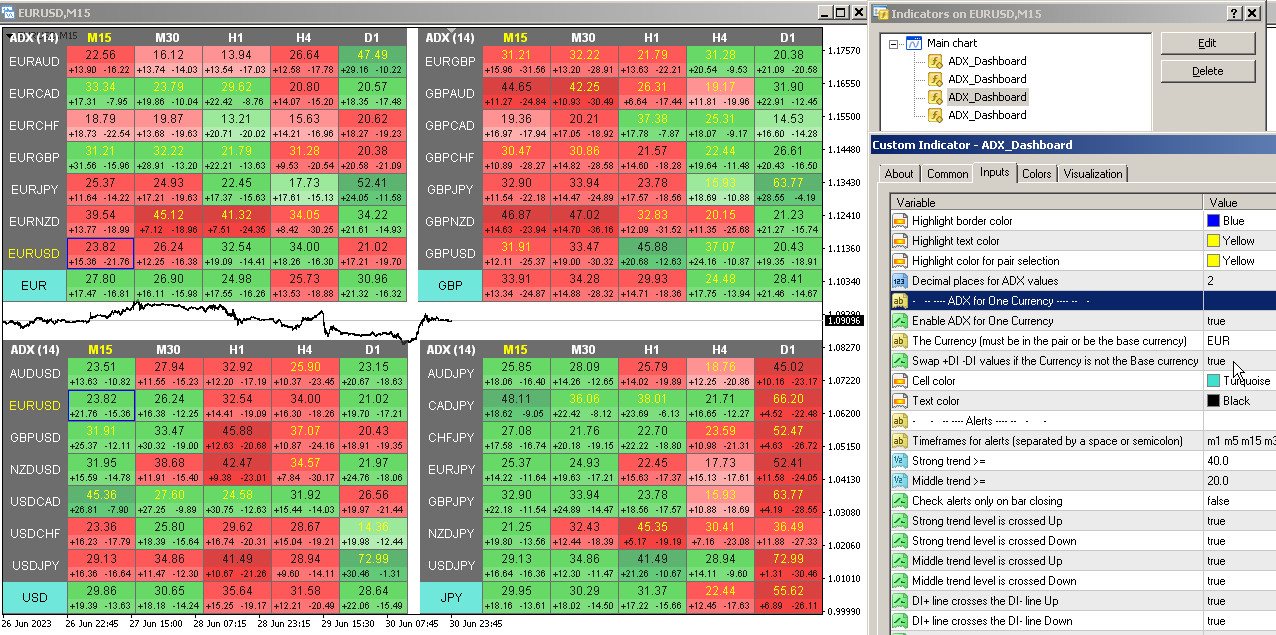
L'indicatore ADX viene utilizzato per determinare la tendenza e la sua forza. La direzione del prezzo è mostrata dai valori +DI e -DI e il valore ADX mostra la forza del trend. Se +DI è superiore a -DI, il mercato è in un trend rialzista, se al contrario è in un trend al ribasso. Se l'ADX è inferiore a 20, non esiste una direzione definita. Non appena l'indicatore supera questo livello, inizia un trend di media forza. Valori superiori a 40 indicano un trend forte (un trend al ribasso o al rialzo).
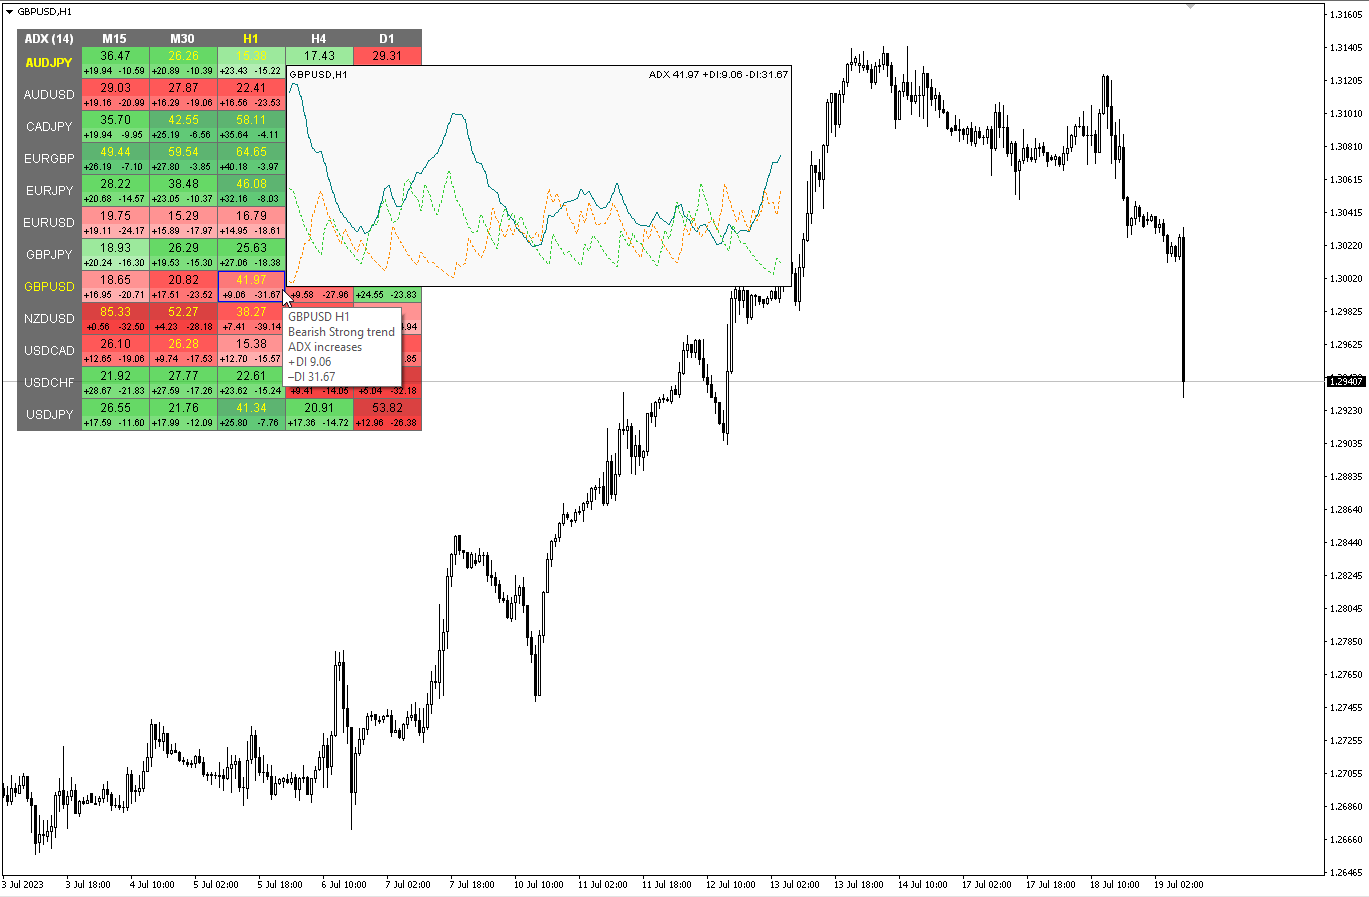
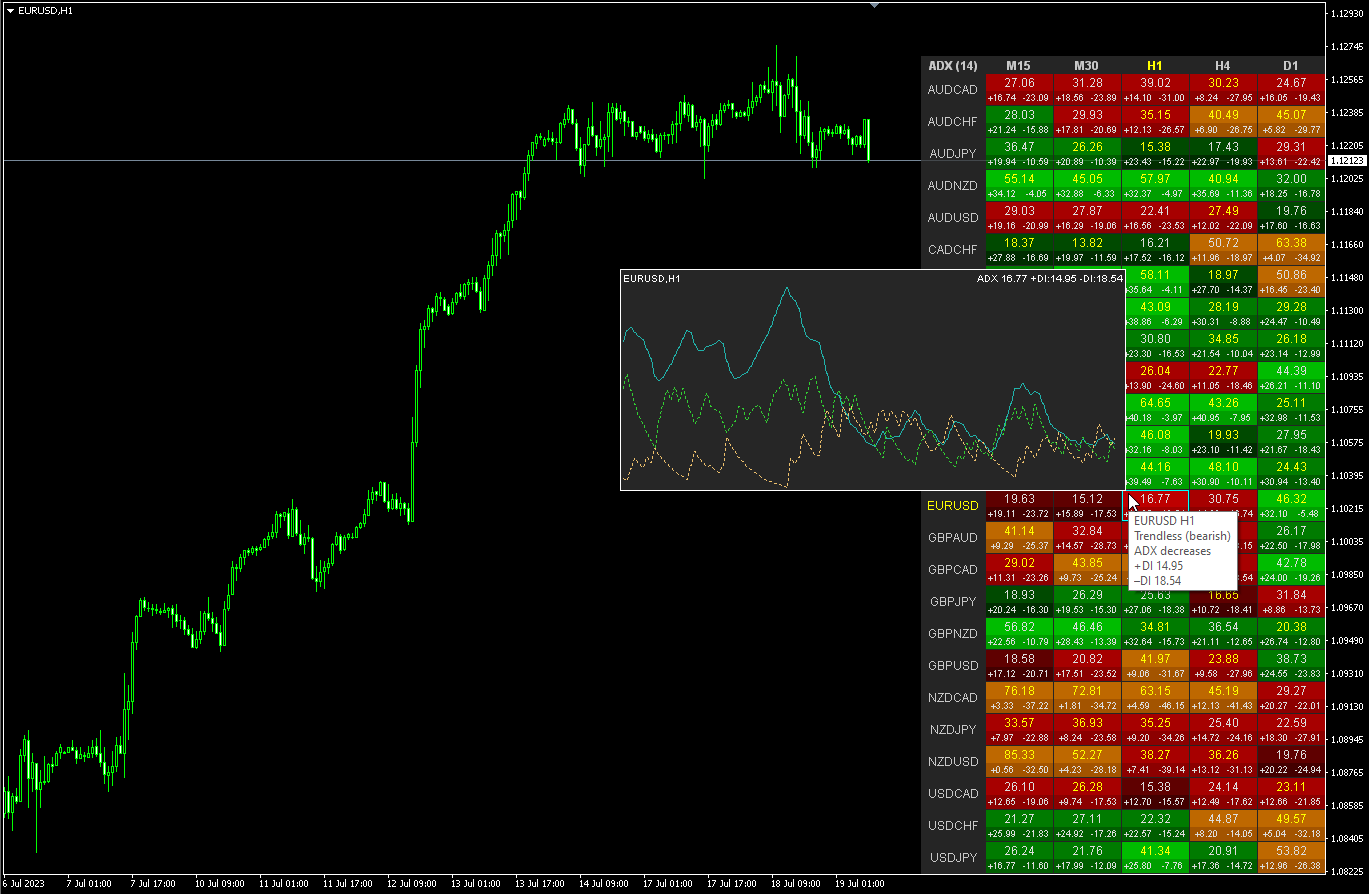
Modifica multivaluta e multitimeframe dell'indicatore Average Directional Movement Index (ADX). È possibile specificare qualsiasi valuta e intervallo di tempo desiderati nei parametri. Inoltre, l'indicatore può inviare notifiche quando vengono superati i livelli di forza del trend e quando vengono superate le linee +DI e -DI. Cliccando su una cella con un punto, questo simbolo e punto verranno aperti. Questo è lo scanner MTF.
Similmente al Valuta Strength Meter (CSM), la Dashboard può selezionare automaticamente le coppie che contengono una valuta specifica, o quelle coppie che hanno quella valuta come valuta base. L'indicatore cerca la valuta in tutte le coppie specificate nel “Set di coppie”; le altre coppie vengono ignorate. E sulla base di queste coppie, viene calcolato l'ADX totale per questa valuta. E puoi vedere quanto è forte o debole quella valuta.
La chiave per nascondere la dashboard dal grafico è "D" per impostazione predefinita
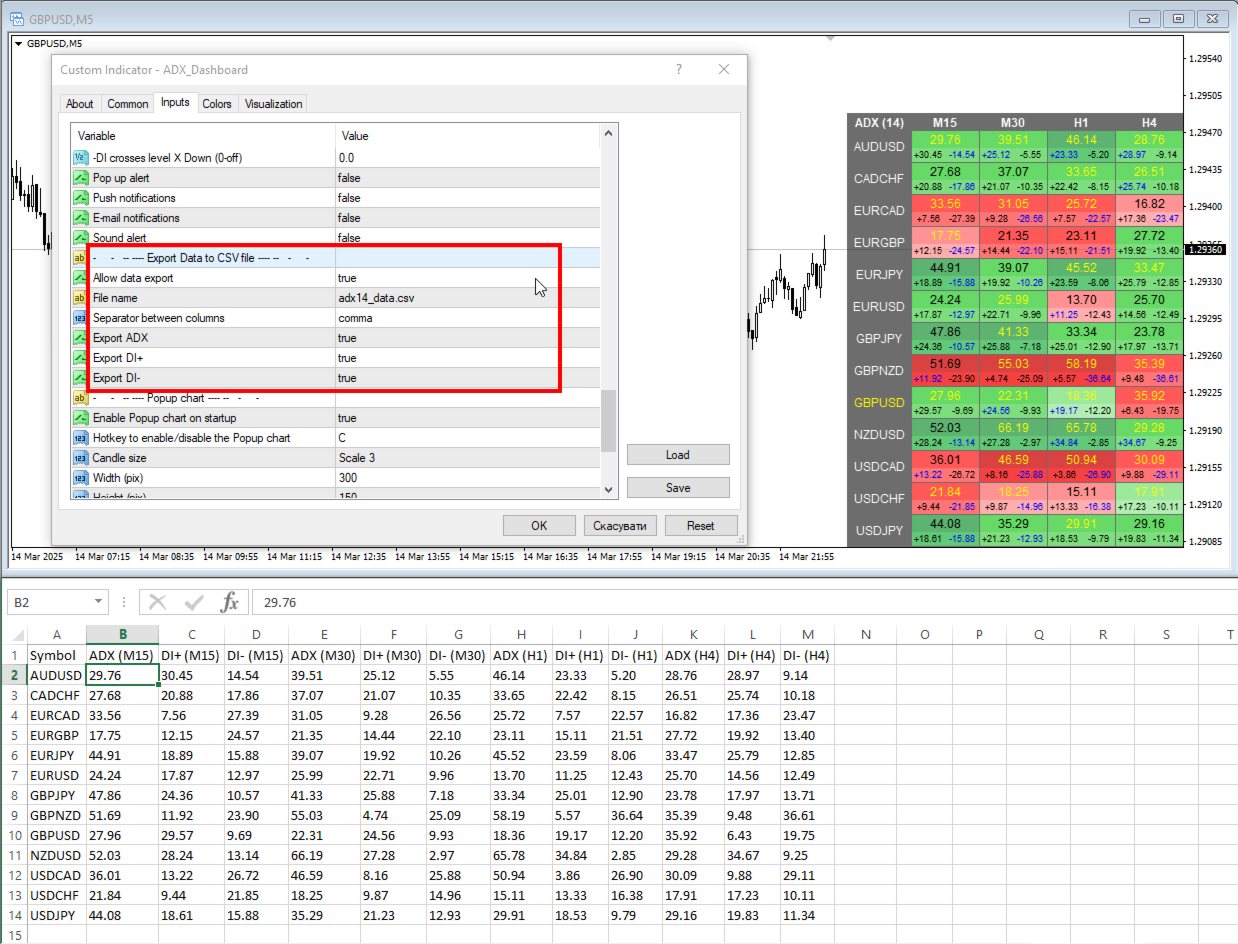
Puoi esportare i dati da ADX Dashboard in un file CSV. Il file verrà salvato nella cartella del terminale: \MQL4\Files.
I dati verranno registrati in base al timer - "Aggiorna dashboard ogni (secondi)".
Per aggiornare il file salvato quando viene aperto in Excel, devi aprirlo tramite "Scheda dati" - "Ottieni dati esterni dal testo". Quindi il file verrà aggiornato dalla dashboard e in Excel.
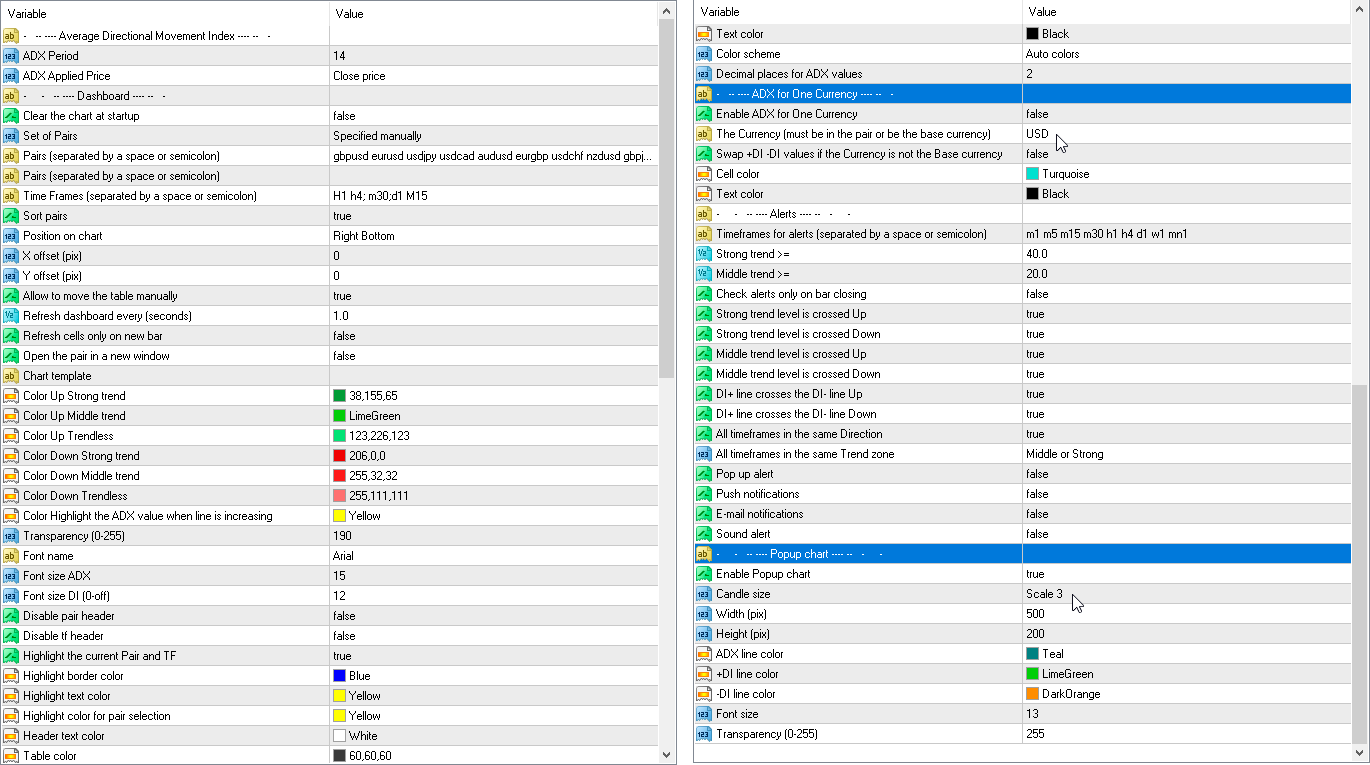
Parametri
ADX Period — periodo di media.
ADX Applied Price — tipo di prezzo.
Clear the chart at startup — cancella il grafico all'avvio
Set of Pairs — insieme di simboli:
— Market Watch — Coppie da "Market Watch" del MT.— Specified manually — coppie specificate manualmente, nei parametri "Coppie".— Current pair — mostra solo la coppia attuale.
Pairs (separated by a space or semicolon) — elenco di simboli separati da spazi o punto e virgola. I nomi delle valute dovrebbero essere scritti esattamente come quelli del broker, mantenendo maiuscole e minuscole e prefisso/suffisso.
Time Frames (separated by a space or semicolon) — elenco di intervalli temporali separati da spazi o punti e virgola (intervallo temporale multiplo).
Sort pairs — ordina l'elenco delle coppie.
Position on chart — angolo per visualizzare il pannello sulla carta.
X offset (pix) — sposta il pannello lungo l'asse X.
Y offset (pix) — sposta il pannello lungo l'asse Y.
Allow to move the table manually — consente di spostare la tabella con il mouse.
Refresh dashboard every (seconds) — periodo di aggiornamento per tutte le coppie e gli intervalli di tempo.
Refresh cells only on new bar — gli aggiornamenti delle celle (e gli avvisi) verranno eseguiti solo quando viene visualizzata una nuova barra.
Open the pair in a new window — apri un simbolo in una nuova finestra del grafico facendo clic.
Chart template — il nome del modello per il grafico, se il grafico si apre in una nuova finestra.
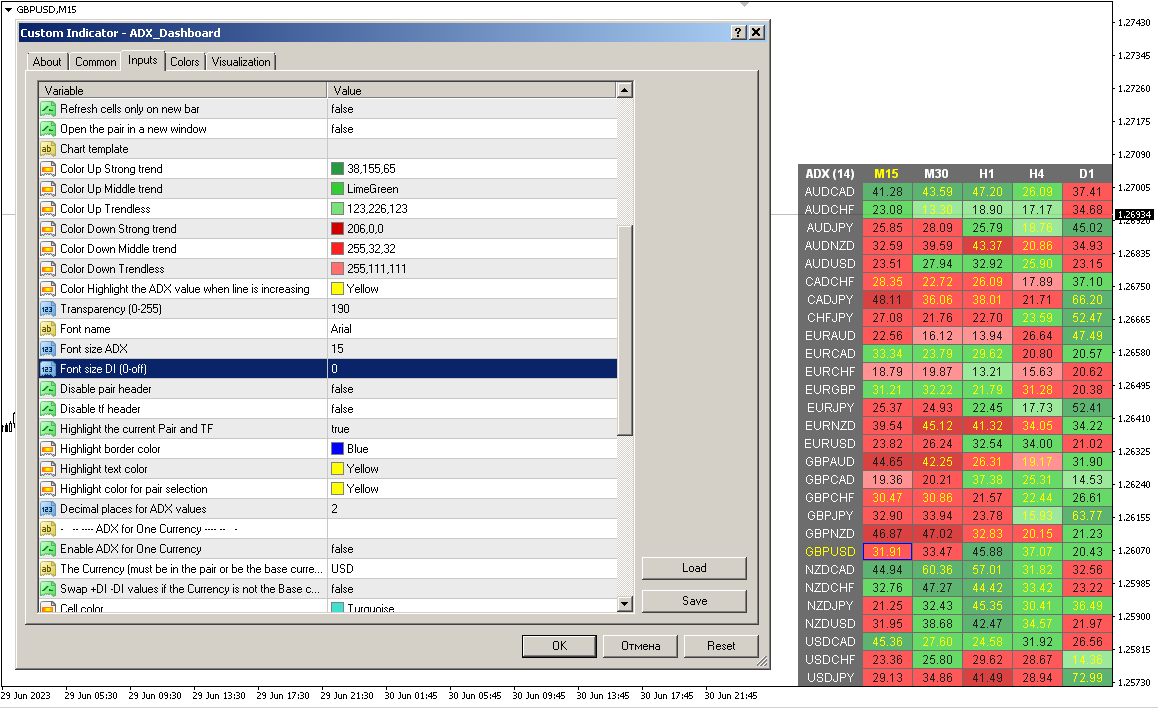
Impostazioni del colore
Color Up Strong trend — colore della cella se è presente una tendenza forte.
Color Up Middle trend — colore della cella, se si tratta della tendenza centrale.
Color Up Trendless — colore della cella se non è presente alcuna tendenza.
Color Down Strong trend — colore della cella se è presente una tendenza forte.
Color Down Middle trend — colore della cella, se la tendenza media.
Color Down Trendless — colore della cella se non è presente alcuna tendenza.
Transparency (0-255) — trasparenza del pannello.
Font name — Nome del carattere.
Font size ADX — Dimensione carattere ADX.
Font size DI (0-off) — Dimensione carattere DI (0-off).
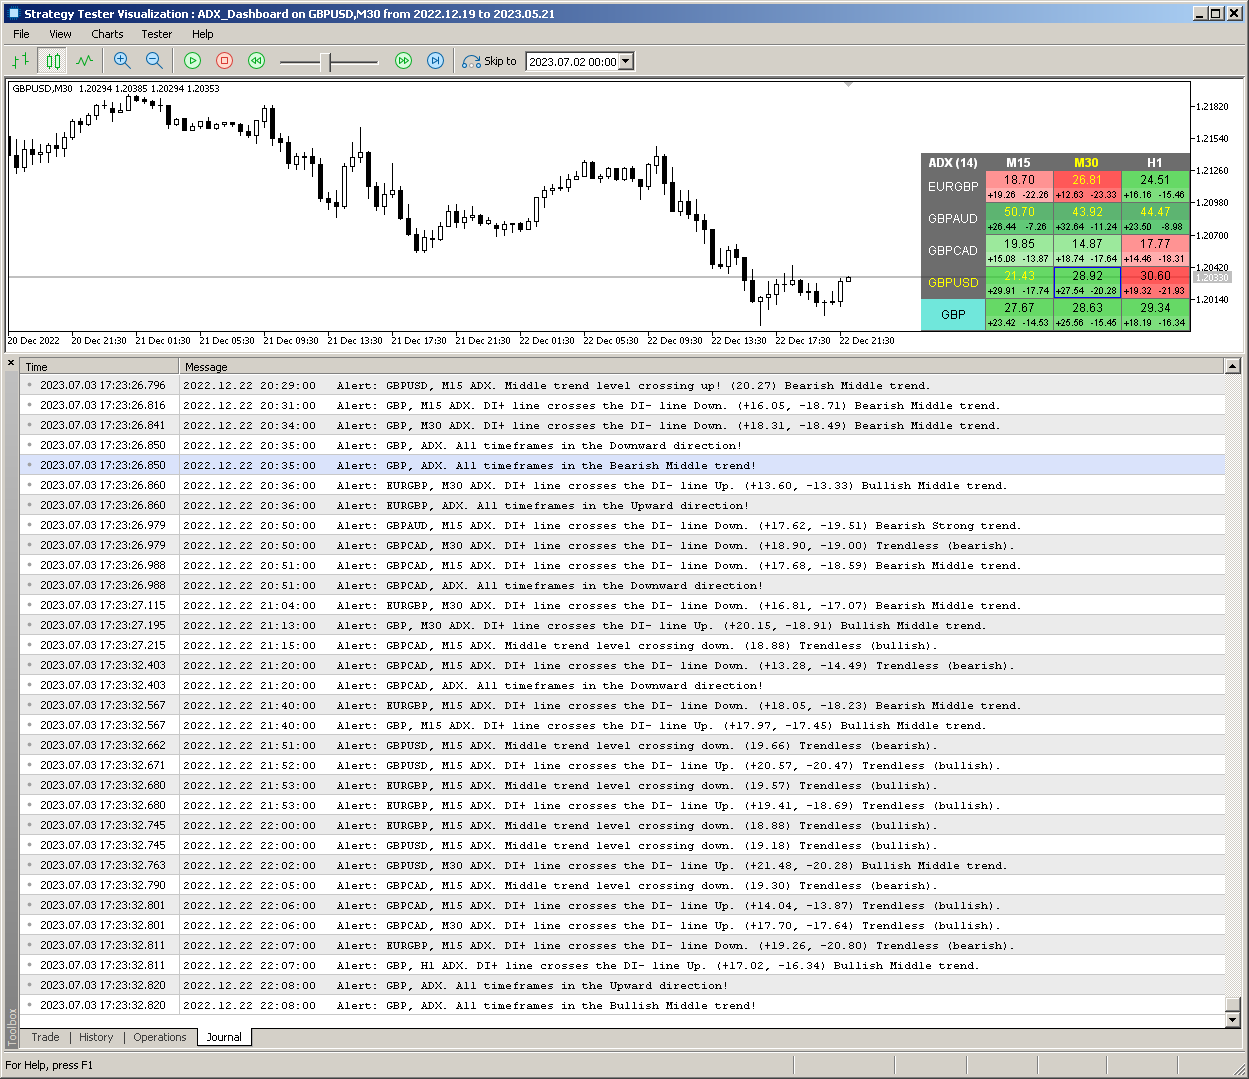
Avvisi
Timeframes for alerts (separated by a space or semicolon) — elenco dei periodi per i quali verrà inviato l'avviso (separati da uno spazio o un punto e virgola).
Strong trend >= — il livello di un trend forte
Middle trend >= — il livello della tendenza media.
Check alerts only on bar closing — controlla il passaggio a livello solo dopo la chiusura della sbarra.
Strong trend level is crossed Up — avvisa quando l'ADX supera il livello di un forte trend al rialzo.
Strong trend level is crossed Down — avvisa quando l'ADX supera il livello di un forte trend al ribasso.
Middle trend level is crossed Up — avvisa quando il livello del trend medio viene superato verso l'alto.
Middle trend level is crossed Down — avvisa quando il livello del trend medio viene superato verso il basso.
DI+ line crosses the DI- line Up — avvisa quando DI+ attraversa DI-su.
DI+ line crosses the DI- line Down — avvisa quando DI+ attraversa DI- giù.
All timeframes in the same direction — avvisa quando tutte le celle mostrano la stessa direzione.
DI+ changes direction — DI+ cambia direzione.
DI- changes direction — DI- cambia direzione.
DI+ crosses level X (0-off) — DI+ attraversa il livello X (0-off).
DI- crosses level X (0-off) — DI- attraversa il livello X (0-off).
Pop up alert — Avviso pop-up.
Push notifications — Le notifiche push.
E-mail notifications — Notifiche di posta elettronica.
Sound alert — Avviso sonoro.
Export Data to CSV fileAllow data export
File name
Separator between columns
Export ADX
Export DI+
Export DI-
Grafico popup
Enable Popup chart — Abilita grafico popup
Candle size — Dimensione della candela
Width (pix) — Larghezza (pix)
Height (pix) — Altezza (pix)
Font size — Dimensione del font
Transparency (0-255) — Trasparenza (0-255)


Another excellent piece of work from this talented programmer!
A thousand thanks, Taras!