ADX Dashboard
- インディケータ
- バージョン: 4.10
- アップデート済み: 12 4月 2026
- アクティベーション: 10

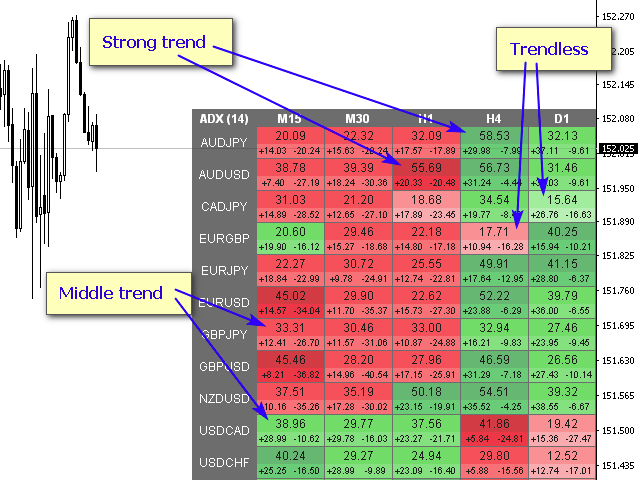
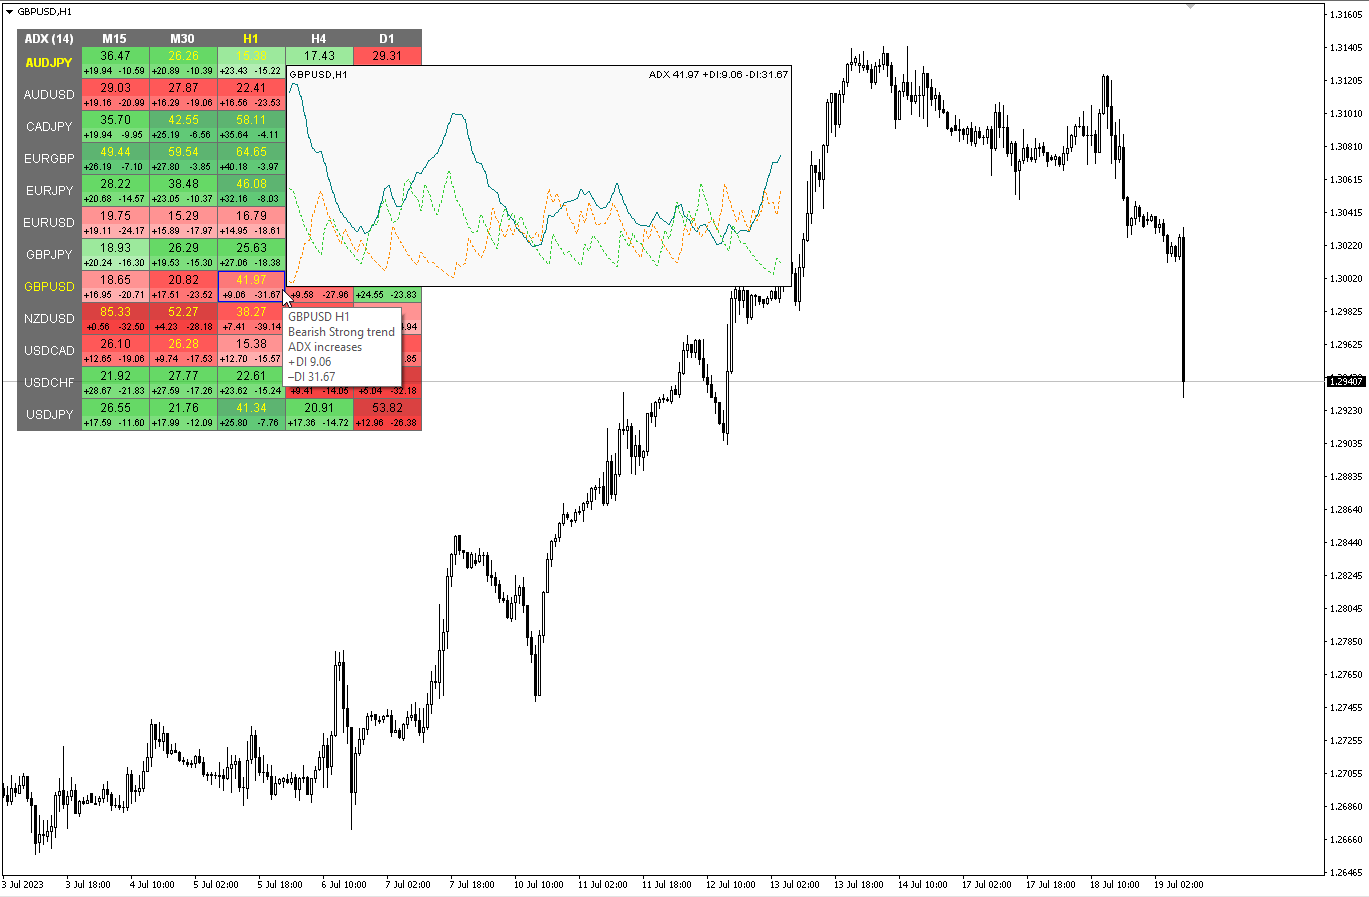
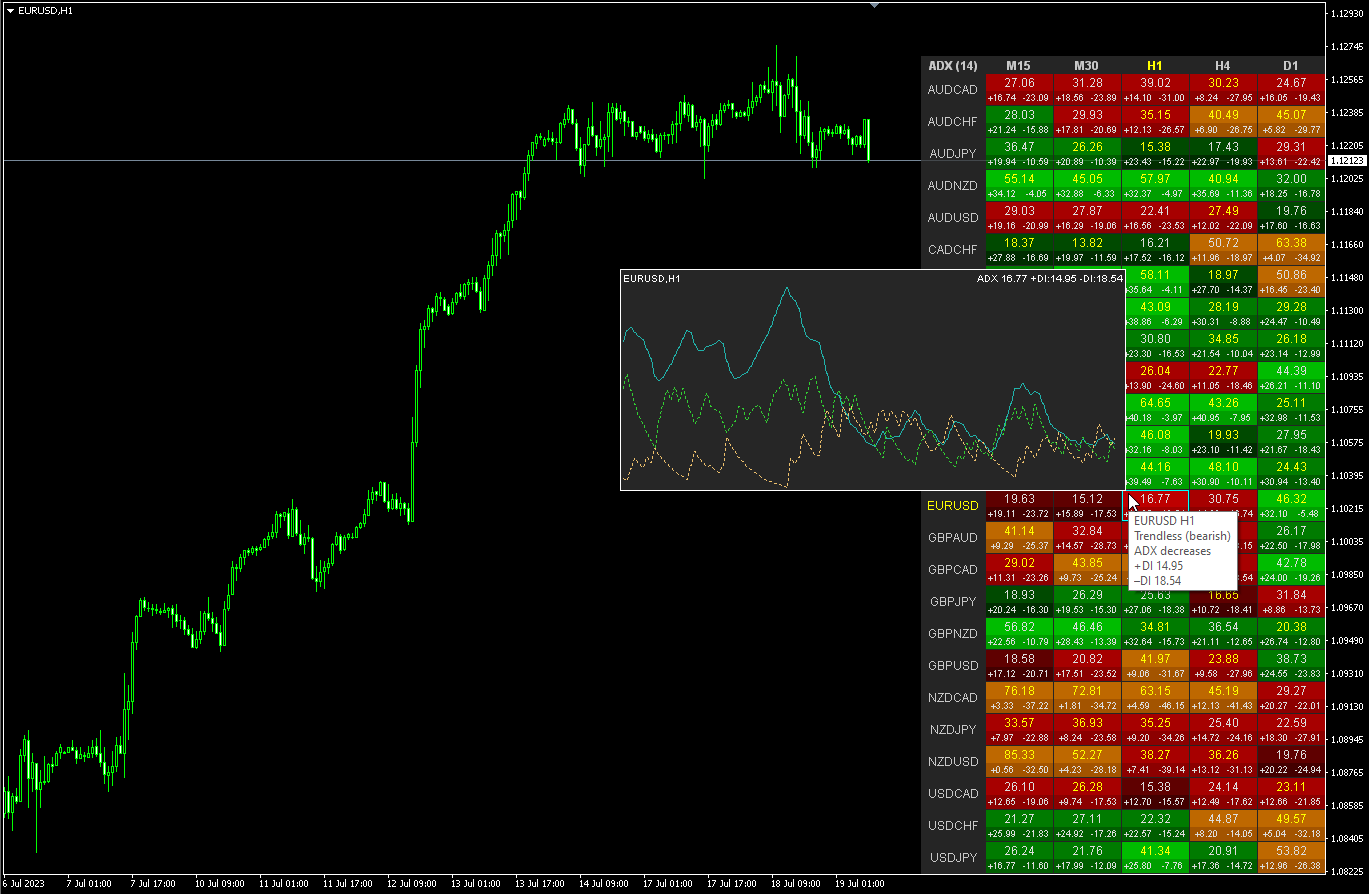
ADX インジケーターは、トレンドとその強さを判断するために使用されます。価格の方向は +DI と -DI の値で示され、ADX 値はトレンドの強さを示します。+DI が -DI より上であれば、市場は上昇傾向にあり、反対であれば下降傾向にあります。ADX が 20 より下であれば、明確な方向性はありません。インジケーターがこのレベルを突破するとすぐに、中程度の強さのトレンドが始まります。40 を超える値は、強いトレンド (下降トレンドまたは上昇トレンド) を示します。
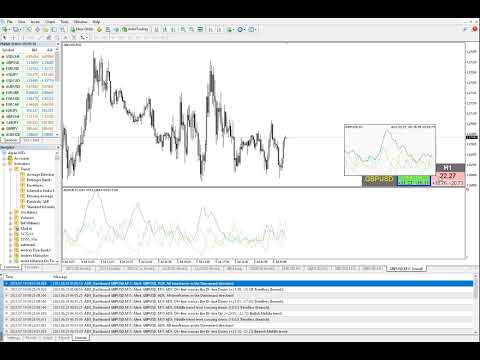
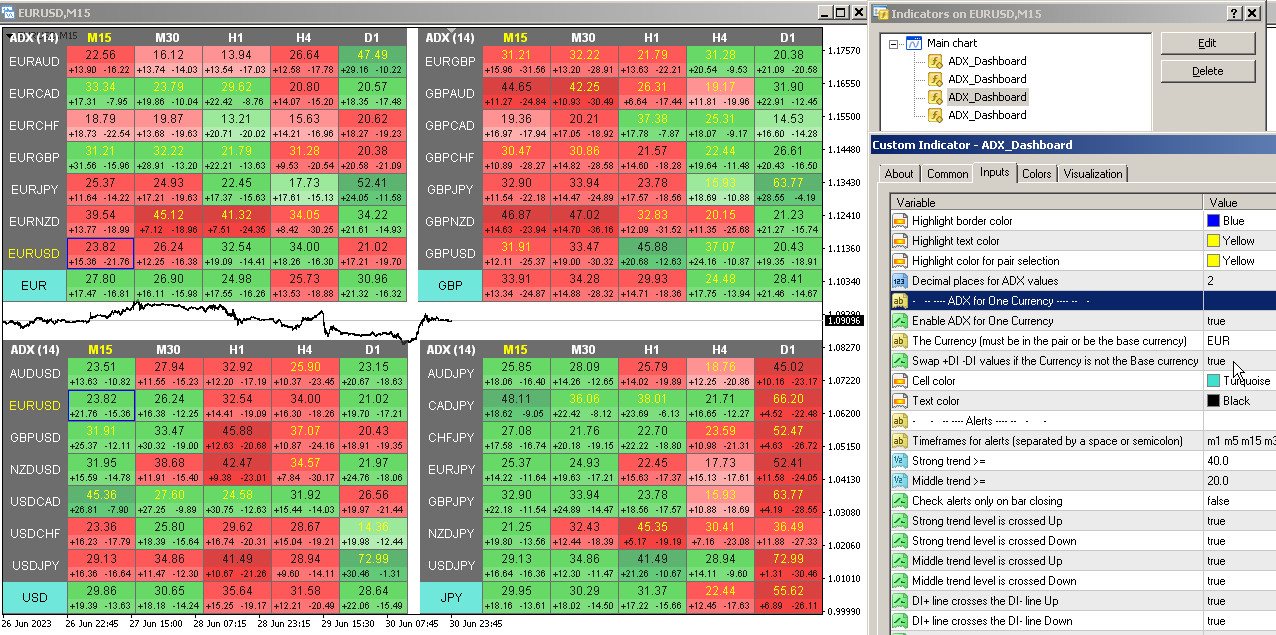
平均方向性指数 (ADX) インジケーターの複数通貨および複数時間枠の変更。パラメータで任意の通貨と時間枠を指定できます。また、インジケーターは、トレンドの強さのレベルが交差したとき、および +DI と -DI のラインが交差したときに通知を送信できます。ピリオドの付いたセルをクリックすると、このシンボルと期間が開きます。これが MTF スキャナーです。
通貨強度メーター (CSM) と同様に、ダッシュボードは、指定された通貨を含むペア、またはその通貨を基本通貨とするペアを自動的に選択できます。インジケーターは、「ペアのセット」で指定されたすべてのペアで通貨を検索します。他のペアは無視されます。これらのペアに基づいて、この通貨の合計 ADX が計算されます。そして、その通貨がどれだけ強いか弱いかを確認できます。
ダッシュボードをチャートから非表示にするキーは、デフォルトでは「D」です
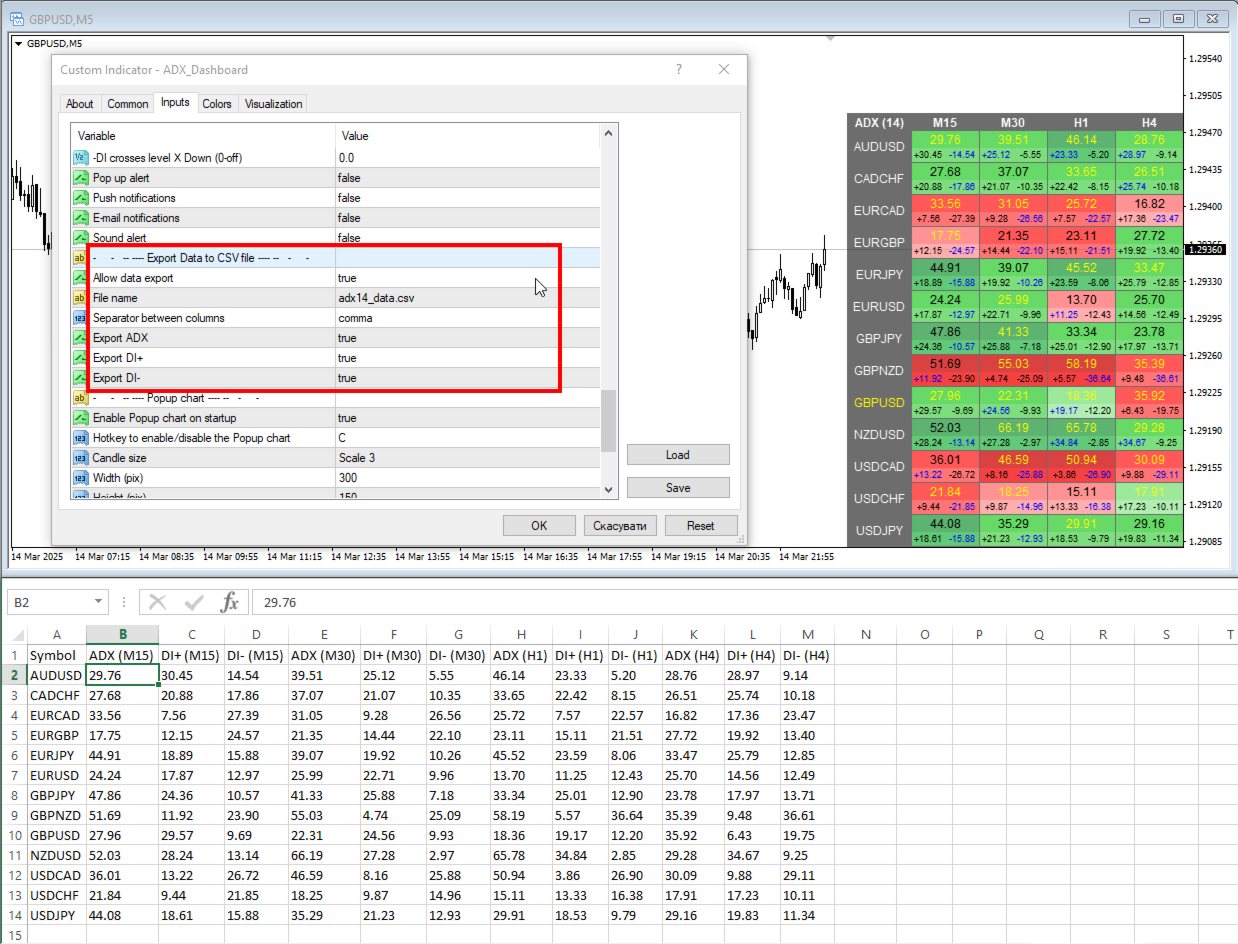
ADX ダッシュボードから CSV ファイルにデータをエクスポートできます。ファイルはターミナル フォルダ \MQL4\Files に保存されます。
データはタイマー「ダッシュボードを (秒ごとに) 更新」に従って記録されます。
保存したファイルを Excel で開いたときに更新するには、「データ タブ」-「テキストから外部データを取得」から開く必要があります。その後、ファイルはダッシュボードと Excel で更新されます。
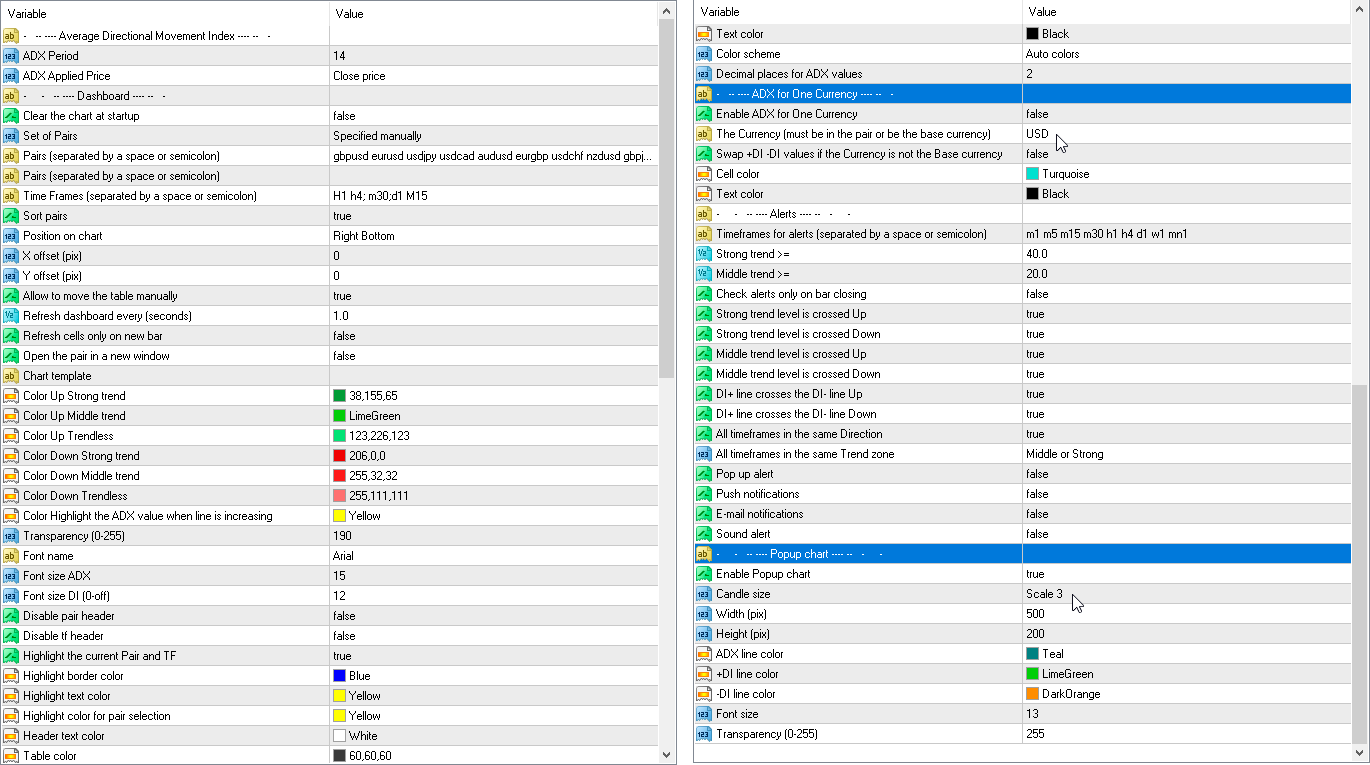
パラメーター
ADX Period — 平均期間。
ADX Applied Price — 価格タイプ。
Clear the chart at startup — 起動時にチャートをクリアします
Set of Pairs — シンボルのセット:
— Market Watch — MTの「マーケットウォッチ」からのペア。— Specified manually — パラメーター「ペア」で手動で指定されたペア。— Current pair — 現在のペアのみを表示します。
Pairs (separated by a space or semicolon) — スペースまたはセミコロンで区切られたシンボルのリスト。通貨名はブローカーのものとまったく同じように記述し、大文字と小文字、接頭辞/接尾辞はそのままにしてください。
Time Frames (separated by a space or semicolon) — スペースまたはセミコロンで区切られた時間枠のリスト (複数の時間枠)。
Sort pairs — ペアのリストを並べ替えます。
Position on chart — チャート上のパネルを表示するコーナー。
X offset (pix) — パネルを X 軸に沿って移動します。
Y offset (pix) — パネルを Y 軸に沿って移動します。
Allow to move the table manually — マウスでテーブルを移動できるようにします。
Refresh dashboard every (seconds) — すべてのペアと時間枠の更新期間。
Refresh cells only on new bar — セルの更新 (およびアラート) は、新しいバーが表示されたときにのみ行われます。
Open the pair in a new window — クリックして新しいチャート ウィンドウでシンボルを開きます。
Chart template — チャートが新しいウィンドウで開く場合のチャートのテンプレートの名前。
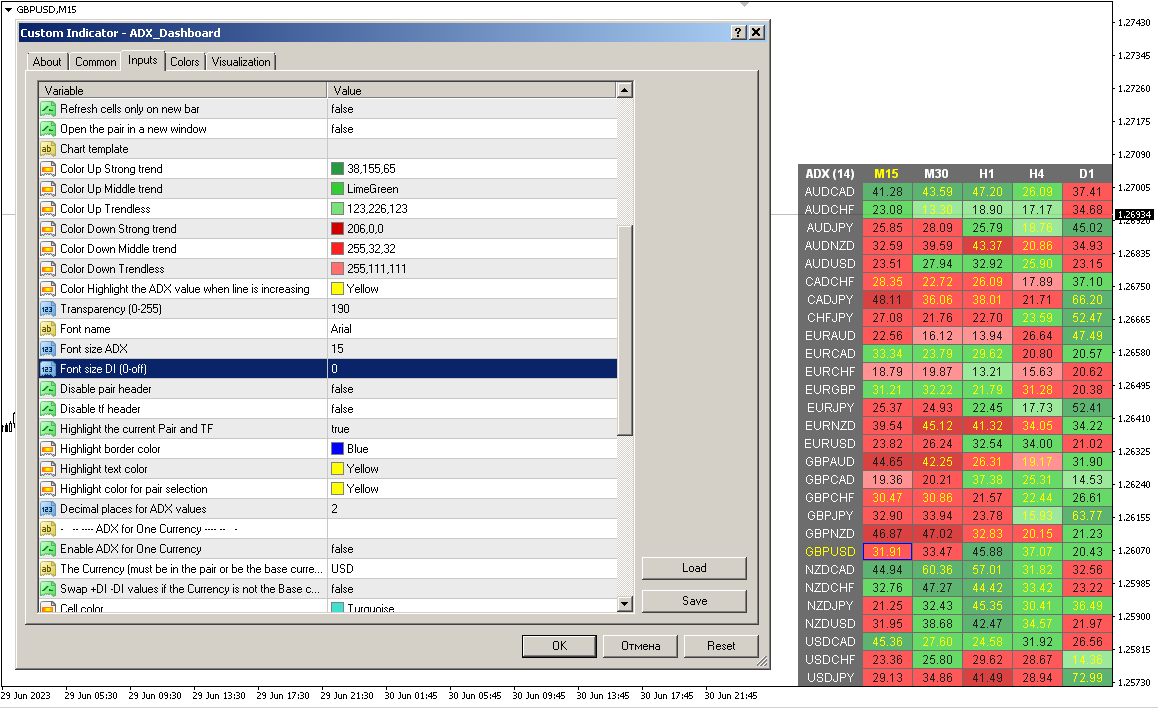
色の設定
Color Up Strong trend — 強いトレンドがある場合のセルの色。
Color Up Middle trend — 中間トレンドの場合のセルの色。
Color Up Trendless — トレンドがない場合のセルの色。
Color Down Strong trend — 強いトレンドがある場合のセルの色。
Color Down Middle trend — 平均トレンドの場合のセルの色。
Color Down Trendless — トレンドがない場合のセルの色。
Transparency (0-255) — パネルの透明度。
Font name — フォント名。
Font size ADX — フォント サイズ ADX。
Font size DI (0-off) — フォント サイズ DI (0 ~ オフ)。
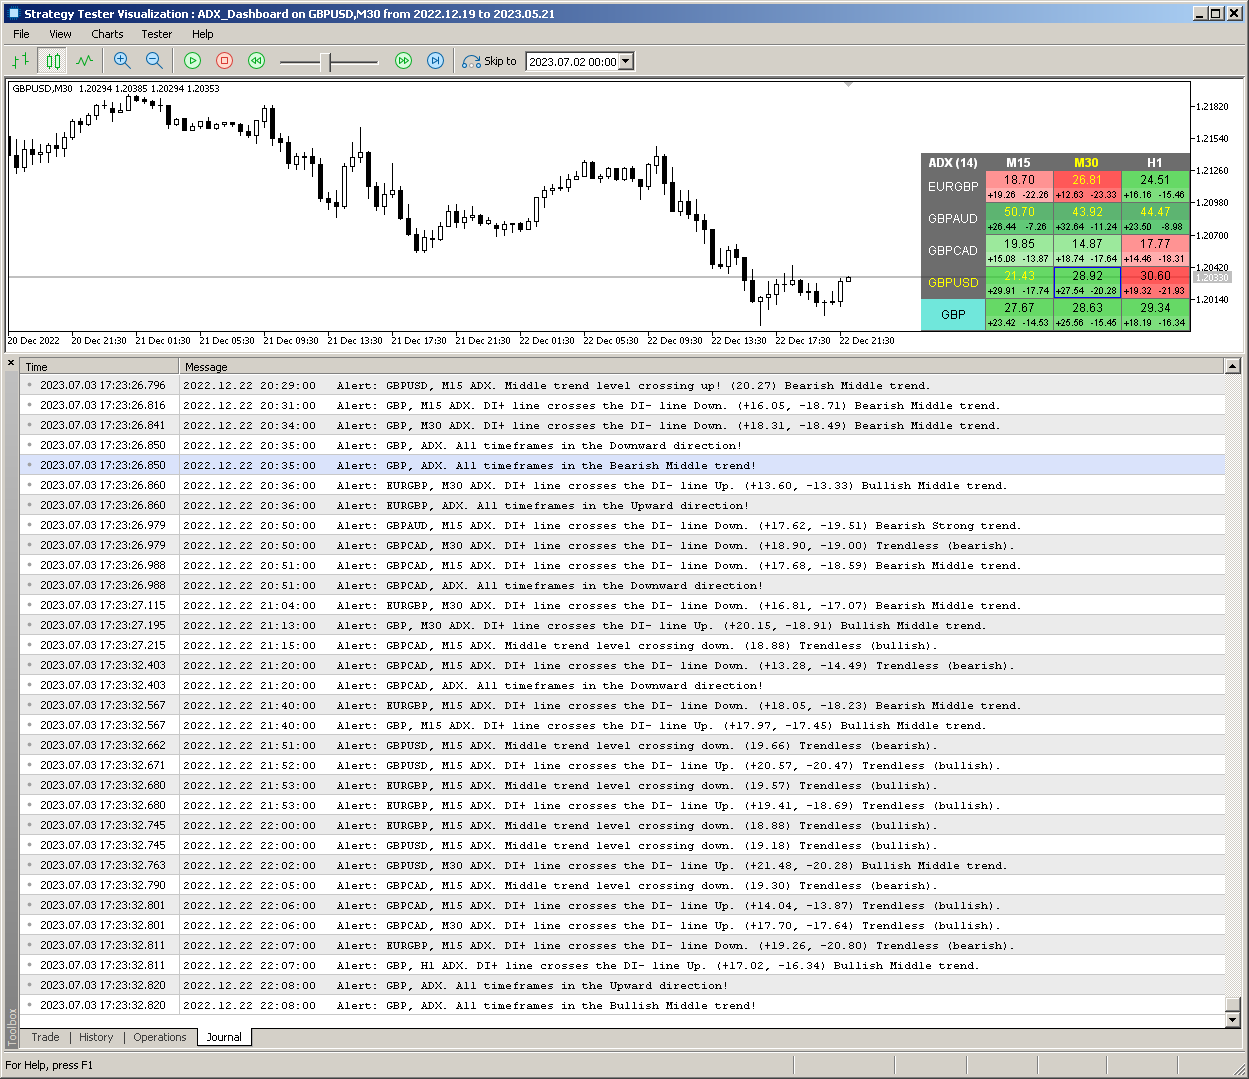
アラート
Timeframes for alerts (separated by a space or semicolon) — アラートが送信される期間のリスト (スペースまたはセミコロンで区切る)。
Strong trend >= — 強いトレンドのレベル
Middle trend >= — 中間トレンドのレベル。
Check alerts only on bar closing — バーのクローズ後にのみレベル クロスをチェック。
Strong trend level is crossed Up — ADX が強いトレンド レベルをクロスするとアラート。
Strong trend level is crossed Down — ADX が強いトレンド レベルをクロスするとアラート。
Middle trend level is crossed Up — 中間トレンドのレベルが上を横切るとアラートします。
Middle trend level is crossed Down — 中間トレンドのレベルが下を横切るとアラートします。
DI+ line crosses the DI- line Up — DI+ が DI- を上を横切るとアラートします。
DI+ line crosses the DI- line Down — DI+ が DI- を下を横切るとアラートします。
All timeframes in the same direction — すべてのセルが同じ方向を示しているとアラートします。
DI+ changes direction — DI+ が方向を変えます。
DI- changes direction — DI- が方向を変えます。
DI+ crosses level X (0-off) — DI+ がレベル X (0 オフ) を横切ります。
DI- crosses level X (0-off) — DI- がレベル X (0 オフ) を横切ります。
Pop up alert — ポップアップ アラート。
Push notifications — プッシュ通知。
E-mail notifications — 電子メール通知。
Sound alert — サウンド アラート。
Export Data to CSV fileAllow data export
File name
Separator between columns
Export ADX
Export DI+
Export DI-
ポップアップ チャート
Enable Popup chart — ポップアップ チャートを有効にする
Candle size — キャンドル サイズ
Width (pix) — 幅 (ピクセル)
Height (pix) — 高さ (ピクセル)
Font size — フォント サイズ
Transparency (0-255) — 透明度 (0 ~ 255)


Another excellent piece of work from this talented programmer!
A thousand thanks, Taras!