Rainbow Price Visualizer
- 指标
-
Vincent Jose Proenca
 我从事交易已有十多年,主要专注于差价合约(CFD)。我热爱交易的逻辑性、纪律性,以及创造能简化决策过程的工具。因为找不到符合自己方法的指标,我开始自己编写——最初是出于需要,后来变成了乐趣。
我的首批工具包括:Custom Box 和 Daily Bar Number。这些指标并不是理论原型,而是为日常使用而设计,并在真实市场环境中经过测试与优化。结果是:实用、易于整合的解决方案,帮助更快地做出决策,而不会被信息淹没。
我分享这些工具的原因:
我并非被竞争或逐利所驱动,我只是喜欢创造有用的工具。
将这些指标出售,对我来说是帮助其他交易者获得清晰度和效率的一种自然方式。 - 版本: 1.21
- 更新: 12 十月 2025
- 激活: 5
Rainbow Price Visualizer v1.21
See where the market really breathes.
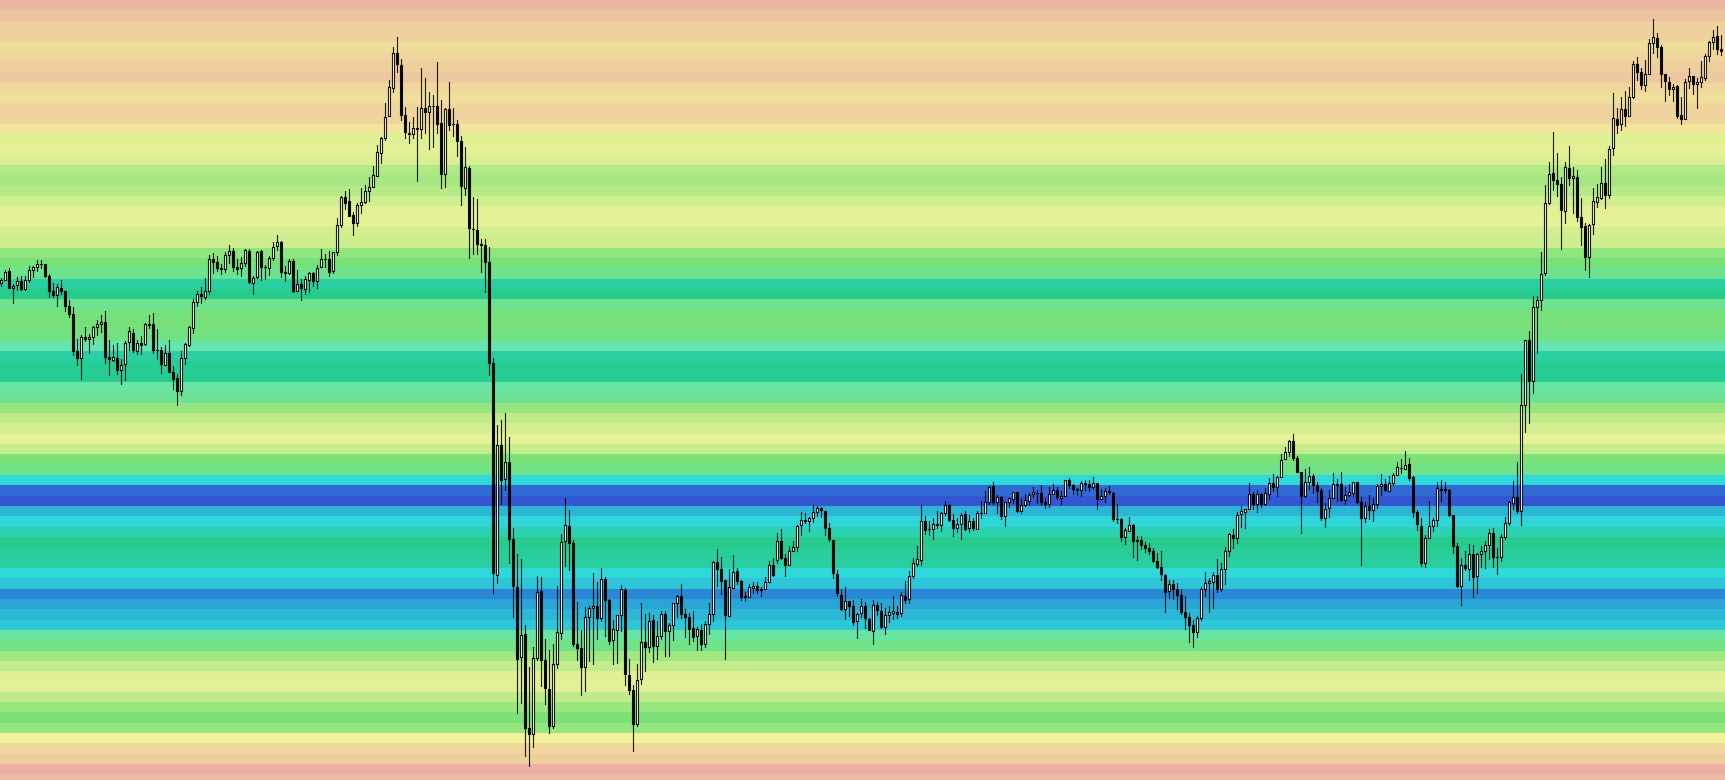
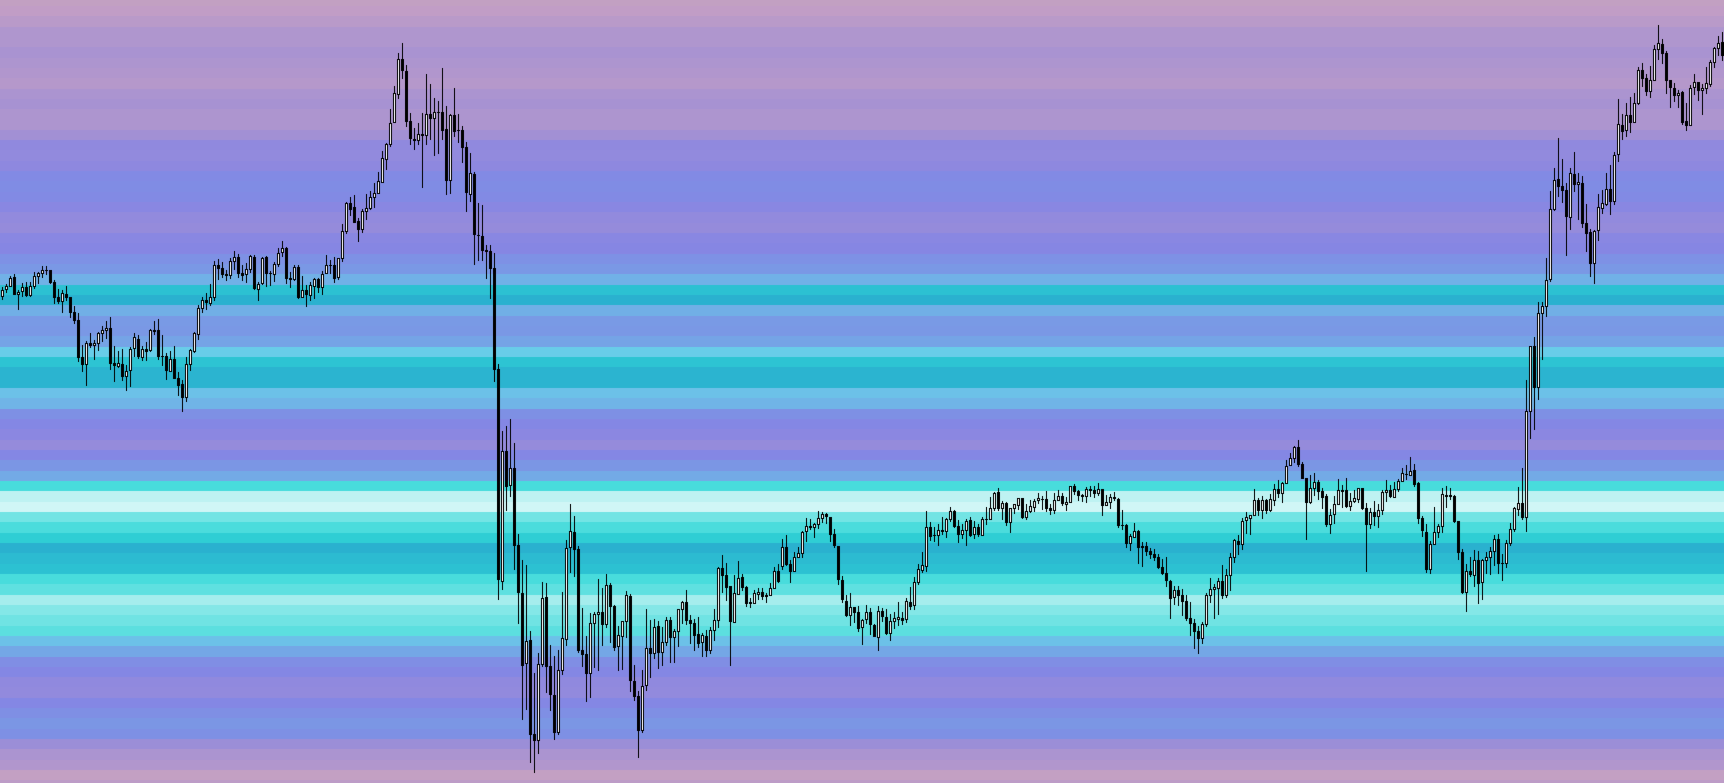
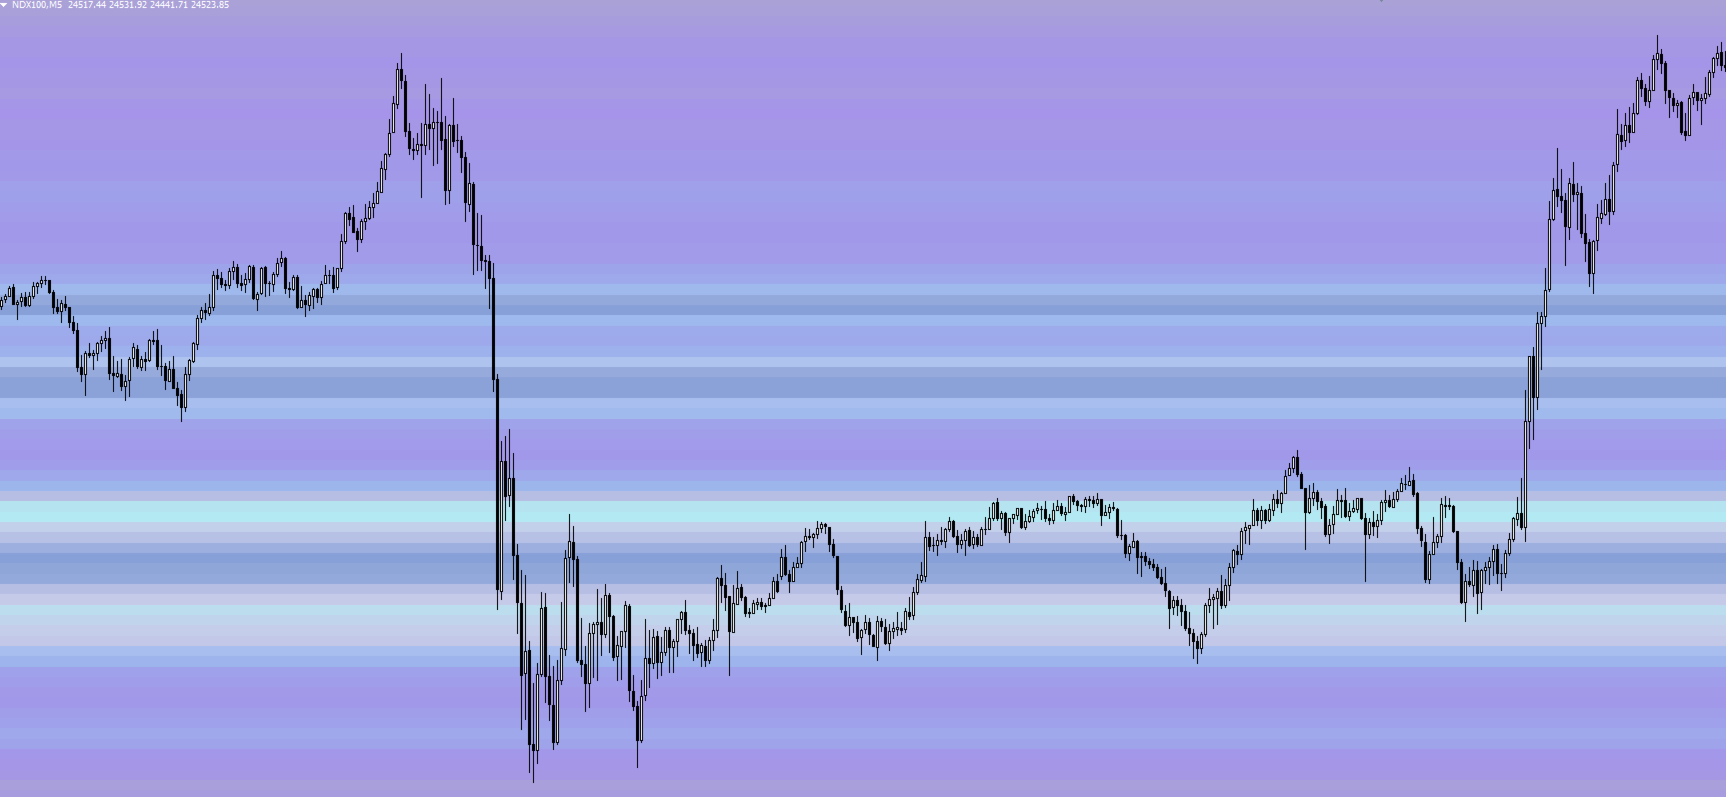
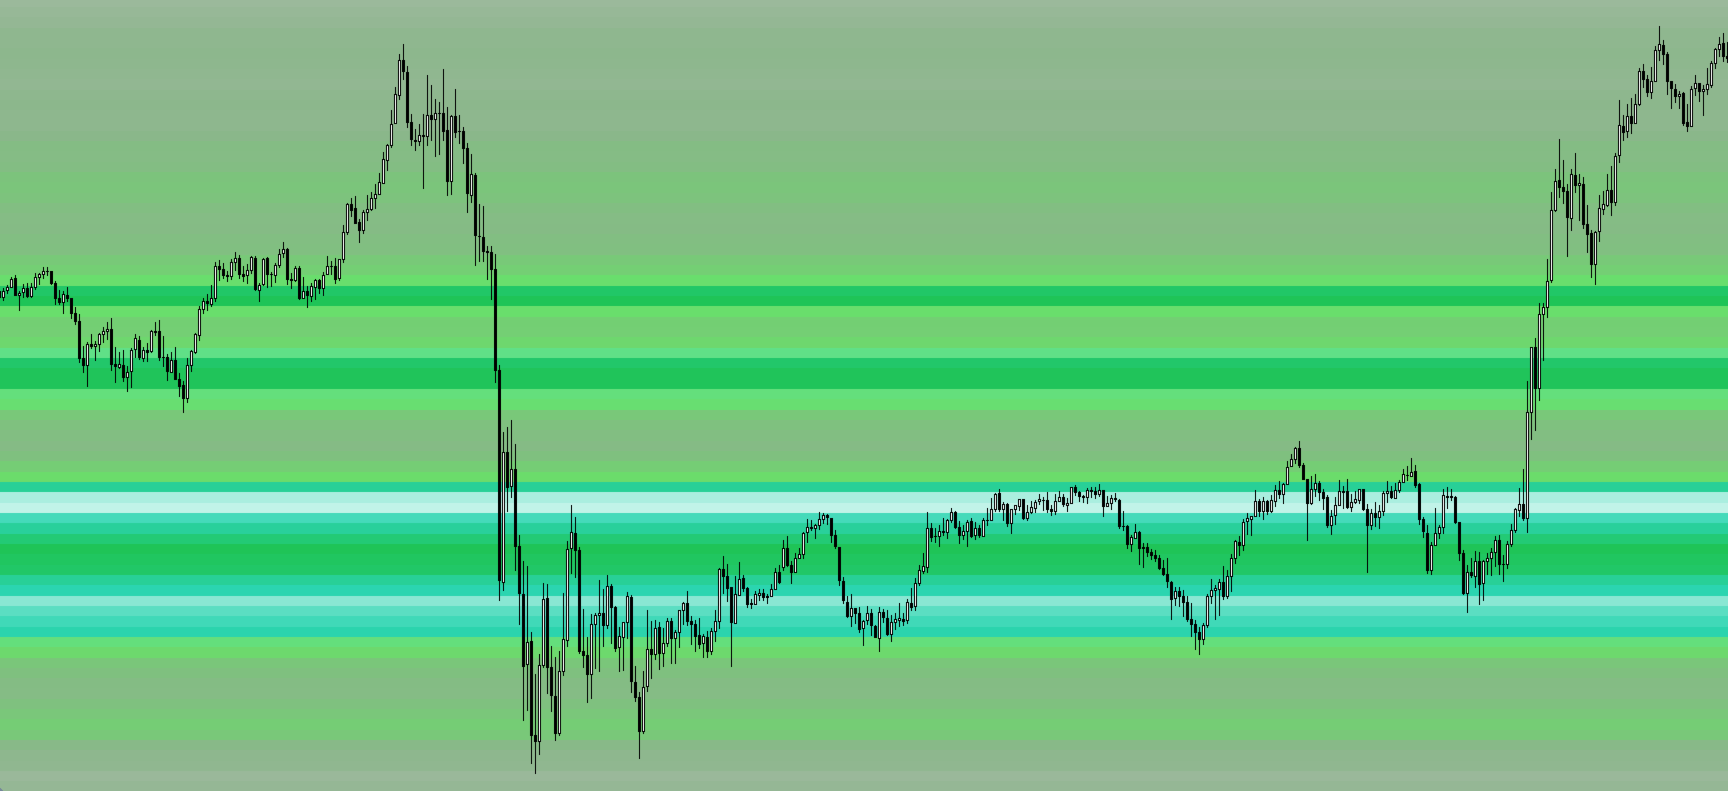
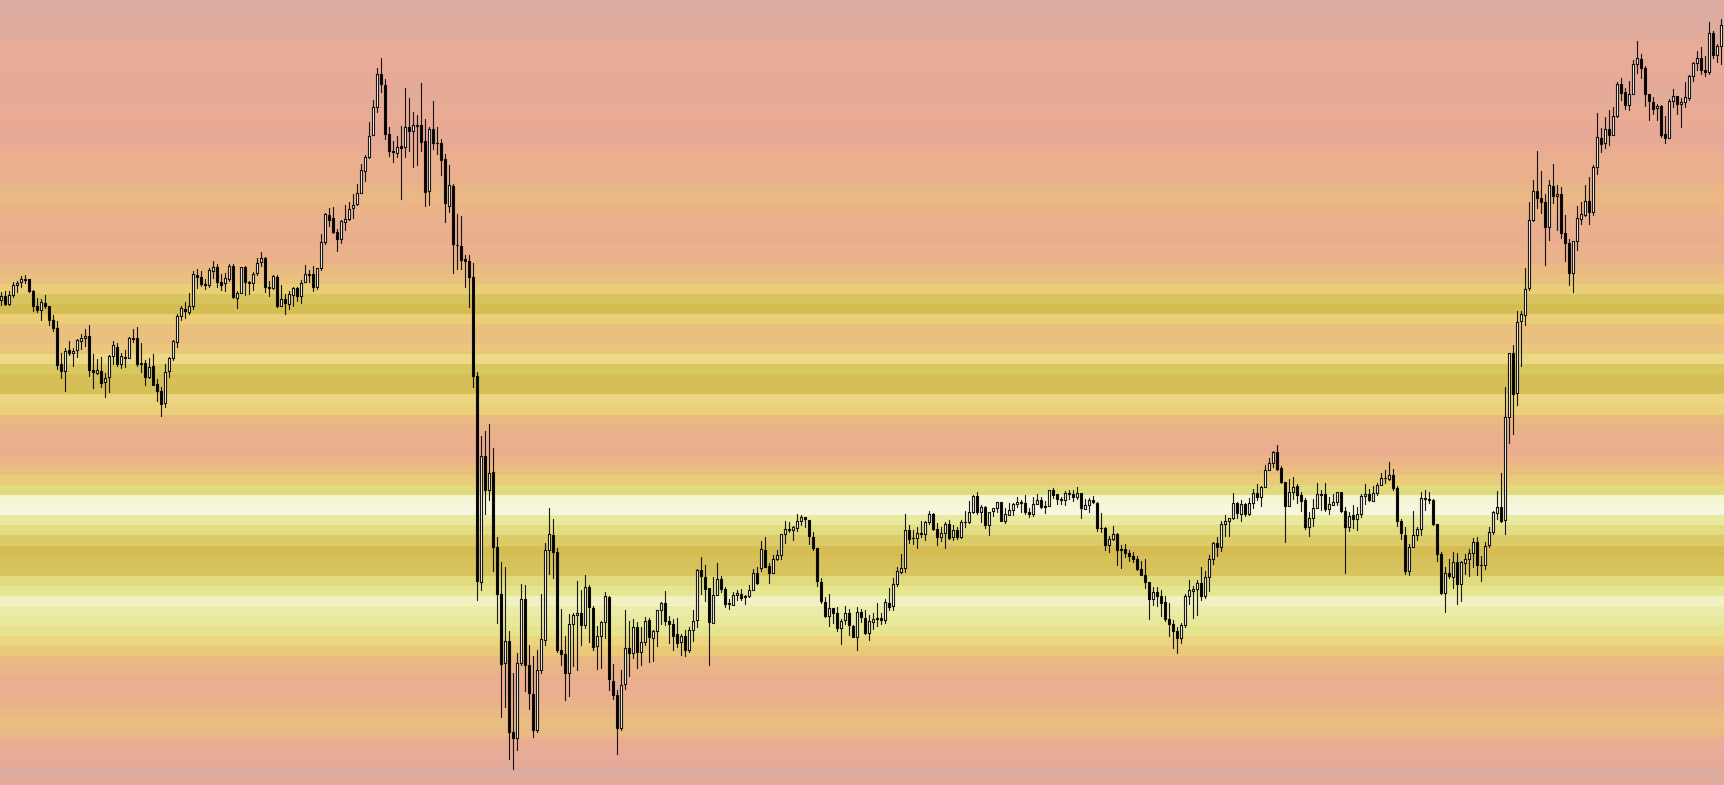
Turns your MT4 chart into an ultra-precise heatmap that highlights price zones favored by big players.
Why it matters
-
300 price levels at 0.2‑pip resolution — microscopic detail.
-
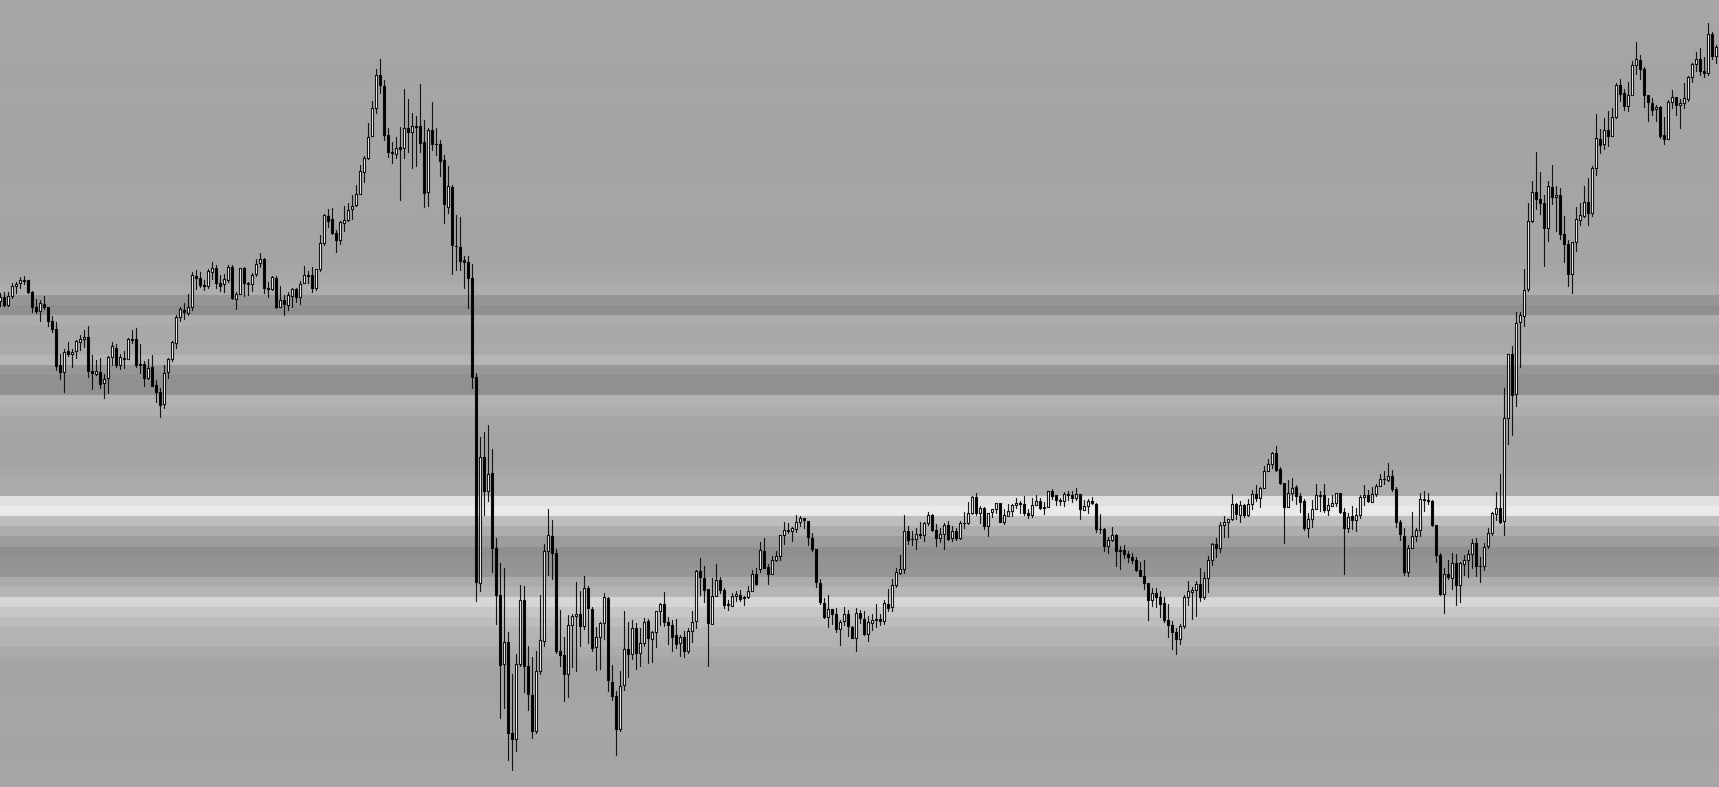
8 visual themes (Rainbow, Fire, Ocean…) for instant readibility.
-
Smart opacity: low noise fades, real zones pop.
-
Lightweight rendering with automatic cleanup.
-
Fully customizable: saturation, opacity, resolution, history depth.
-
Bands project into the future to spot looming S/R.
Use it to
-
Pinpoint professional support/resistance.
-
Track institutional footprints and volume-by-price patterns.
-
Locate high-probability reversal zones.
Short, sharp, slightly uncanny.