KT Renko Patterns MT4
- 指标
- 版本: 2.3
- 更新: 15 二月 2021
- 激活: 5

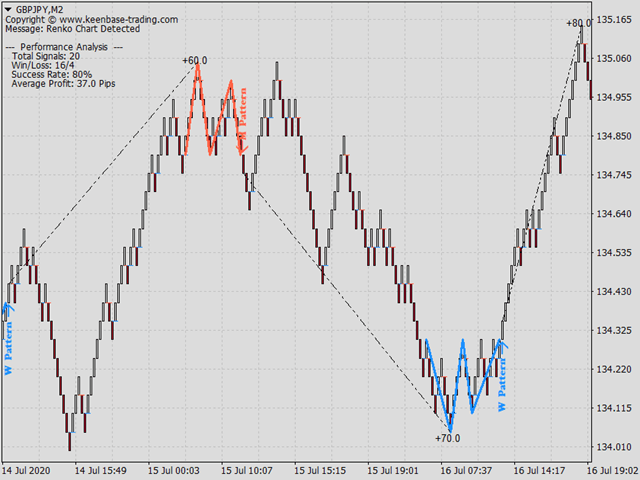
KT Renko Patterns 会逐砖扫描整个 Renko 图表,寻找那些在各种金融市场中被交易者频繁使用的著名图表形态。
与基于时间的图表相比,Renko 图由于其简洁清晰的特性,更容易识别图表形态,尤其适合基于形态的交易策略。
KT Renko Patterns 包含多种常见的 Renko 图形模式,其中许多都在 Prashant Shah 所著的《用 Renko 图表实现盈利交易》一书中有详细说明。
基于 KT Renko Patterns 指标开发的 100% 自动交易EA已发布,点击这里了解 - KT Renko Patterns EA。
特点
- 可交易多达八种清晰明确的 Renko 图形模式,无任何模糊。
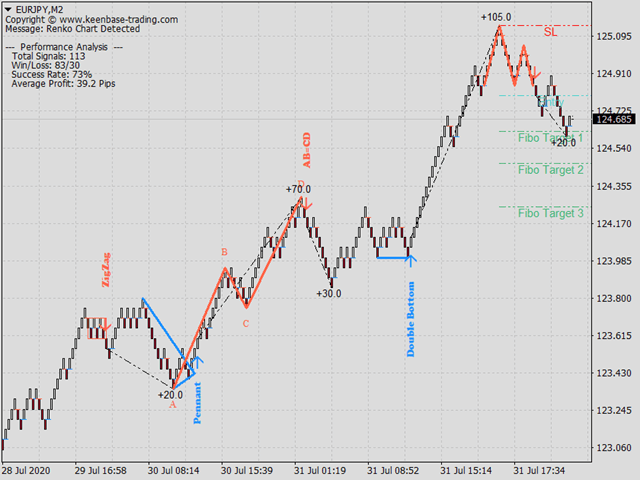
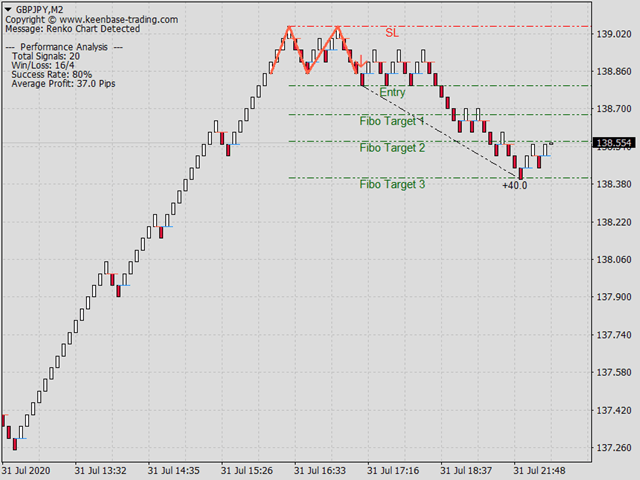
- 每种模式都配有止损位和斐波那契目标位,确保交易策略客观明确。
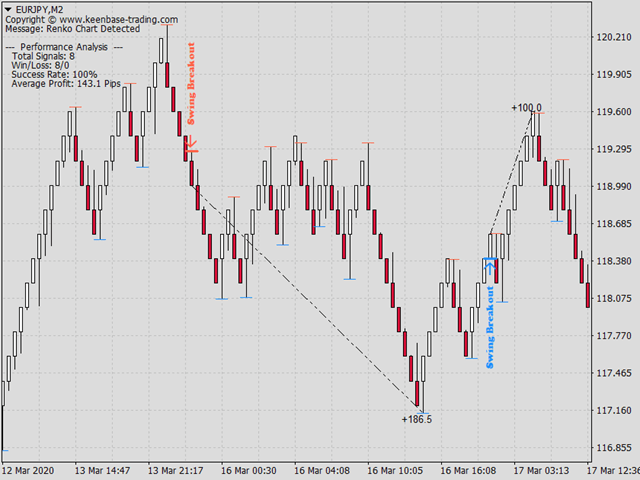
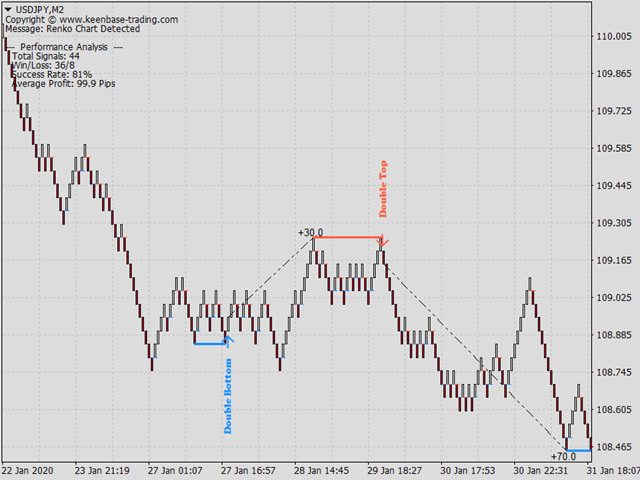
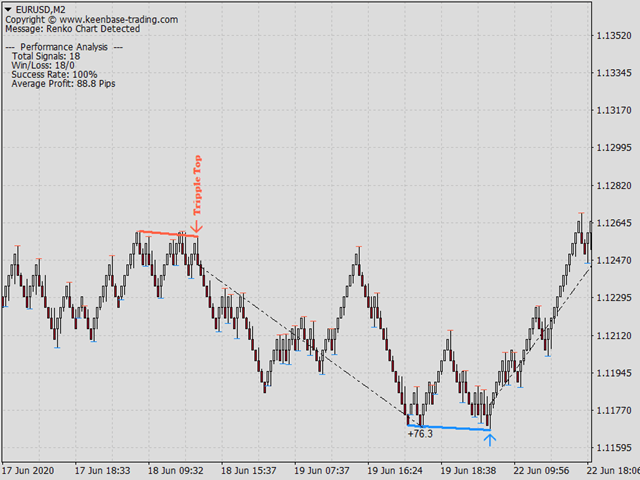
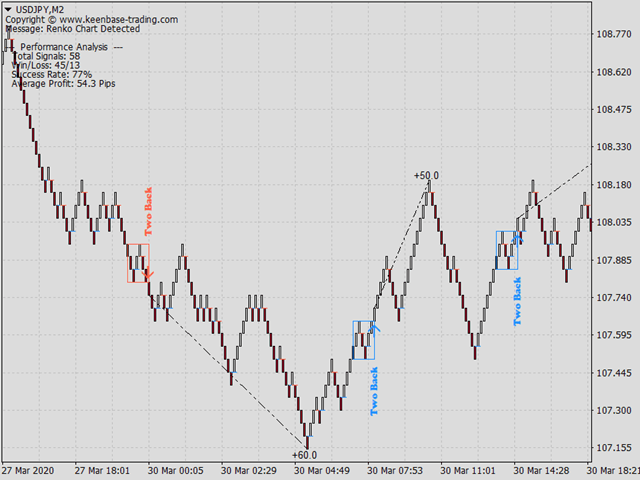
- KT Renko Patterns 实时监测每种模式的准确率,并将关键统计信息显示在图表上。
- 当 Renko 砖块发生反转时会自动标记并提醒,有助于在行情突变时提前计划退出。
- 已识别的图形不会重绘或重新绘制,信号稳定可靠。
包含的图形模式
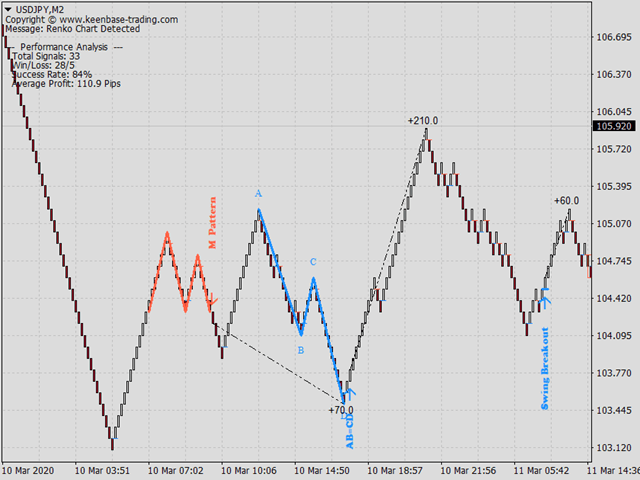
- W-M 形态
- 强势旗形
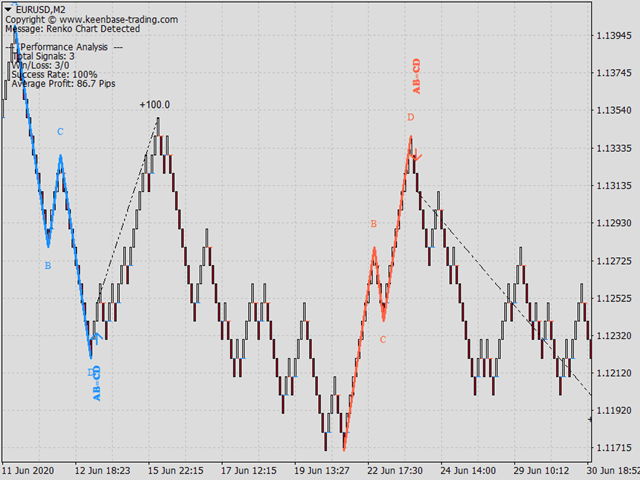
- AB=CD 形态
- 三顶/三底
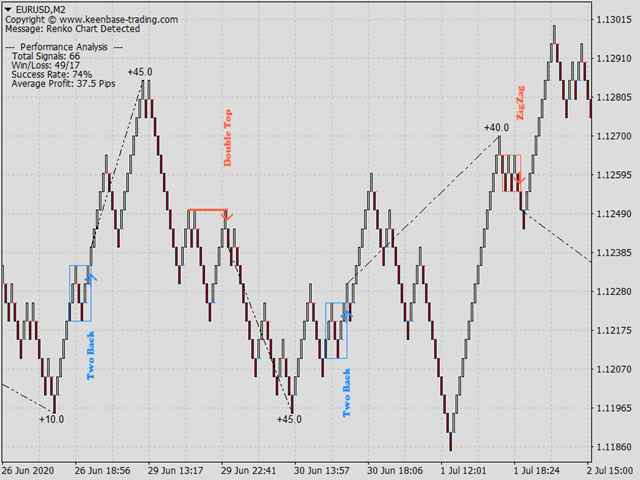
- 双顶/双底
- Two Back Strike
- ZigZag 砖形
- 摆动突破
优化信号准确率
KT Renko Patterns 显示多个图形形态,但并非所有形态都适用于每一个交易品种。可通过以下简单步骤来提高信号的准确率:
- 确保每种图形设置为 True。
- 选择一个“成功率标准”(推荐选择第二个 TP)。
- 逐一关闭图形,然后观察成功率的变化。
- 如果关闭某个图形后成功率提高,则保持关闭状态。
- 如果关闭后成功率下降,则重新启用该图形。
- 将“图形之间的最小砖数”设置在 20 到 100 之间。
提高图形之间的砖块间距通常可以提高成功率,但过高的值会显著减少信号数量,因此建议设置在 20 到 100 之间的平衡值。
输入参数
- 图形之间的最小砖数: 每种图形之间的最小砖数,可提高信号准确性。
- 标记砖块反转: 在图表上标记 Renko 砖块反转。
- 砖块反转提醒: 若启用,则每次砖块反转时都会提醒。
- 绘制图形名称: 在图表上显示信号的图形名称。
- 性能分析: 指标会自动评估自身性能并显示关键统计信息。
- 成功率标准: 用于评估信号成功率的基准。
常见问题
Q. 这个指标可以在标准时间图上使用吗?
A. KT Renko Patterns 是专为 Renko 图开发的,虽然也可以在标准时间图上运行,但并不推荐,这会违背其设计初衷。
Q. 可以优化信号的准确率吗?
A. 可以,优化方法已在上文详细说明。
Q. 我有一个适合 Renko 图的新形态建议,可以添加吗?
A. 欢迎联系我们,如果研究团队认为有价值,我们将在下一版本中添加。
Q. 可以将该指标用于EA中吗?
A. 当然可以,请联系我们以获取开发者导入代码。


Absolutely the best Indicator for renko that I have ever used to give me a good entry position that I can trust based upon simple setups without the noise. My only regret is that I did not just buy it at at first and save $100. This is a no brainer it does all the analytical work for you. All you have to do is pull the trigger.