ADX Dashboard
- Göstergeler
- Sürüm: 4.10
- Güncellendi: 12 Nisan 2026
- Etkinleştirmeler: 10

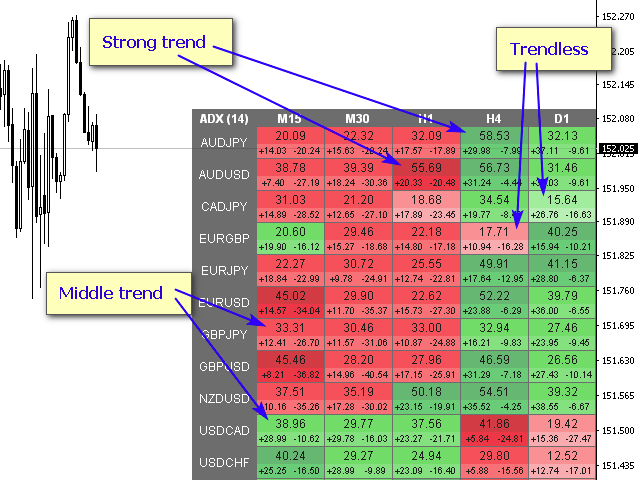
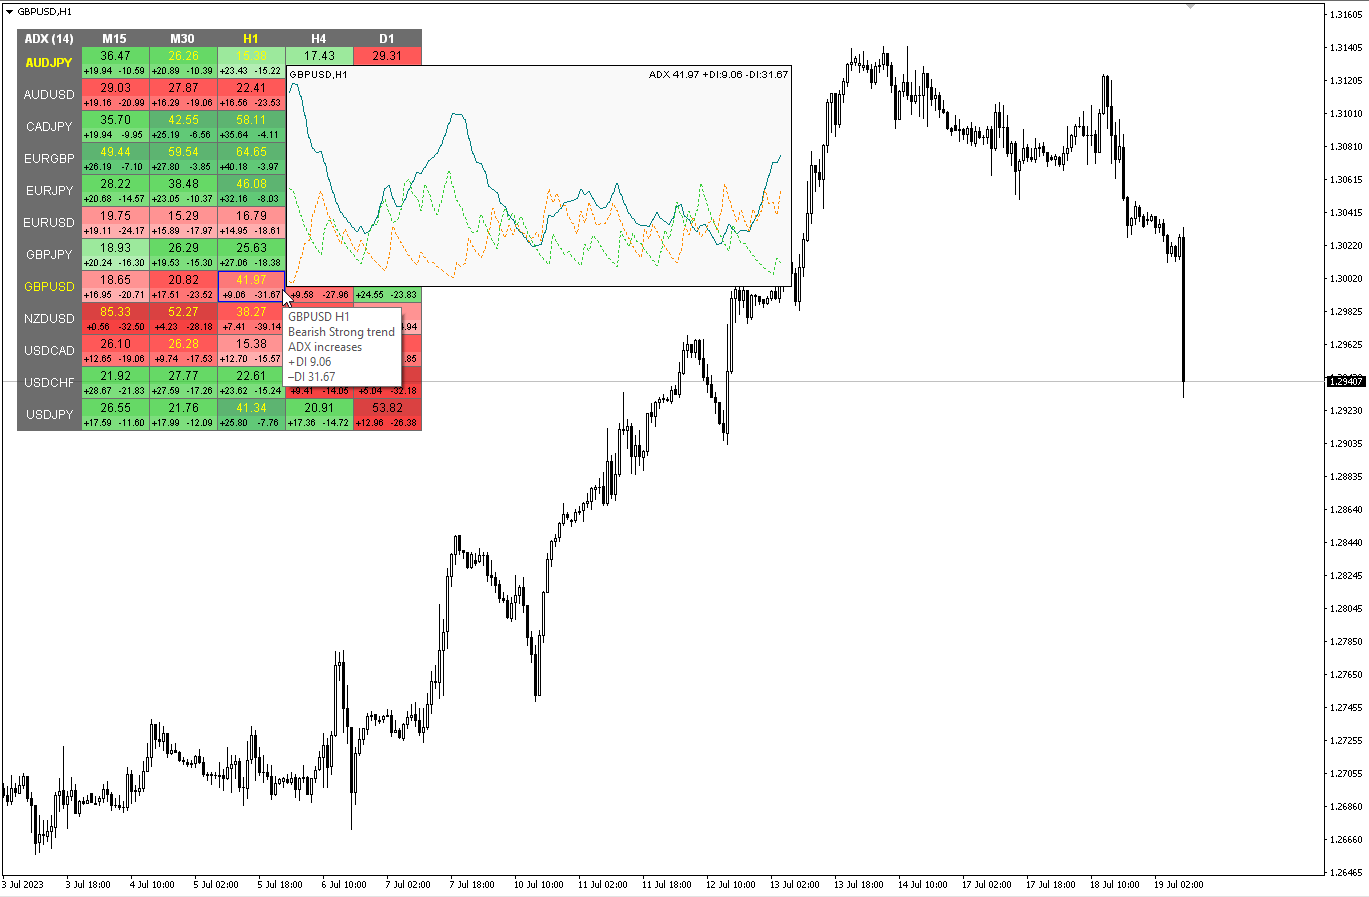
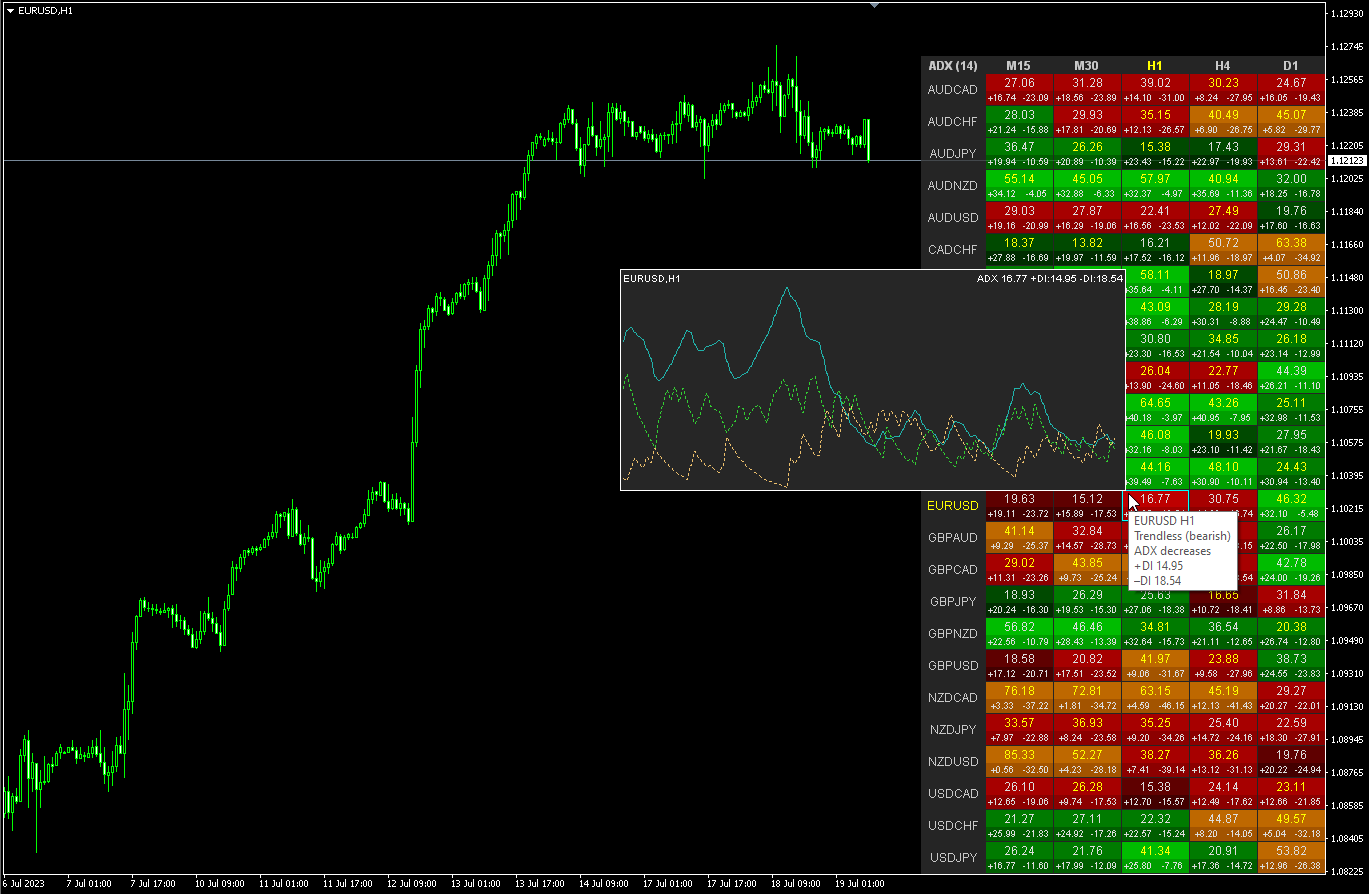
ADX göstergesi trendi ve gücünü belirlemek için kullanılır. Fiyatın yönü +DI ve -DI değerleriyle, ADX değeri ise trendin gücünü gösterir. +DI -DI'nin üzerindeyse piyasa yükseliş trendindedir, tam tersi ise düşüş trendindedir. ADX 20'nin altında ise kesin bir yön yoktur. Gösterge bu seviyeyi kırdığı anda orta güçte bir trend başlıyor. 40'ın üzerindeki değerler güçlü bir trendi (düşüş trendi veya yükseliş trendi) gösterir.
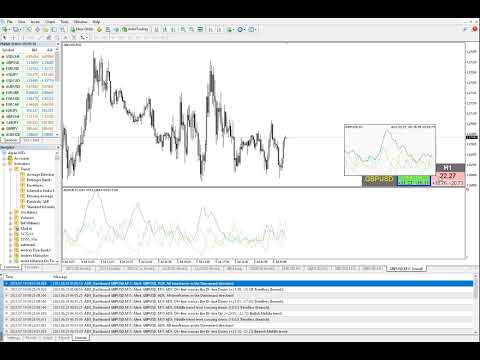
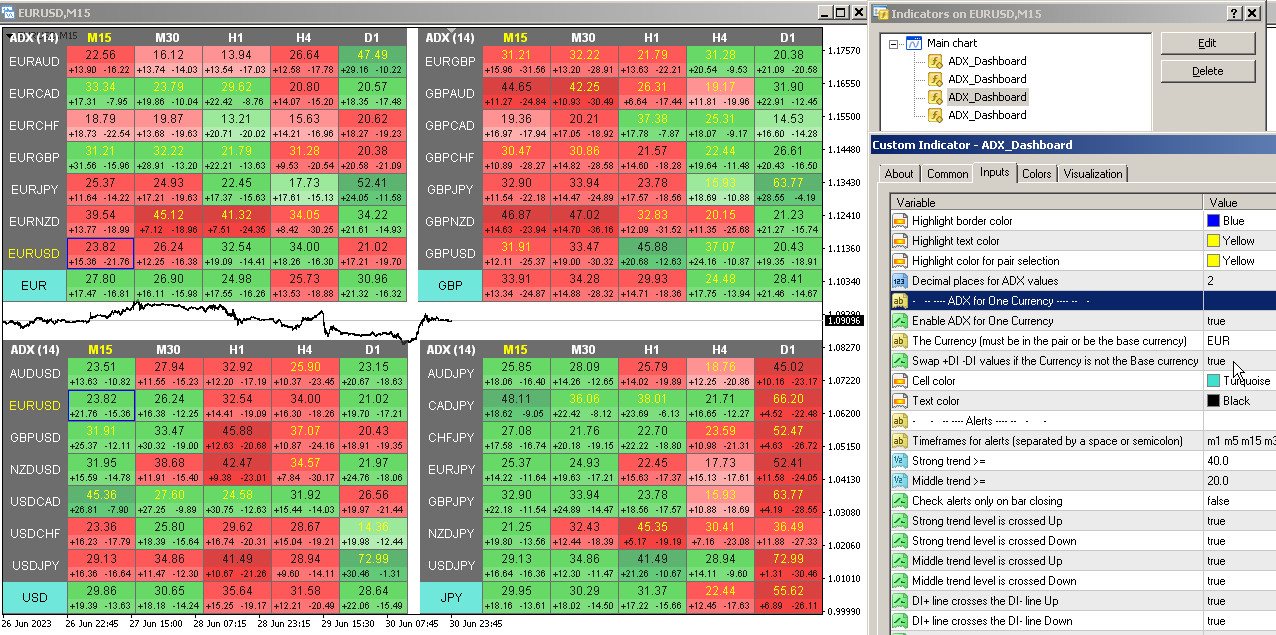
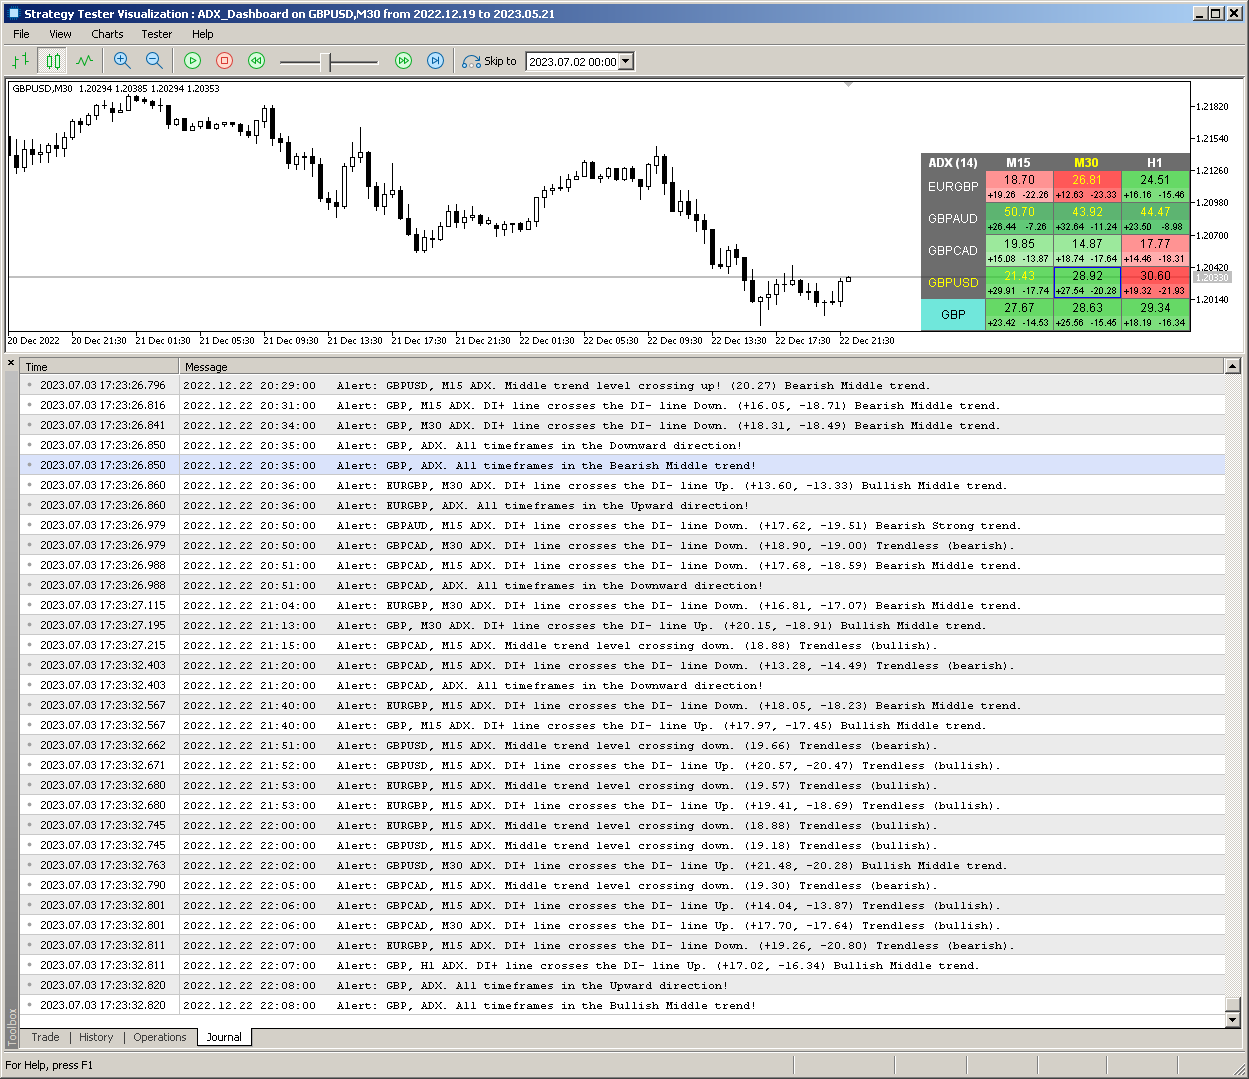
Ortalama Yönlü Hareket Endeksi (ADX) göstergesinin çoklu para birimi ve çoklu zaman çerçeveli modifikasyonu. Parametrelerde istediğiniz para birimini ve zaman dilimlerini belirtebilirsiniz. Ayrıca gösterge, trend gücü seviyeleri aşıldığında ve +DI ve -DI çizgileri geçildiğinde bildirim gönderebilir. Noktalı bir hücreye tıkladığınızda bu sembol ve nokta açılacaktır. Bu MTF Tarayıcıdır.
Para Birimi Gücü Ölçer'e benzer şekilde, Kontrol Paneli belirli bir para birimini içeren çiftleri veya bu para birimini temel para birimi olarak kullanan çiftleri otomatik olarak seçebilir. Gösterge, “Çiftler Kümesi”nde belirtilen tüm çiftlerde Para Birimini arar; diğer çiftler göz ardı edilir. Ve bu çiftlere dayanarak bu para biriminin toplam ADX'i hesaplanır. Ve o para biriminin ne kadar güçlü ya da zayıf olduğunu görebilirsiniz.
Kontrol panelini grafikten gizlemenin anahtarı varsayılan olarak "D"dir
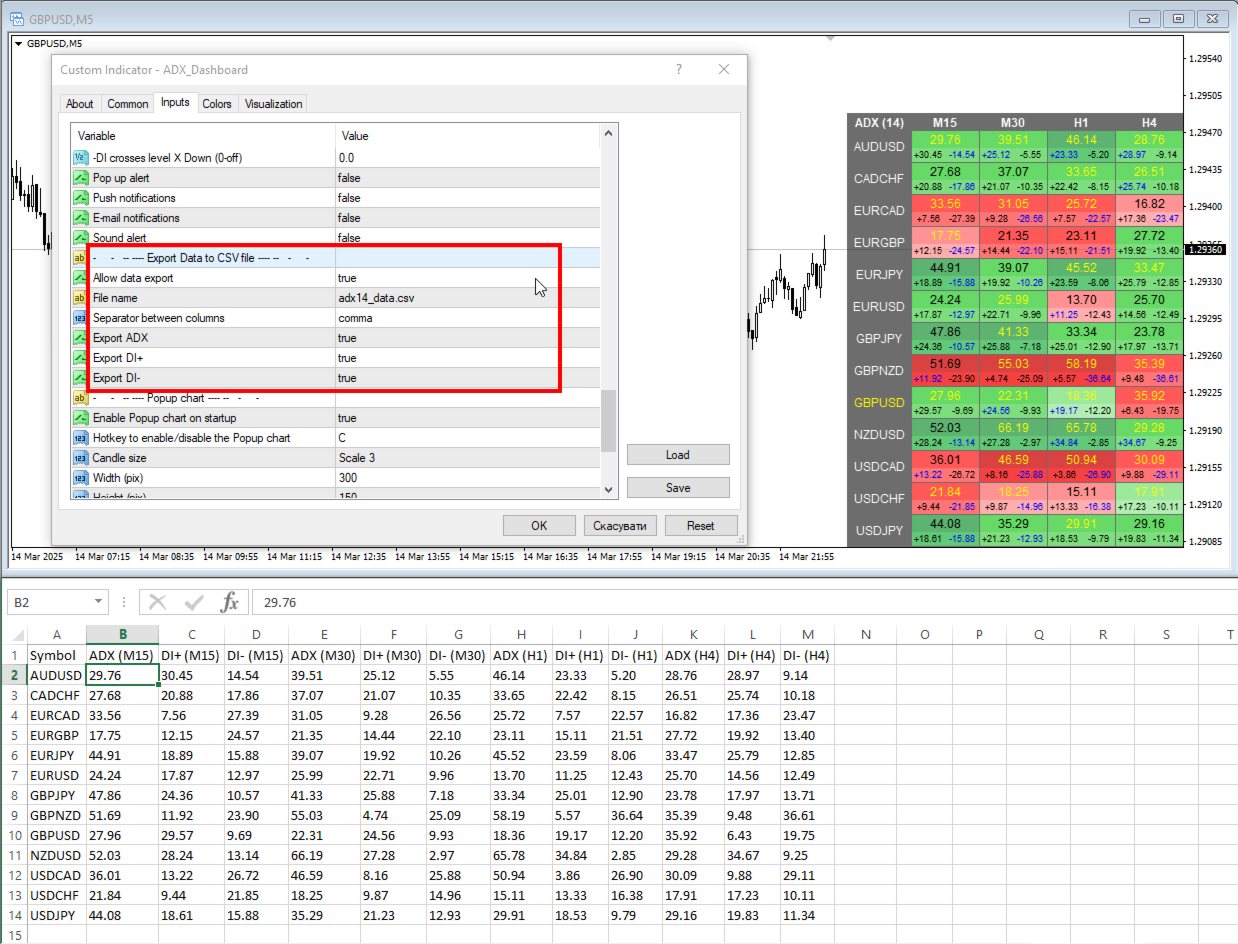
ADX Dashboard'dan CSV dosyasına veri aktarabilirsiniz. Dosya terminal klasörüne kaydedilecektir: \MQL4\Files.
Veriler zamanlayıcıya göre kaydedilecektir - "Panoyu her (saniyede) yenile".
Kaydedilen dosyayı Excel'de açıldığında güncellemek için, "Veri sekmesi" - "Metinden Harici Veri Al" üzerinden açmanız gerekir. Ardından dosya pano tarafından ve Excel'de güncellenecektir.
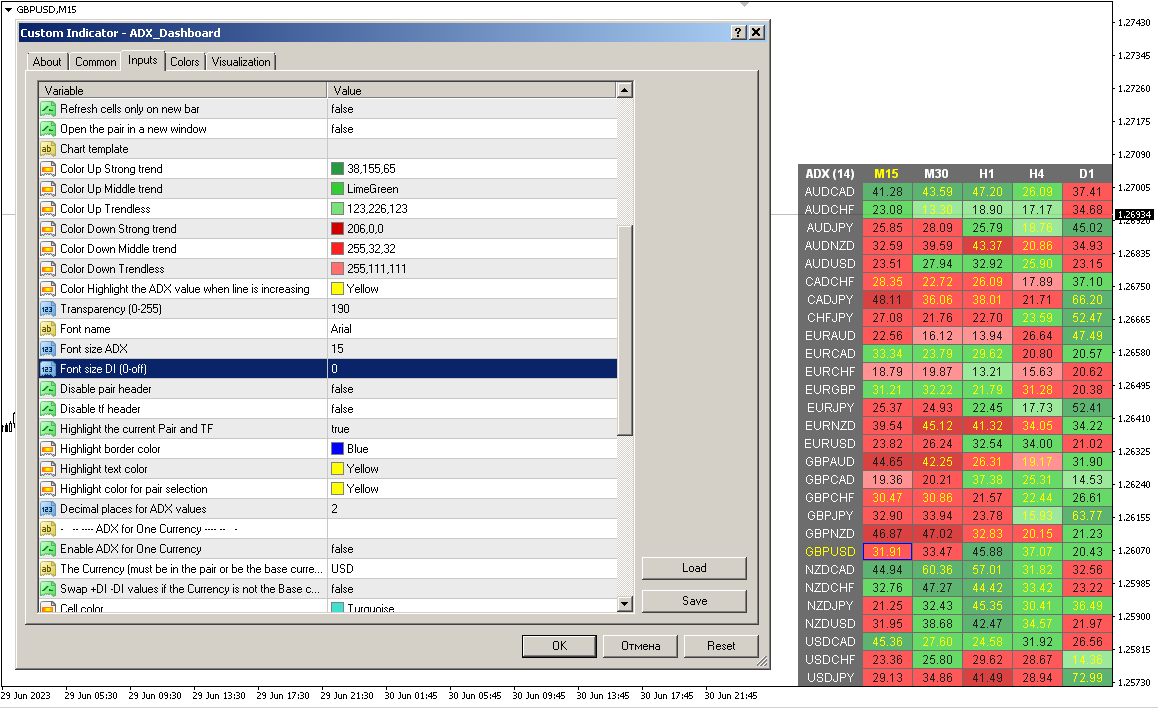
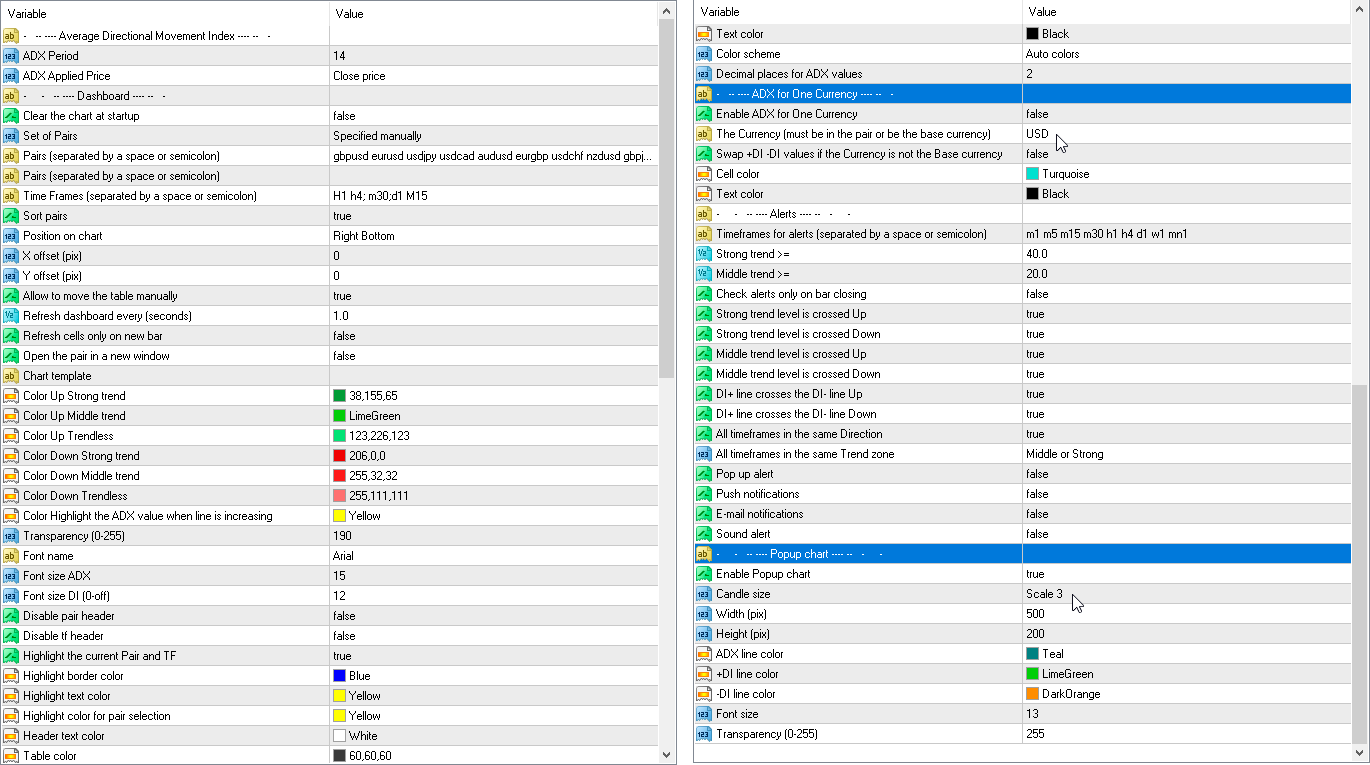
Parametreler
ADX Period — ortalama dönem.
ADX Applied Price — fiyat türü.
Clear the chart at startup - başlangıçta grafiği temizleyin
Set of Pairs — semboller kümesi:
— Market Watch — MT'nin "Piyasa Gözlemi"nden çiftler.— Specified manually — "Çiftler" parametrelerinde manüel olarak belirtilen çiftler.— Current pair — yalnızca geçerli çifti gösterir.
Pairs (separated by a space or semicolon) - boşluk veya noktalı virgülle ayrılmış sembollerin listesi. Para birimi adları, büyük/küçük harf ve önek/sonek korunarak tam olarak komisyoncununki gibi yazılmalıdır.
Time Frames (separated by a space or semicolon) — boşluk veya noktalı virgülle ayrılmış zaman dilimlerinin listesi (çoklu zaman dilimi).
Sort pairs — çiftlerin listesini sıralama.
Position on chart — panelin grafikte görüntüleneceği köşe.
X offset (pix) — paneli X ekseni boyunca kaydırın.
Y offset (pix) — paneli Y ekseni boyunca kaydırın.
Allow to move the table manually — masanın fareyle taşınmasına izin verin.
Refresh dashboard every (seconds) — tüm çiftler ve zaman dilimleri için güncelleme süresi.
Refresh cells only on new bar — hücre güncellemeleri (ve uyarılar) yalnızca yeni bir çubuk göründüğünde gerçekleşir.
Open the pair in a new window — tıklayarak yeni bir grafik penceresinde bir sembol açın.
Chart template — grafik yeni bir pencerede açılırsa, grafiğin şablonunun adı.
Renk ayarları
Color Up Strong trend — güçlü bir trend varsa hücre rengi.
Color Up Middle trend — orta trend ise hücre rengi.
Color Up Trendless — trend yoksa hücre rengi.
Color Down Strong trend — güçlü bir trend varsa hücre rengi.
Color Down Middle trend — ortalama trend ise hücre rengi.
Color Down Trendless — trend yoksa hücre rengi.
Transparency (0-255) — panelin şeffaflığı.
Font name - Yazı tipi adı.
Font size ADX - Yazı tipi boyutu ADX.
Font size DI (0-off) - Yazı tipi boyutu DI (0-kapalı).
Uyarılar
Timeframes for alerts (separated by a space or semicolon) - Uyarılar için zaman dilimleri (boşluk veya noktalı virgülle ayrılmış olarak) — uyarının gönderileceği dönemlerin listesi (boşluk veya noktalı virgülle ayrılmış olarak).
Strong trend >= — güçlü bir trendin seviyesi
Middle trend >= — orta trendin seviyesi.
Check alerts only on bar closing — hemzemin geçidi yalnızca çubuk kapandıktan sonra kontrol edin.
Strong trend level is crossed Up - ADX güçlü bir yukarı trend seviyesini geçtiğinde uyarı verir.
Strong trend level is crossed Down — ADX güçlü bir trendin seviyesini aşağı doğru geçtiğinde uyarı verir.
Middle trend level is crossed Up - orta trendin seviyesi yukarı doğru kesildiğinde uyarı verir.
Middle trend level is crossed Down - orta trend seviyesi aşağı doğru kesildiğinde alarm verir.
DI+ line crosses the DI- line Up - DI+ DI-yukarıyı geçtiğinde uyarı verir.
DI+ line crosses the DI- line Down — DI+ DI-aşağıyı geçtiğinde uyarı verir.
All timeframes in the same direction — tüm hücreler aynı yönü gösterdiğinde uyarı verir.
DI+ changes direction - DI+ yön değiştirir.
DI- changes direction - DI- yön değiştirir.
DI+ crosses level X (0-off) - DI+ X seviyesini geçer (0-kapalı).
DI- crosses level X (0-off) - DI- X seviyesini geçer (0-kapalı).
Pop up alert - Açılan uyarı.
Push notifications - Push bildirimleri.
E-mail notifications - E-posta Bildirimleri.
Sound alert - Ses Alarmi.
Export Data to CSV fileAllow data export
File name
Separator between columns
Export ADX
Export DI+
Export DI-
Açılan grafik
Enable Popup chart - Açılır grafiği etkinleştir
Candle size - Mum boyutu
Width (pix) - Genişlik (piks)
Height (pix) - Yükseklik (piksel)
Font size - Yazı Boyutu
Transparency (0-255) - Şeffaflık (0-255)


Another excellent piece of work from this talented programmer!
A thousand thanks, Taras!