ADX Dashboard
- Indicateurs
- Version: 4.10
- Mise à jour: 12 avril 2026
- Activations: 10

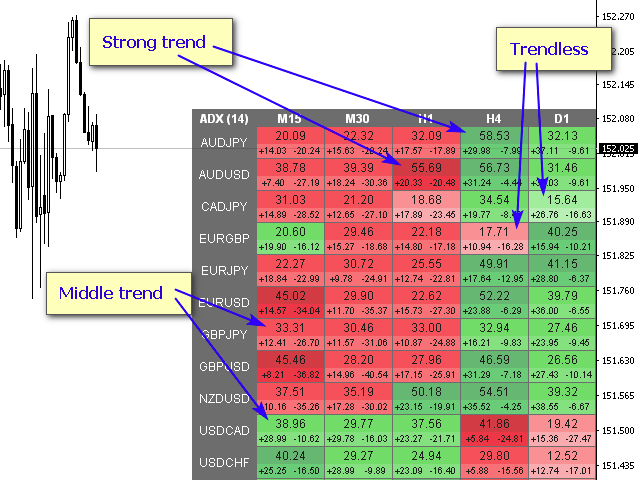
L'indicateur ADX est utilisé pour déterminer la tendance et sa force. La direction du prix est indiquée par les valeurs +DI et -DI, et la valeur ADX montre la force de la tendance. Si +DI est supérieur à -DI, alors le marché est dans une tendance haussière, si au contraire, c'est une tendance baissière. Si l’ADX est inférieur à 20, il n’y a pas de direction définie. Dès que l'indicateur dépasse ce niveau, une tendance de force moyenne commence. Les valeurs supérieures à 40 indiquent une tendance forte (une tendance à la baisse ou à la hausse).
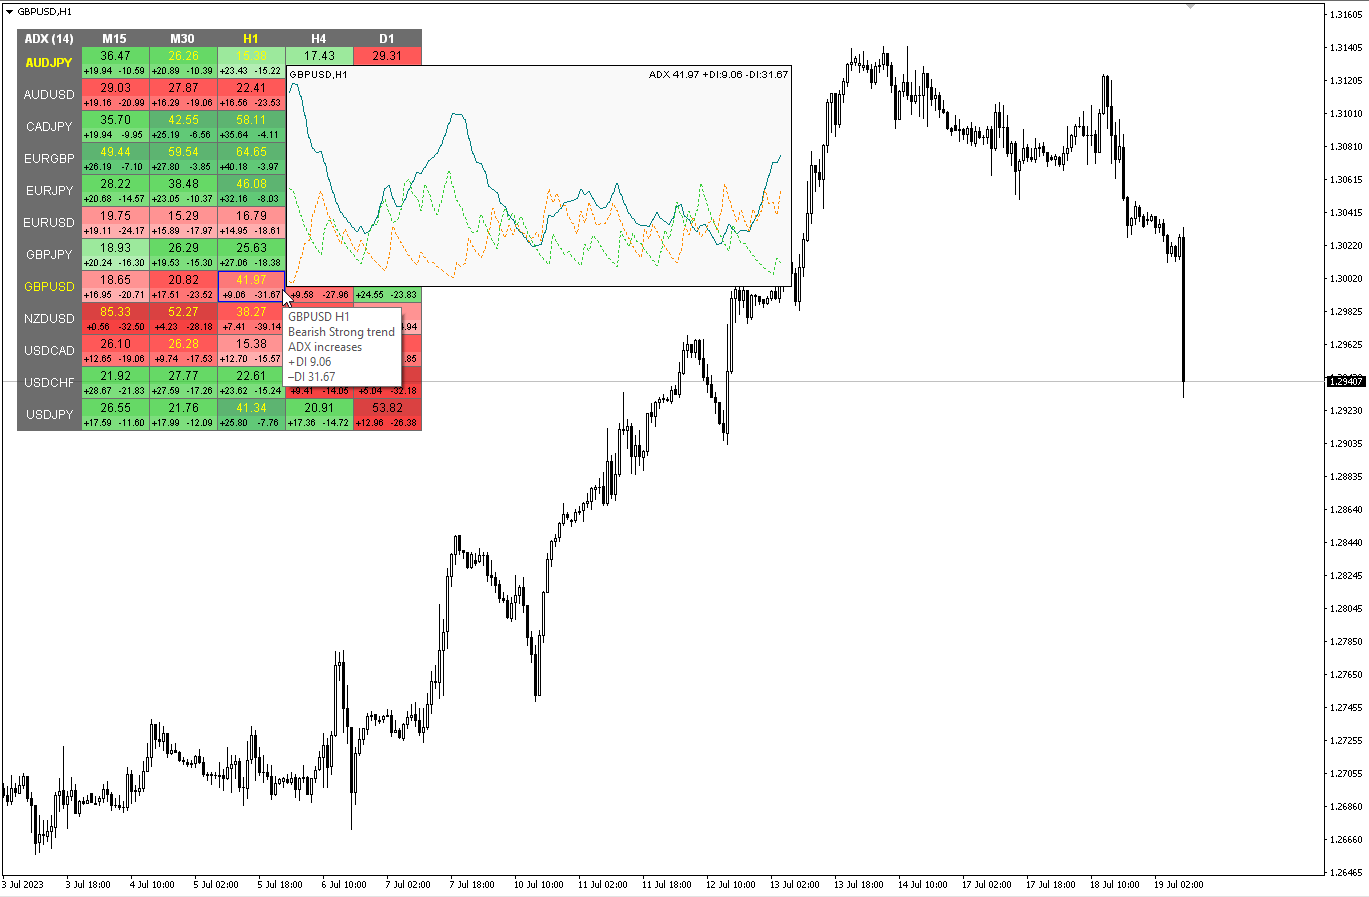
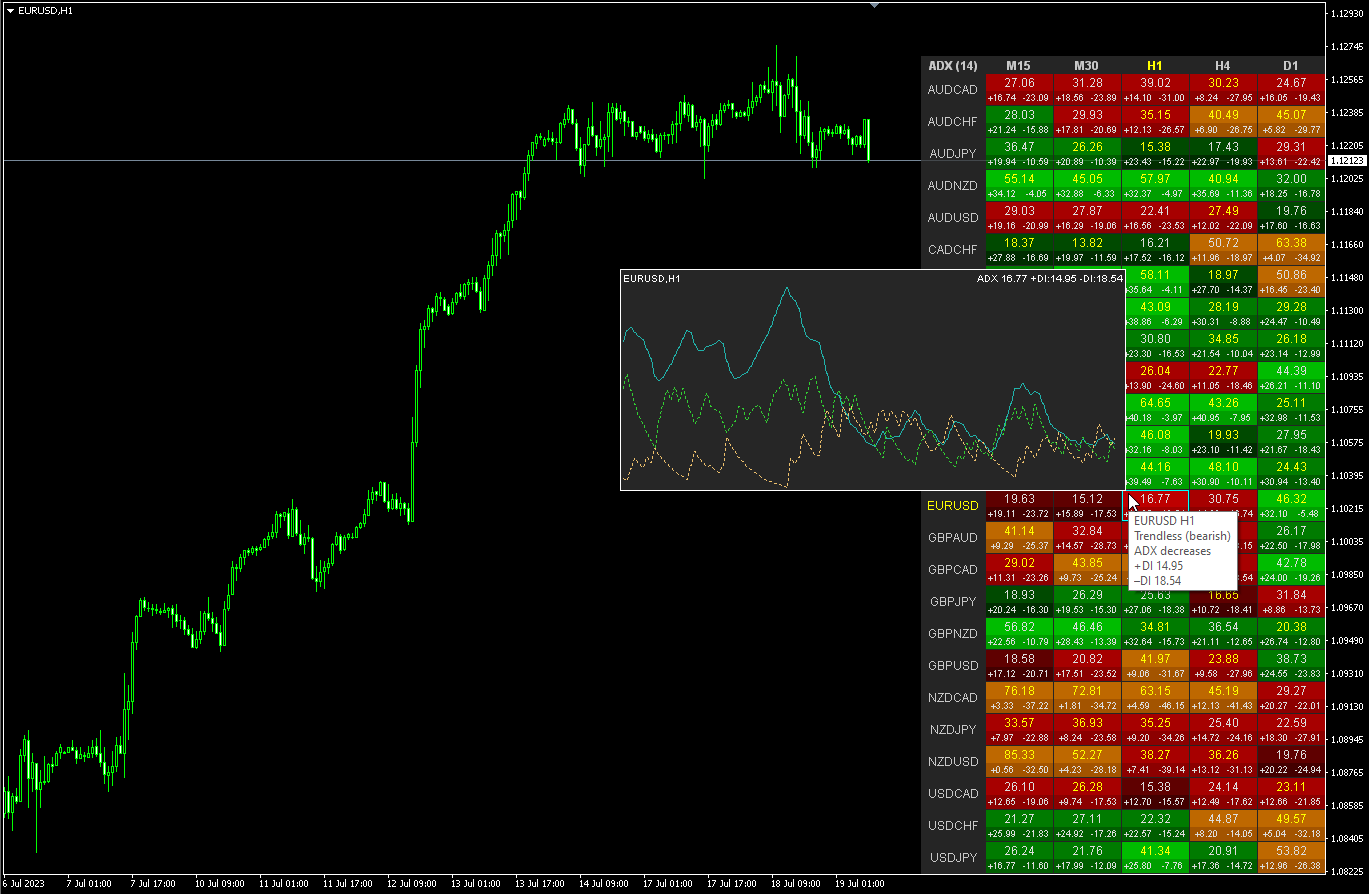
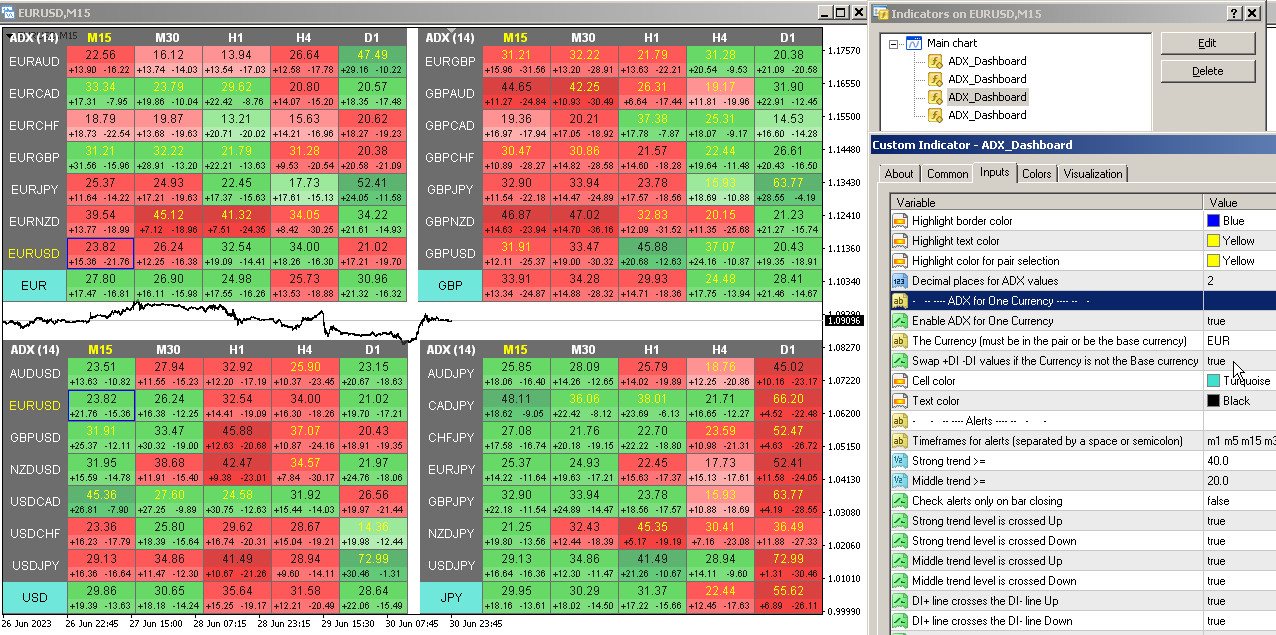
Modification multidevises et multitemporelles de l’indicateur Average Directional Movement Index (ADX). Vous pouvez spécifier les devises et les délais souhaités dans les paramètres. En outre, l'indicateur peut envoyer des notifications lorsque les niveaux de force de tendance sont franchis et lorsque les lignes +DI et -DI sont franchies. En cliquant sur une cellule avec un point, ce symbole et ce point seront ouverts. Il s'agit du scanner MTF.
Semblable au Currency Strength Meter (CSM), le tableau de bord peut sélectionner automatiquement les paires qui contiennent une devise spécifiée, ou les paires qui ont cette devise comme devise de base. L'indicateur recherche la devise dans toutes les paires spécifiées dans « Ensemble de paires » ; les autres paires sont ignorées. Et sur la base de ces paires, l'ADX total pour cette devise est calculé. Et vous pouvez voir à quel point cette monnaie est forte ou faible.
La clé pour masquer le tableau de bord du graphique est "D" par défaut
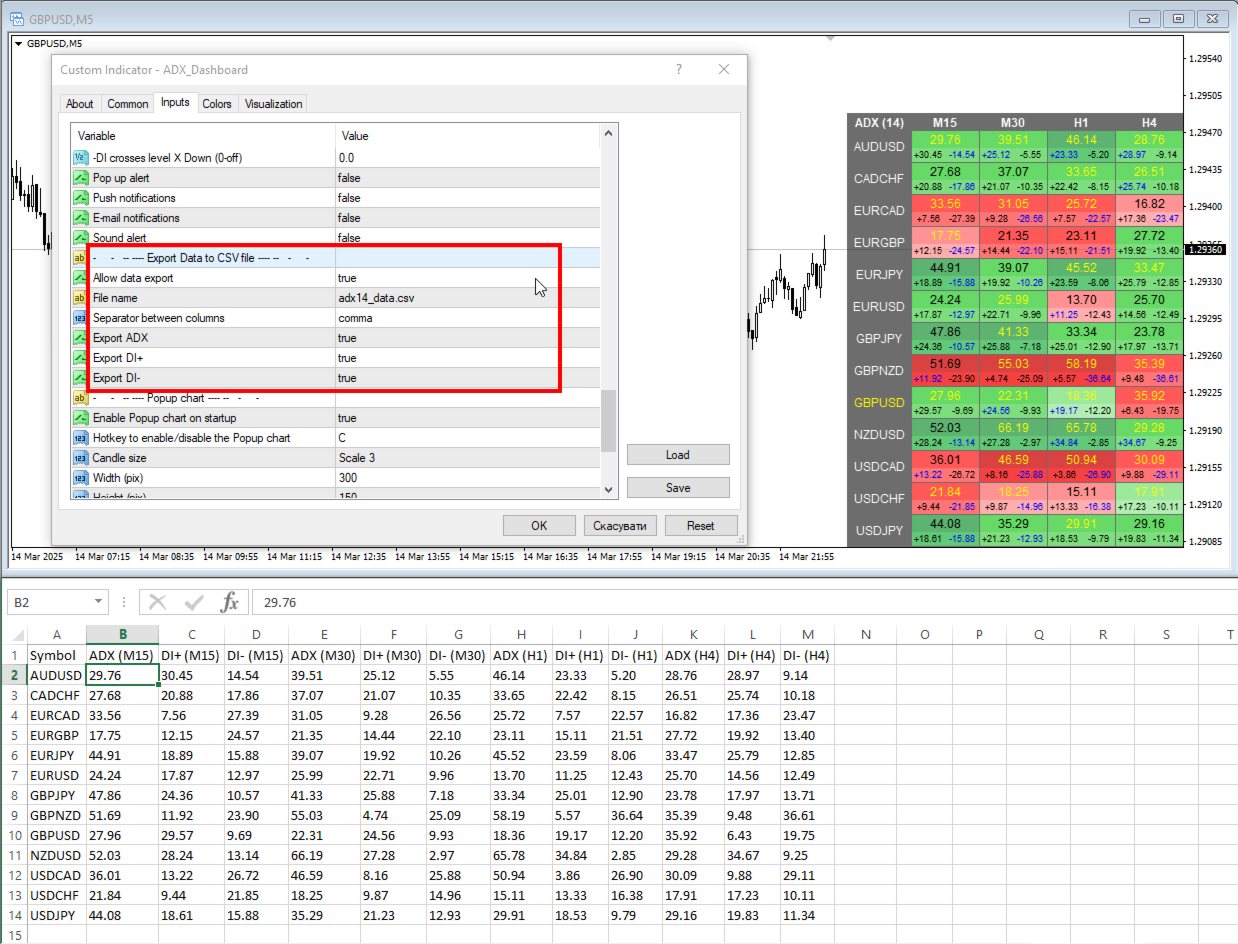
Vous pouvez exporter les données du tableau de bord ADX vers un fichier CSV. Le fichier sera enregistré dans le dossier du terminal : \MQL4\Files.
Les données seront enregistrées selon le délai défini : « Actualiser le tableau de bord toutes les (secondes) ».
Pour mettre à jour le fichier enregistré lorsqu'il est ouvert dans Excel, ouvrez-le via l'onglet « Données » - « Obtenir des données externes à partir de texte ». Le fichier sera alors mis à jour par le tableau de bord et dans Excel.
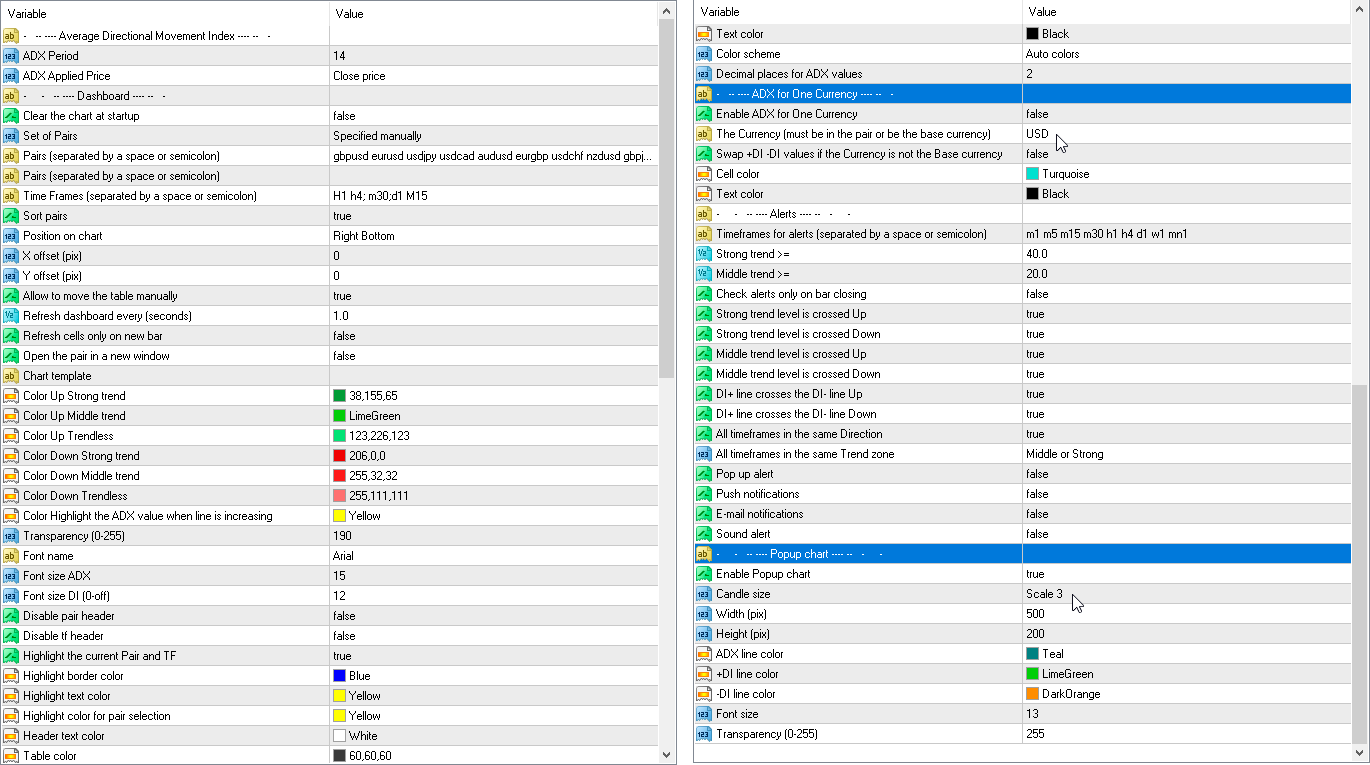
Paramètres
ADX Period — période de moyenne.
ADX Applied Price — type de prix.
Clear the chart at startup — effacez le graphique au démarrage
Set of Pairs — ensemble de symboles:
— Market Watch — Paires de "Market Watch" du MT.— Specified manually — paires spécifiées manuellement, dans les paramètres "Paires".— Current pair — affiche uniquement la paire actuelle.
Pairs (separated by a space or semicolon) — liste de symboles séparés par des espaces ou des points-virgules. Les noms des devises doivent être écrits exactement comme ceux du courtier, en conservant la casse et le préfixe/suffixe.
Time Frames (separated by a space or semicolon) — liste de délais séparés par des espaces ou des points-virgules (multi-périodes).
Sort pairs — trier la liste des paires.
Position on chart — coin pour afficher le panneau sur la carte.
X offset (pix) — déplace le panneau le long de l'axe X.
Y offset (pix) — déplace le panneau le long de l'axe Y.
Allow to move the table manually — autorise le déplacement de la table avec la souris.
Refresh dashboard every (seconds) — période de mise à jour pour toutes les paires et toutes les périodes.
Refresh cells only on new bar — les mises à jour des cellules (et les alertes) ne se produiront que lorsqu'une nouvelle barre apparaîtra.
Open the pair in a new window — ouvrez un symbole dans une nouvelle fenêtre graphique en cliquant.
Chart template — nom du modèle du graphique, si le graphique s'ouvre dans une nouvelle fenêtre.
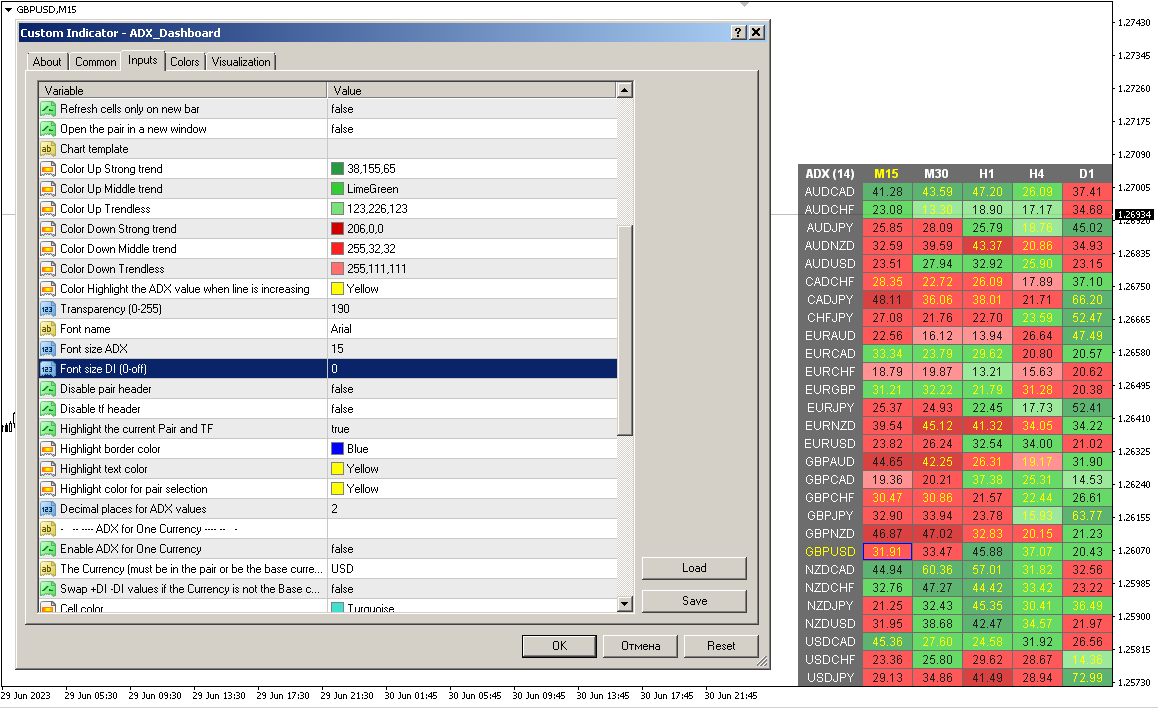
Paramètres de couleur
Color Up Strong trend — couleur des cellules s'il existe une forte tendance.
Color Up Middle trend — couleur des cellules, s'il s'agit de la tendance médiane.
Color Up Trendless — couleur des cellules s'il n'y a pas de tendance.
Color Down Strong trend — couleur des cellules s'il existe une tendance forte.
Color Down Middle trend — couleur des cellules, s'il s'agit de la tendance moyenne.
Color Down Trendless — couleur des cellules s'il n'y a pas de tendance.
Transparency (0-255) — transparence du panneau.
Font name — Nom de la police.
Font size ADX — Taille de police ADX.
Font size DI (0-off) — Taille de police DI (0-off).
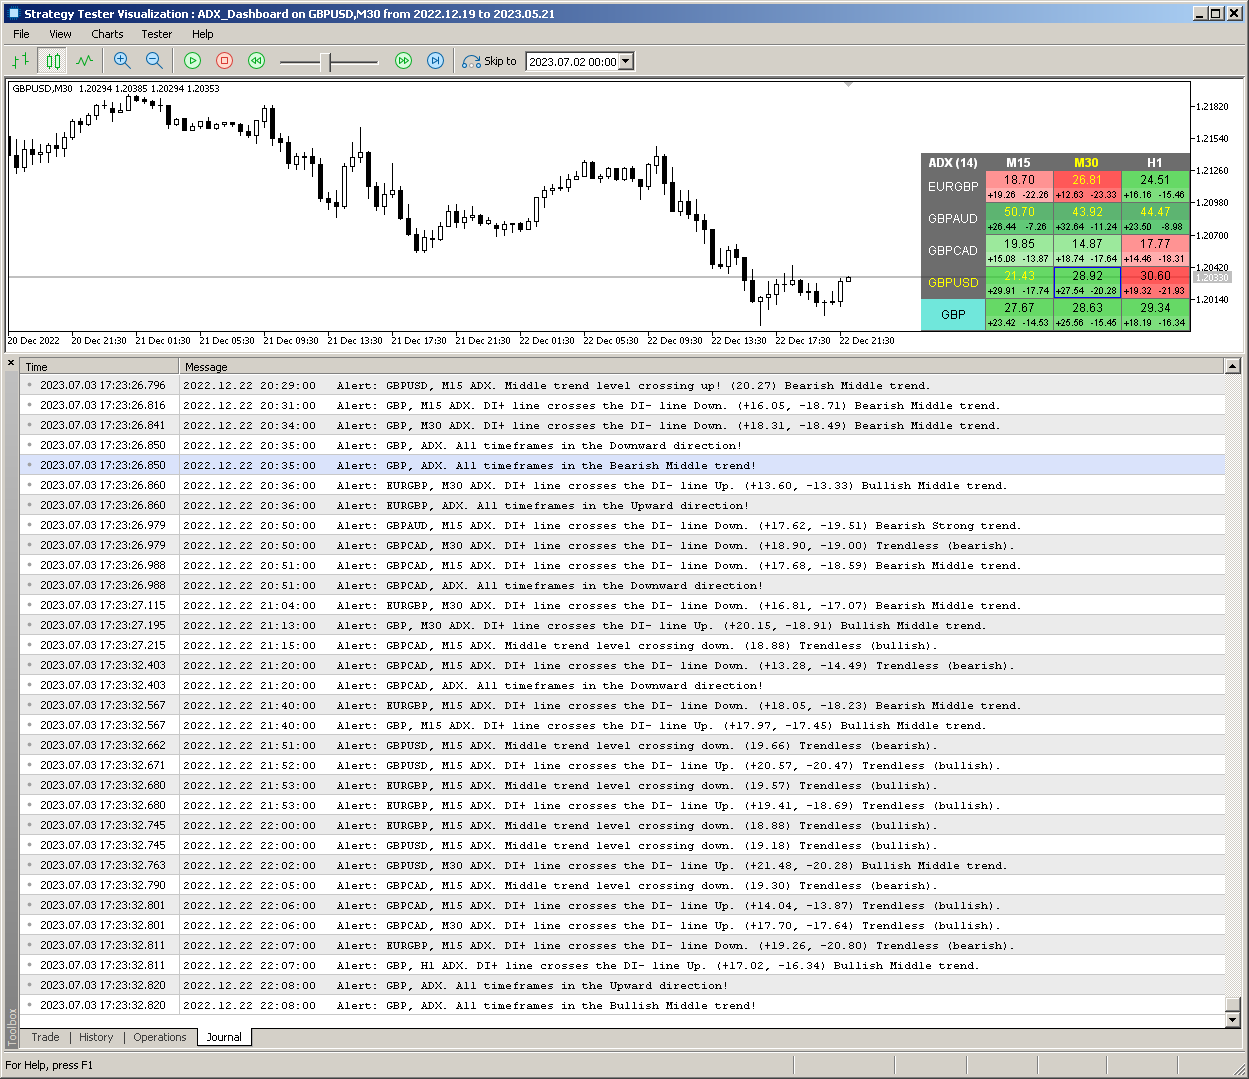
Alertes
Timeframes for alerts (separated by a space or semicolon) — liste des périodes pour lesquelles l'alerte sera envoyée (séparées par un espace ou un point-virgule).
Strong trend >= — le niveau d'une tendance forte
Middle trend >= — le niveau de la tendance médiane.
Check alerts only on bar closing — vérifiez le passage à niveau uniquement après la fermeture du bar.
Strong trend level is crossed Up — alerte lorsque ADX franchit le niveau d’une forte tendance à la hausse.
Strong trend level is crossed Down — alerte lorsque ADX franchit le niveau d’une forte tendance à la baisse.
Middle trend level is crossed Up — alerte lorsque le niveau de la tendance médiane est franchi à la hausse.
Middle trend level is crossed Down — alerte lorsque le niveau de la tendance intermédiaire est franchi à la baisse.
DI+ line crosses the DI- line Up — alerte lorsque DI+ croise DI-up.
DI+ line crosses the DI- line Down — alerte lorsque DI+ traverse DI-down.
All timeframes in the same direction — alerte lorsque toutes les cellules affichent la même direction.
DI+ changes direction — DI+ change de direction.
DI- changes direction — DI- change de direction.
DI+ crosses level X (0-off) — DI+ franchit le niveau X (0-off).
DI- crosses level X (0-off) — DI- traverse le niveau X (0-off).
Pop up alert — Alerte contextuelle.
Push notifications — Notifications push.
E-mail notifications — Notifications par email.
Sound alert — Alerte sonore.
Export Data to CSV fileAllow data export
File name
Separator between columns
Export ADX
Export DI+
Export DI-
Graphique contextuel
Enable Popup chart — Activer le graphique contextuel
Candle size — Taille de la bougie
Width (pix) — Largeur (pixels)
Height (pix) — Hauteur (pix)
Font size — Taille de police
Transparency (0-255) — Transparence (0-255)


Another excellent piece of work from this talented programmer!
A thousand thanks, Taras!