ZigZag Dashboard for MT4
- 指标
- 版本: 6.40
- 更新: 17 六月 2026
- 激活: 10

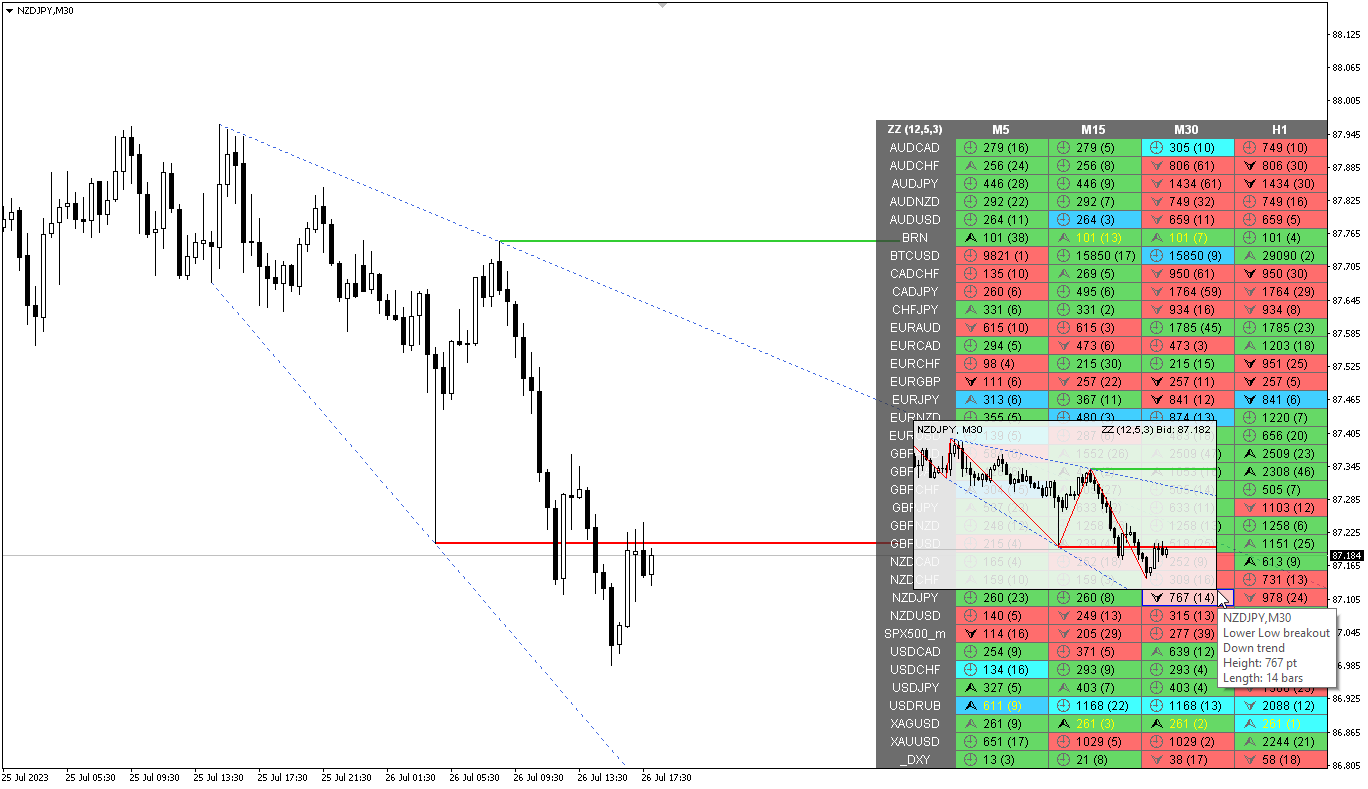
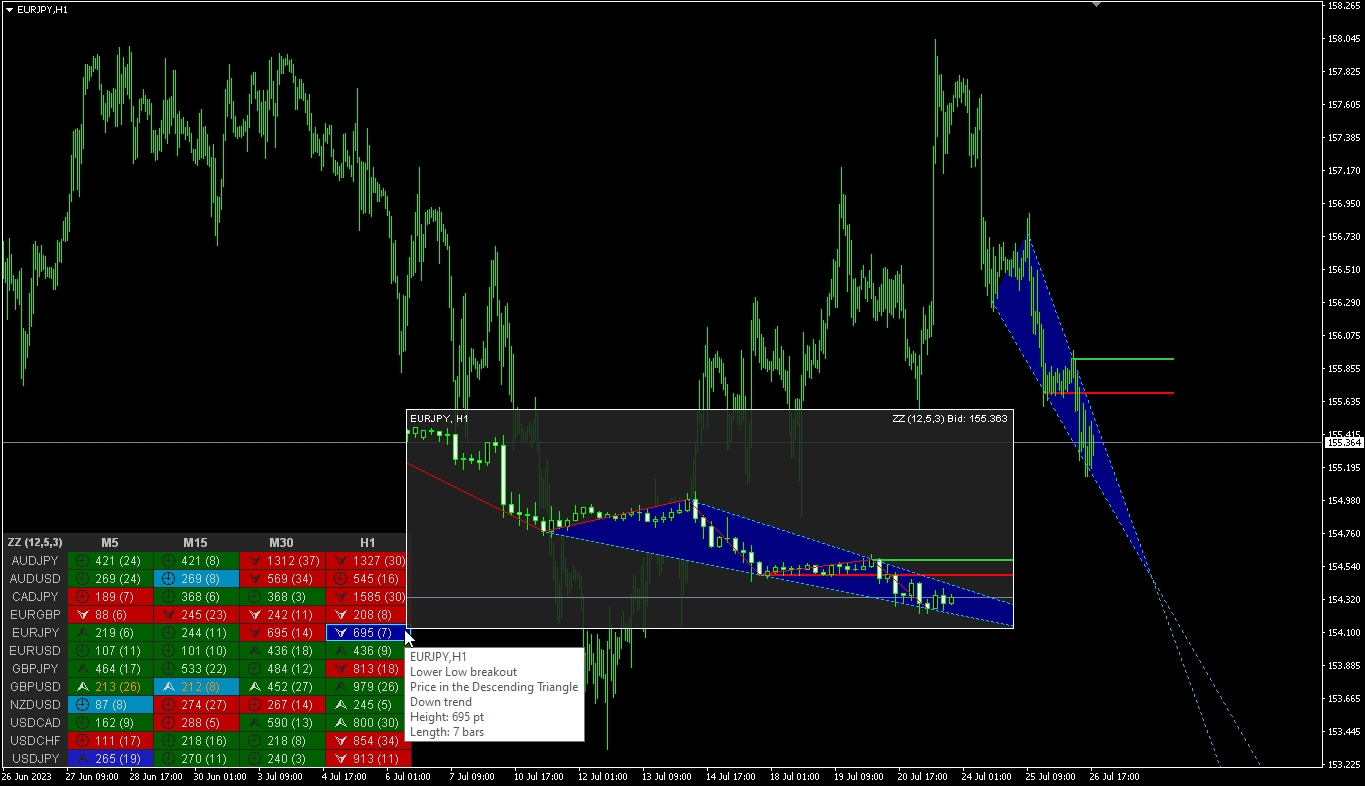
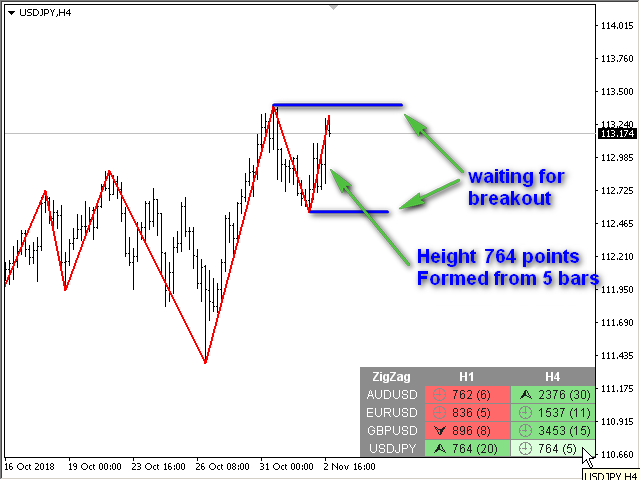
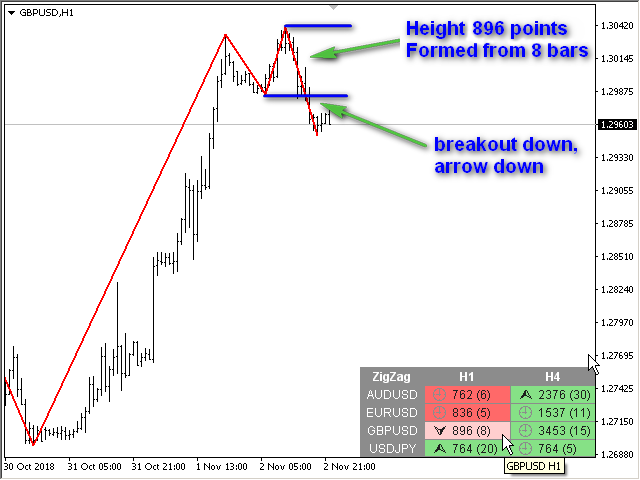
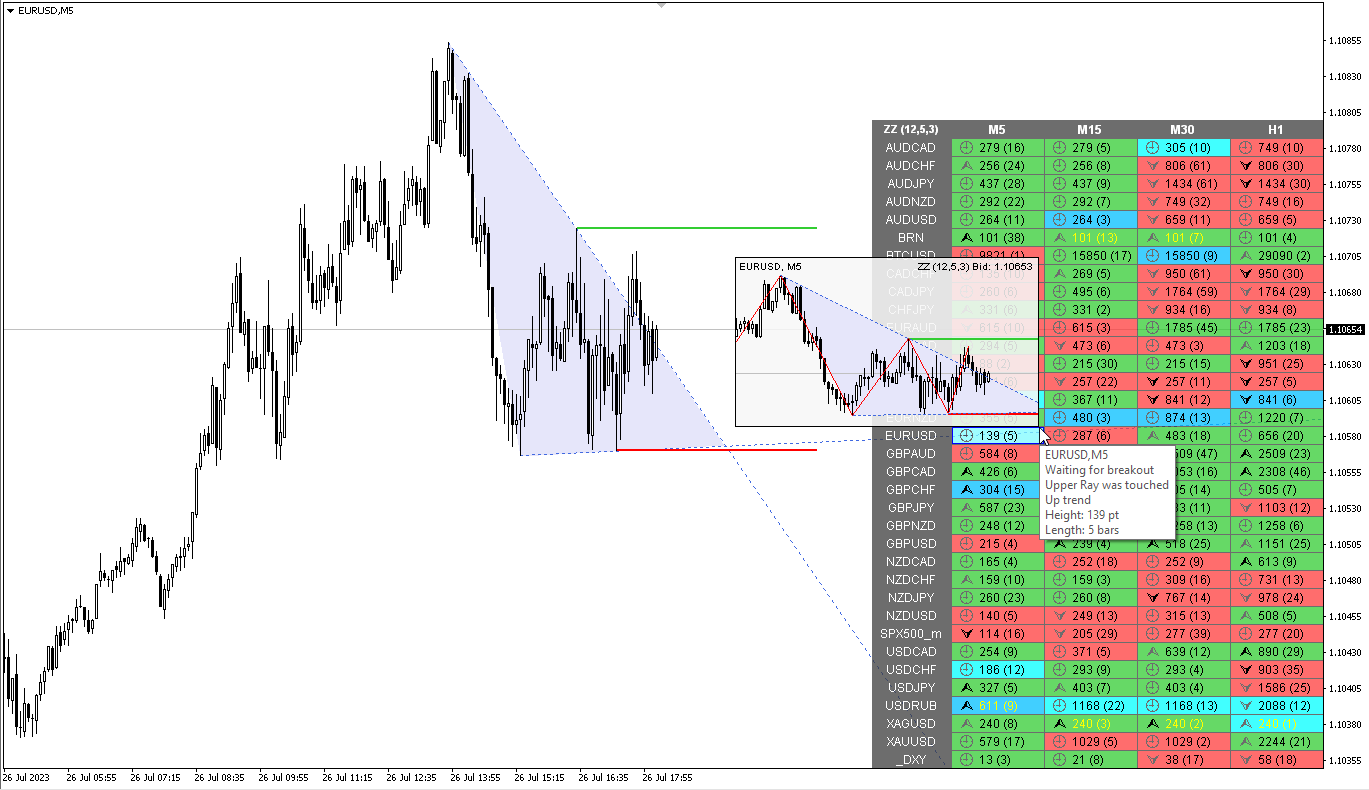
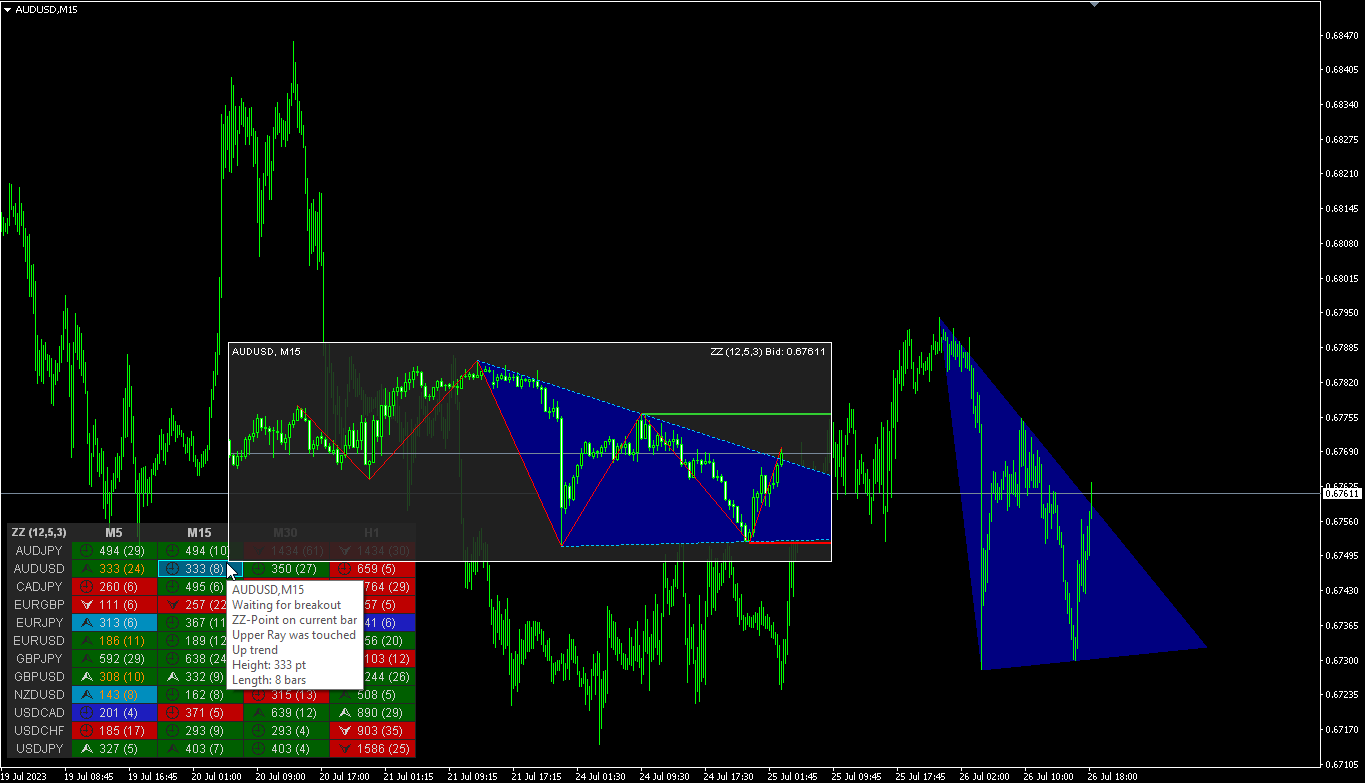
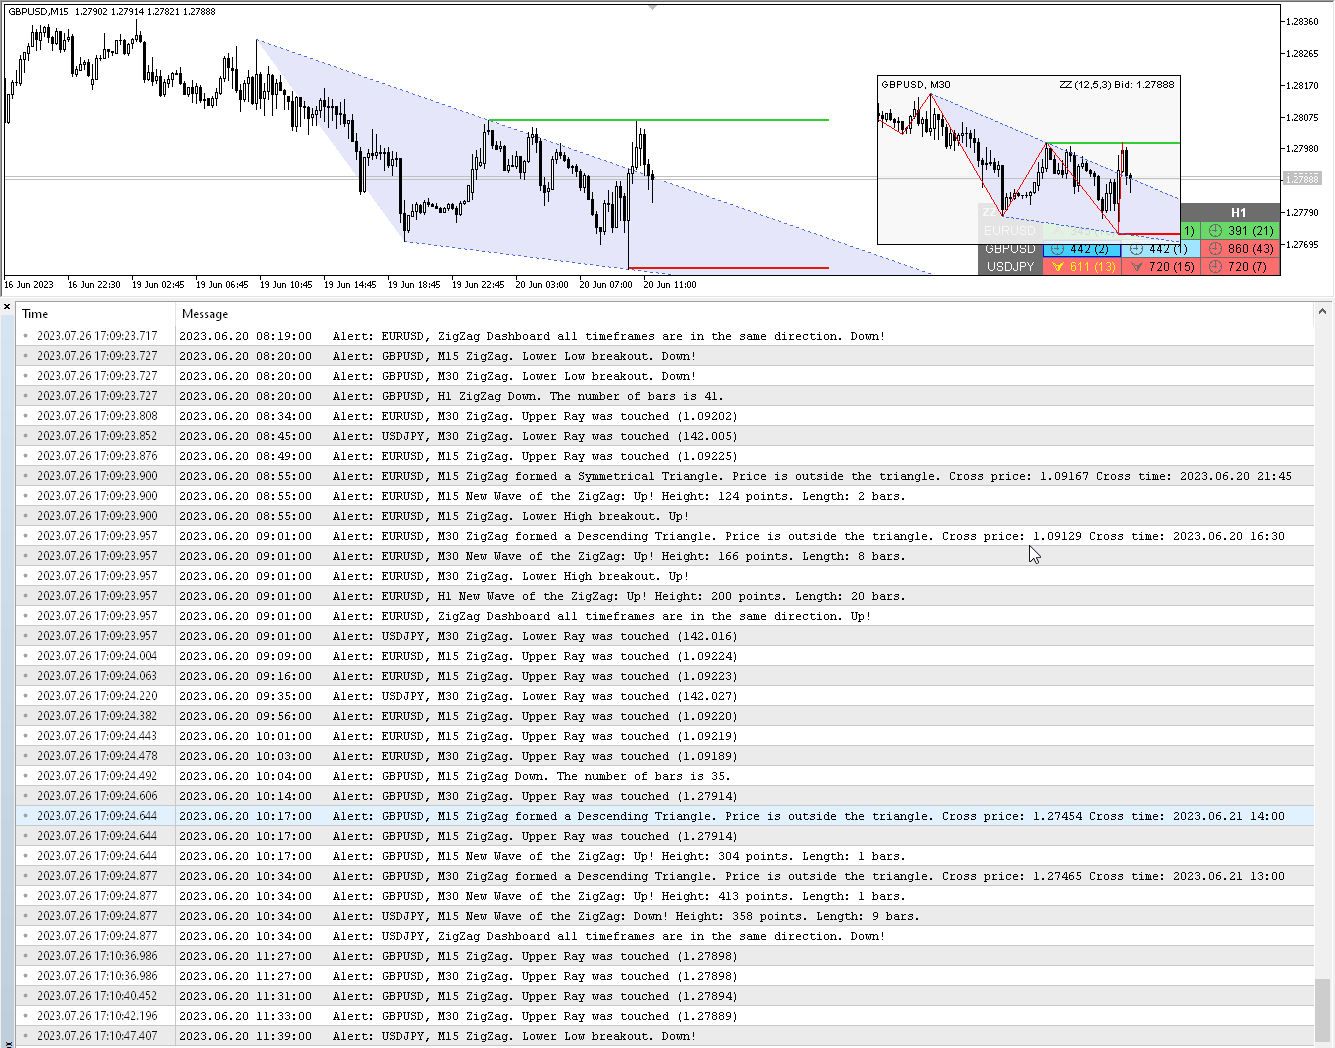
ZigZag 指标的多货币和多时间框架修改。 显示市场的当前方向、上次走势的高度、本次走势中的柱数以及锯齿形调整浪(水平线)的前一个点的突破。 这是 MTF 扫描仪。
您可以在参数中指定任何所需的货币和时间范围。 此外,当之字折线改变方向或突破前一点时,面板可以发送通知。 通过单击带有句点的单元格,将打开该符号和句点. 指标——连接关键低点和高点以显示趋势线
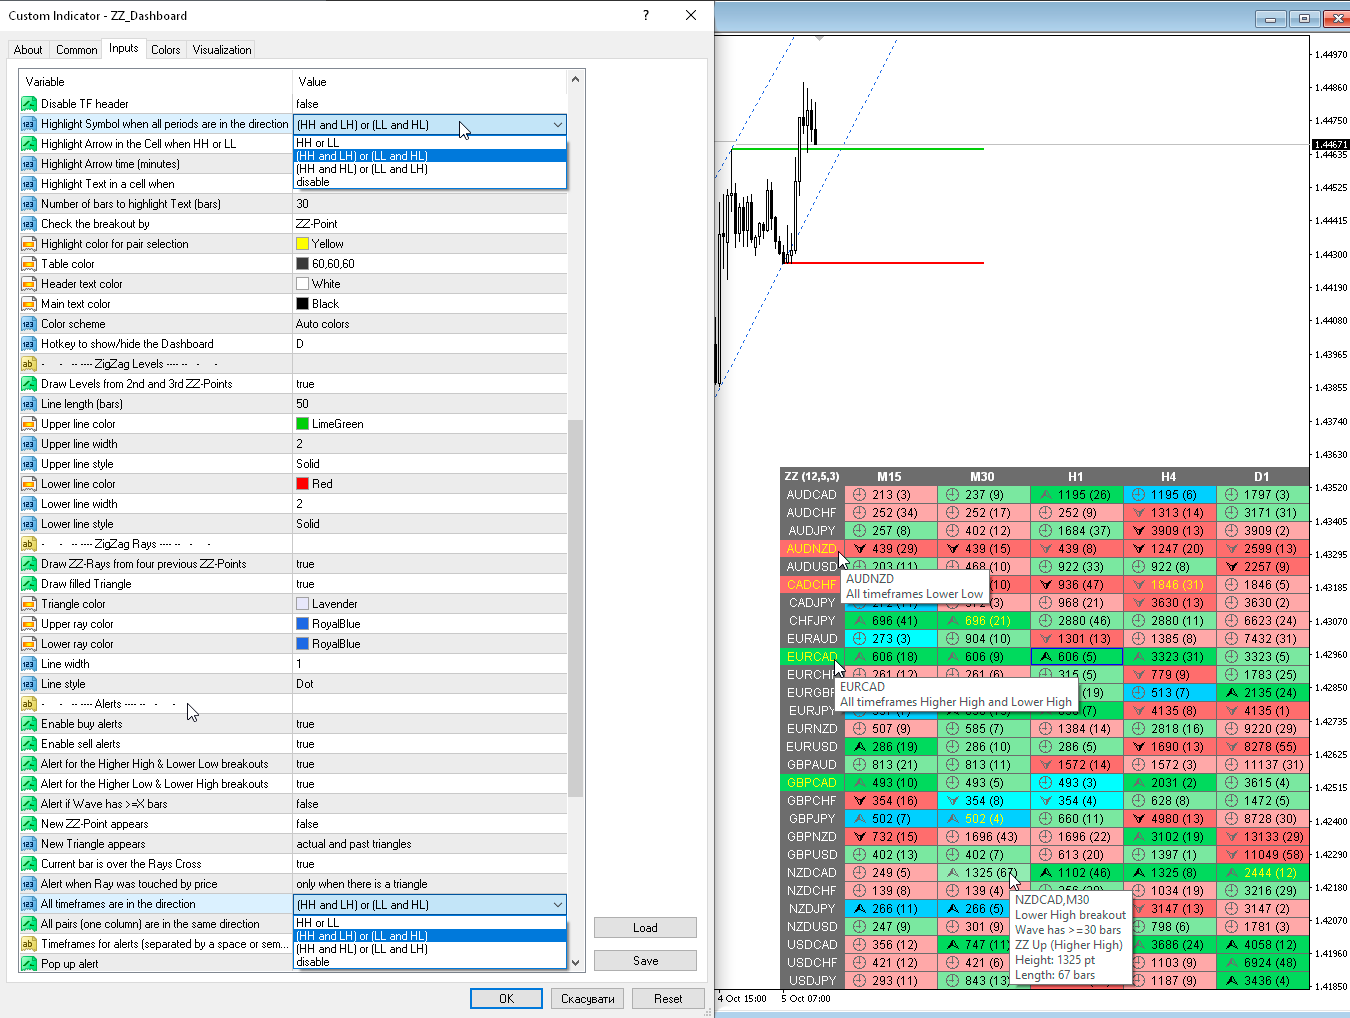
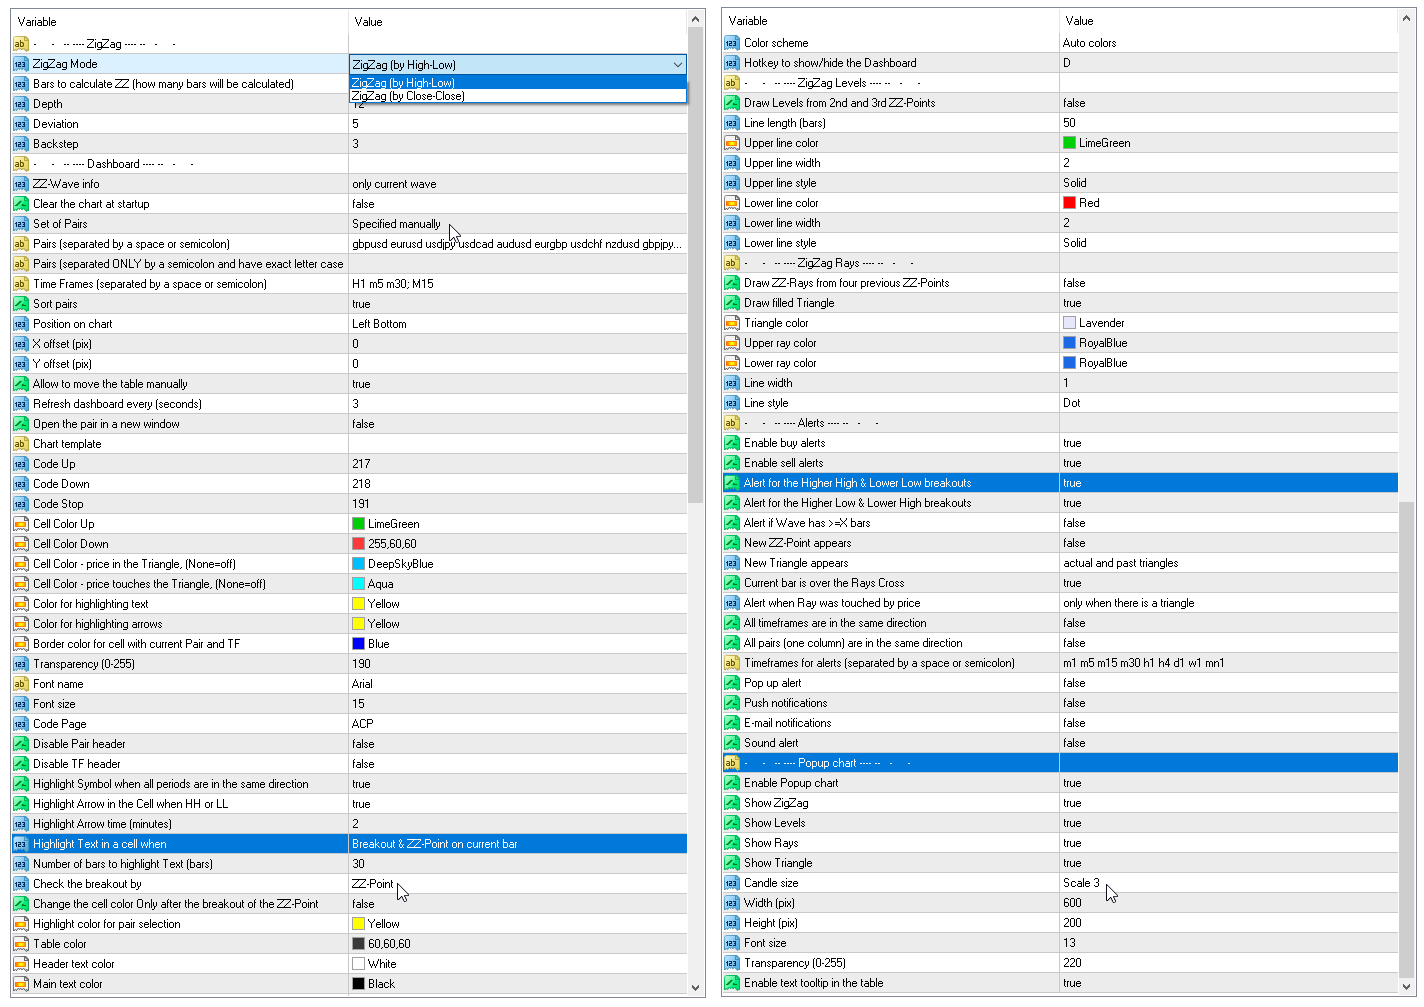
参数
Depth — 如果最后一根蜡烛的偏差小于(或大于)前一根,则 Zigzag 将不会绘制第二个最大值(或最小值)的烛台的最小数量;
Deviation — 锯齿形形成局部顶部/底部的两个相邻烛台的最高点/最低点之间的最小点数;
Backstep — 局部高点/低点之间的最小烛台数量;
Bars to calculate ZZ — 历史中用于查找 ZigZag 点的柱的数量.
ZZ-wave info — 表格中显示有关波形的哪些信息 — 仅当前波形或当前波形 + 上一个波形;
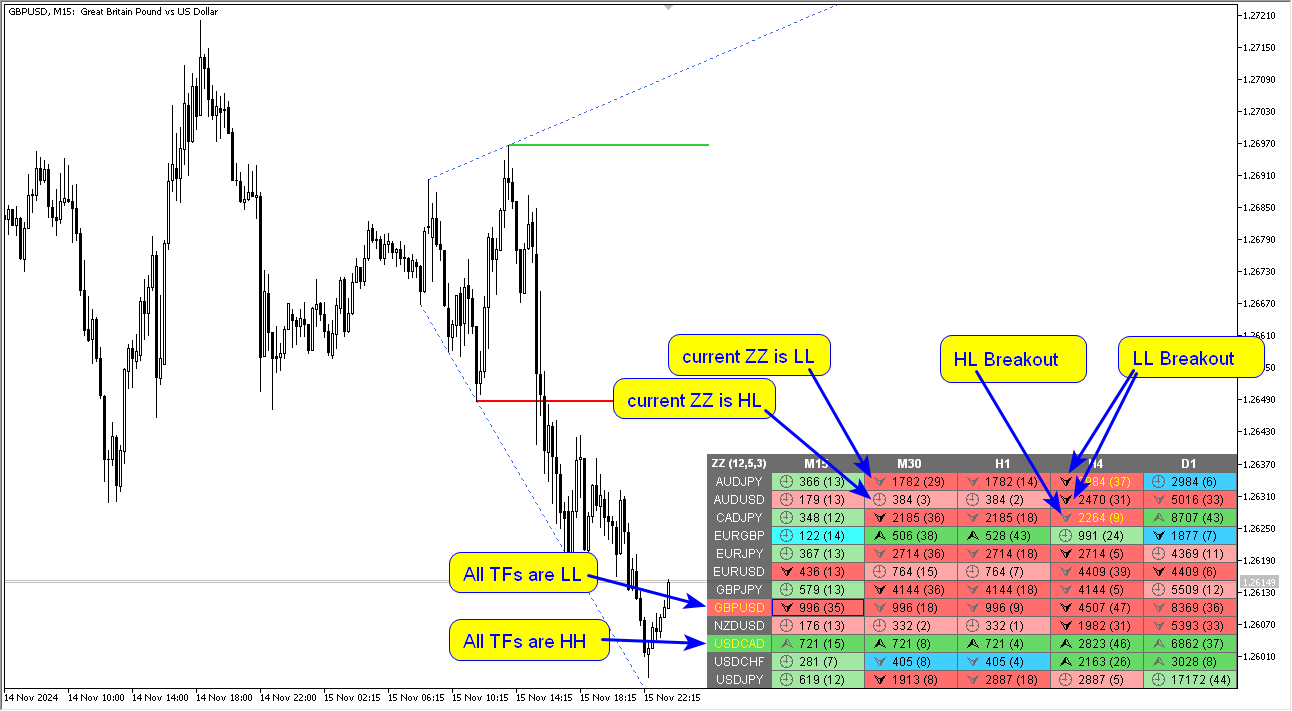
Highlight the symbol when all periods are in the same direction — 方向时突出显示该符号;
Symbol highlight time (minutes, 0-all the time) — 符号高亮时间(分钟,0-一直);
Highlight cells mode — 突出显示单元格模式
— Wave has >=X bars — 突出显示条数大于或等于 X 的单元格;— Breakout & ZZ-pt on current bar — 当上一个 ZigZag 点被突破时突出显示单元格(ZZ 点位于当前柱上);— ZZ-pt on current bar — 当 ZZ 点出现在当前栏上时突出显示单元格。 新的或变化的浪潮;— Price touched ZZ-Ray — 当 ZigZag 射线触及价格时突出显示单元格;— disable - 禁用-禁用单元格突出显示;
Number of bars to highlight cells (bars) — ZigZag 波形中应有多少条形图突出显示单元格;
Clear the chart at startup — 启动时清除图表。
Set of Pairs — 符号集
— Market Watch — 来自 MT 的“市场观察”的货币对。不要使用太多符号,这可能会导致指标变慢;— Specified manually — 在参数“Pairs”中手动指定对;— Current pair — 当前对;
Pairs (separated by a space or semicolon) — 由空格或分号分隔的符号列表。 货币名称的书写方式应与经纪商的名称完全相同,并保留大小写和前缀/后缀。
Time Frames (separated by a space or semicolon) — 由空格或分号分隔的时间范围列表(多个时间范围)。
Sort pairs — 对对列表进行排序。
Position on chart — 在图表上显示面板的角落。
X offset (pix) — 沿 X 轴移动面板;
Y offset (pix) — 沿 Y 轴移动面板;
Refresh dashboard every (seconds) — 所有货币对和时间范围的更新周期。
Open the pair in a new window — 通过单击在新图表窗口中打开交易品种。
Chart template — 图表模板的名称(如果图表在新窗口中打开)。
Color Up — 如果指示器增加,则单元格颜色。
Color Down — 如果指标下降,则单元格颜色。
Color Highlight — 文本突出显示颜色。
Transparency (0-255) — 面板的透明度。
Font name — 字体名称。
Font size — 字体大小。
警报
Timeframes for alerts (separated by a space or semicolon) — 发送警报的时间段列表(以空格或分号分隔)。
Alert if wave has >= X bars — 如果锯齿形调整浪的条数大于或等于 X,则发出警报。
Alert for the Higher High & Lower Low breakouts — 如果之前的高点或低点被突破,则发出警报。
Alert for the Higher Low & Lower High breakouts — 如果先前的 HL 或 LH 被突破,则发出警报。
New ZZ-Point appears — 如果出现新的锯齿形调整浪点,则会发出警报。
New Triangle appears — 新的三角形出现。
Current bar is over the Rays Cross — 当前柱位于射线十字上方。
Alert when Ray was touched by price — 当雷被价格触动时发出警报。
All timeframes are in the same direction — 所有时间范围都朝同一方向。
All pairs (one column) are in the same direction — 所有对(一列)都处于同一方向。
All timeframes are in the same direction — 当所有时间范围都在同一方向时发出警报。
All pairs (one column) are in the same direction — 所有对(一列)都处于同一方向。
Pop up alert — 弹出警报。
Push notifications — 推送通知。
E-mail notifications — 电子邮件通知。
Sound alert — 声音警报。


The developer is simply incredible! There aren’t many words—just amazing results. I've purchased many of his products—each one better than the last. The support is fantastic. If someone wants a serious “view” of the market, these are the ultimate tools! A thousand thanks, Taras! Keep up the great work!