Transaction Speed MT4

TIMES 为你的分析加入时间维度。它是交易“三位一体”的第三个组成部分:Meravith 显示公平价格,TransactionSpeed 显示公平成交量,而 TIMES 显示交易活动在时间上的集中位置——揭示动能是在累积还是在减弱。

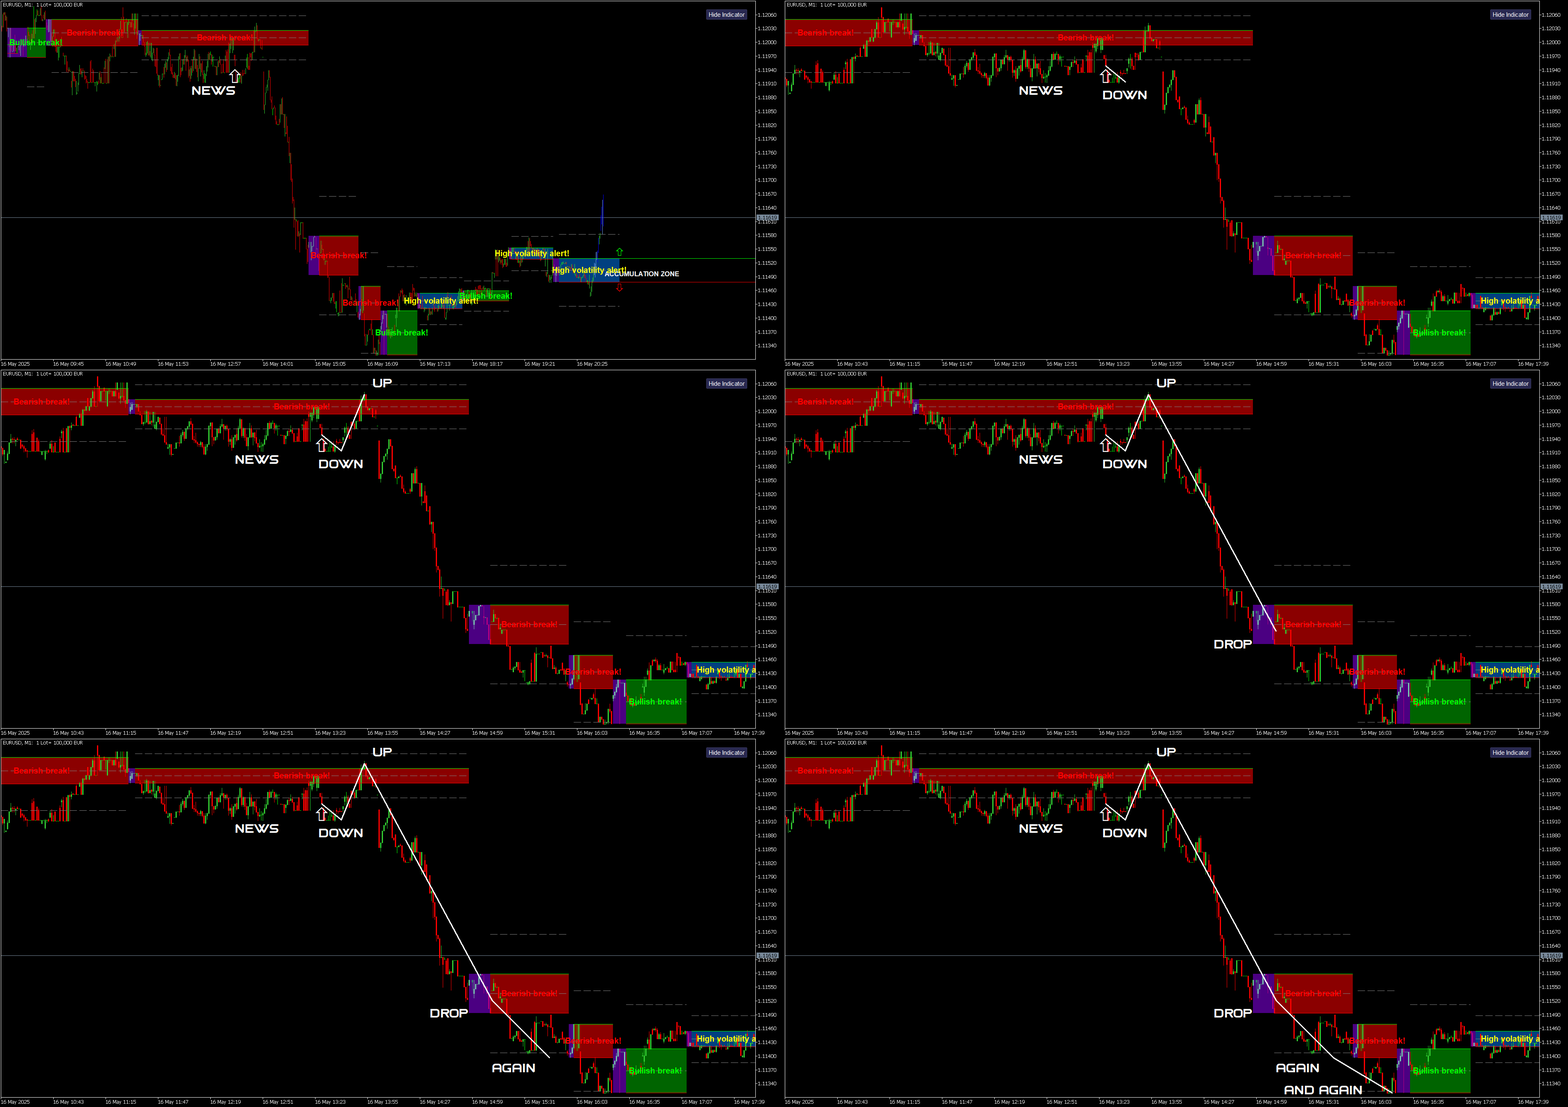
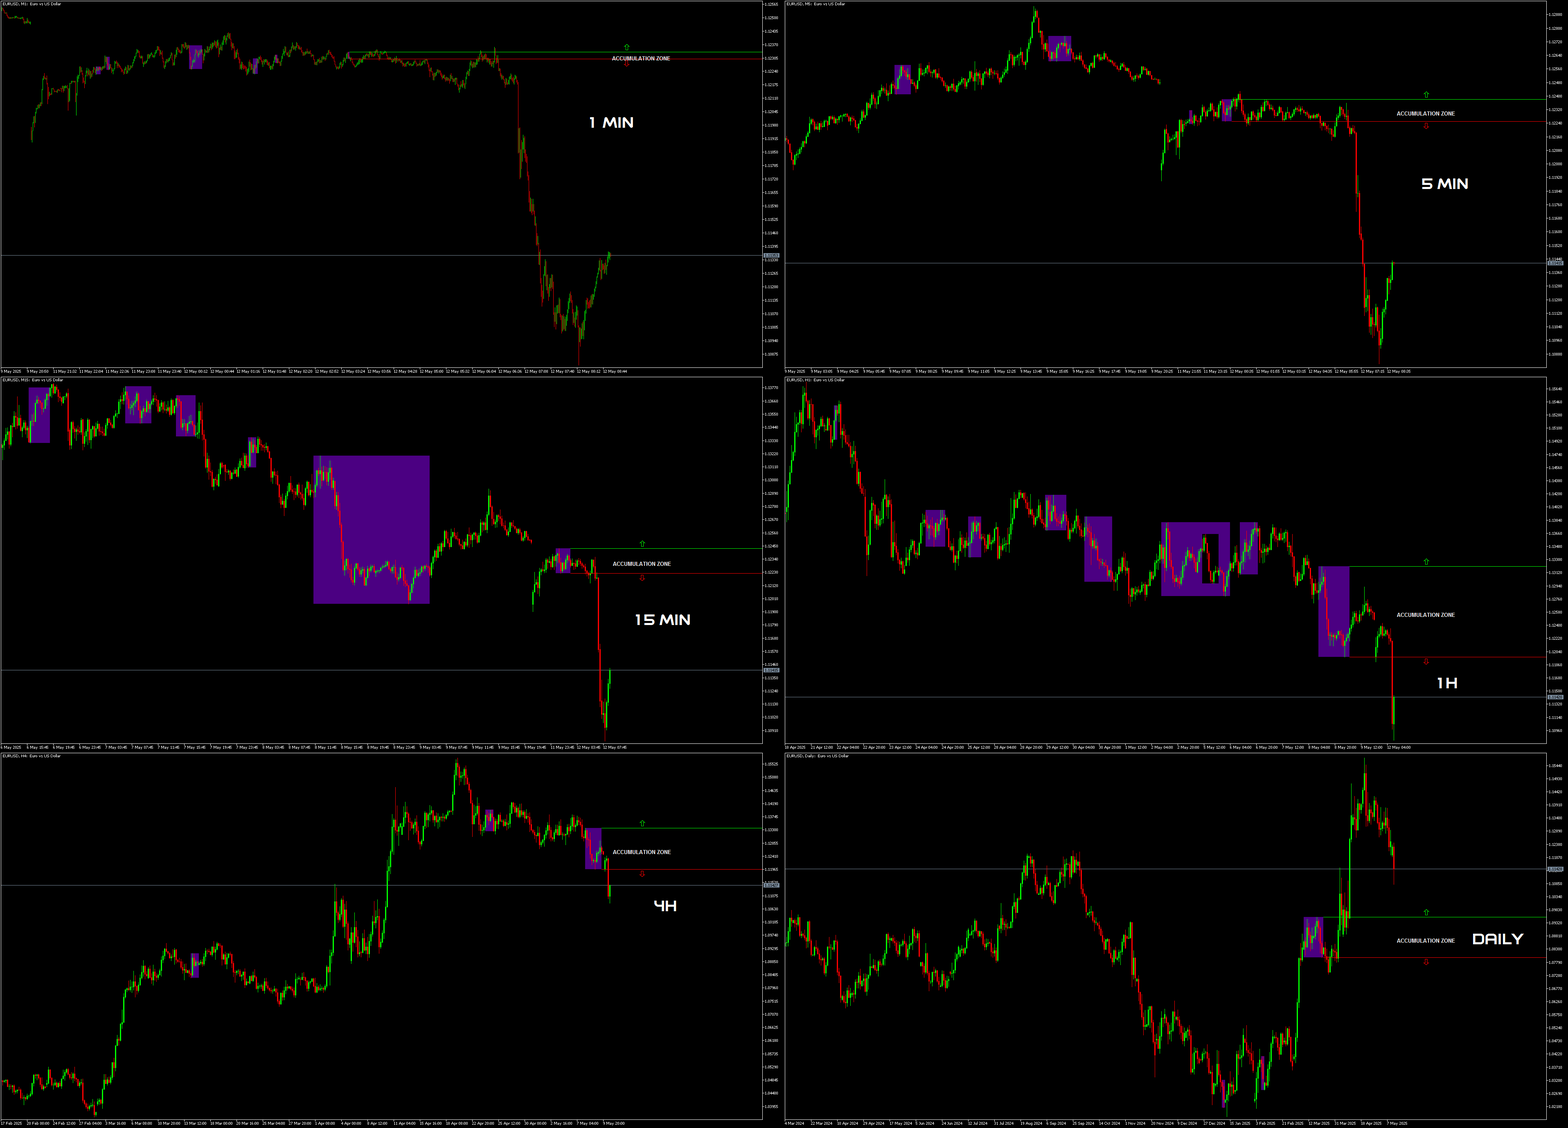
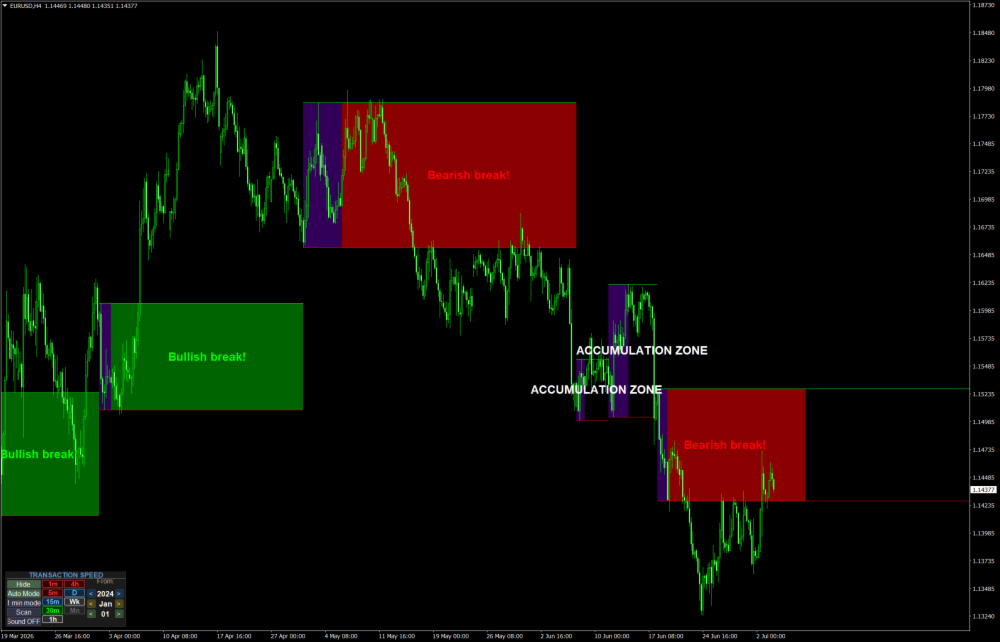
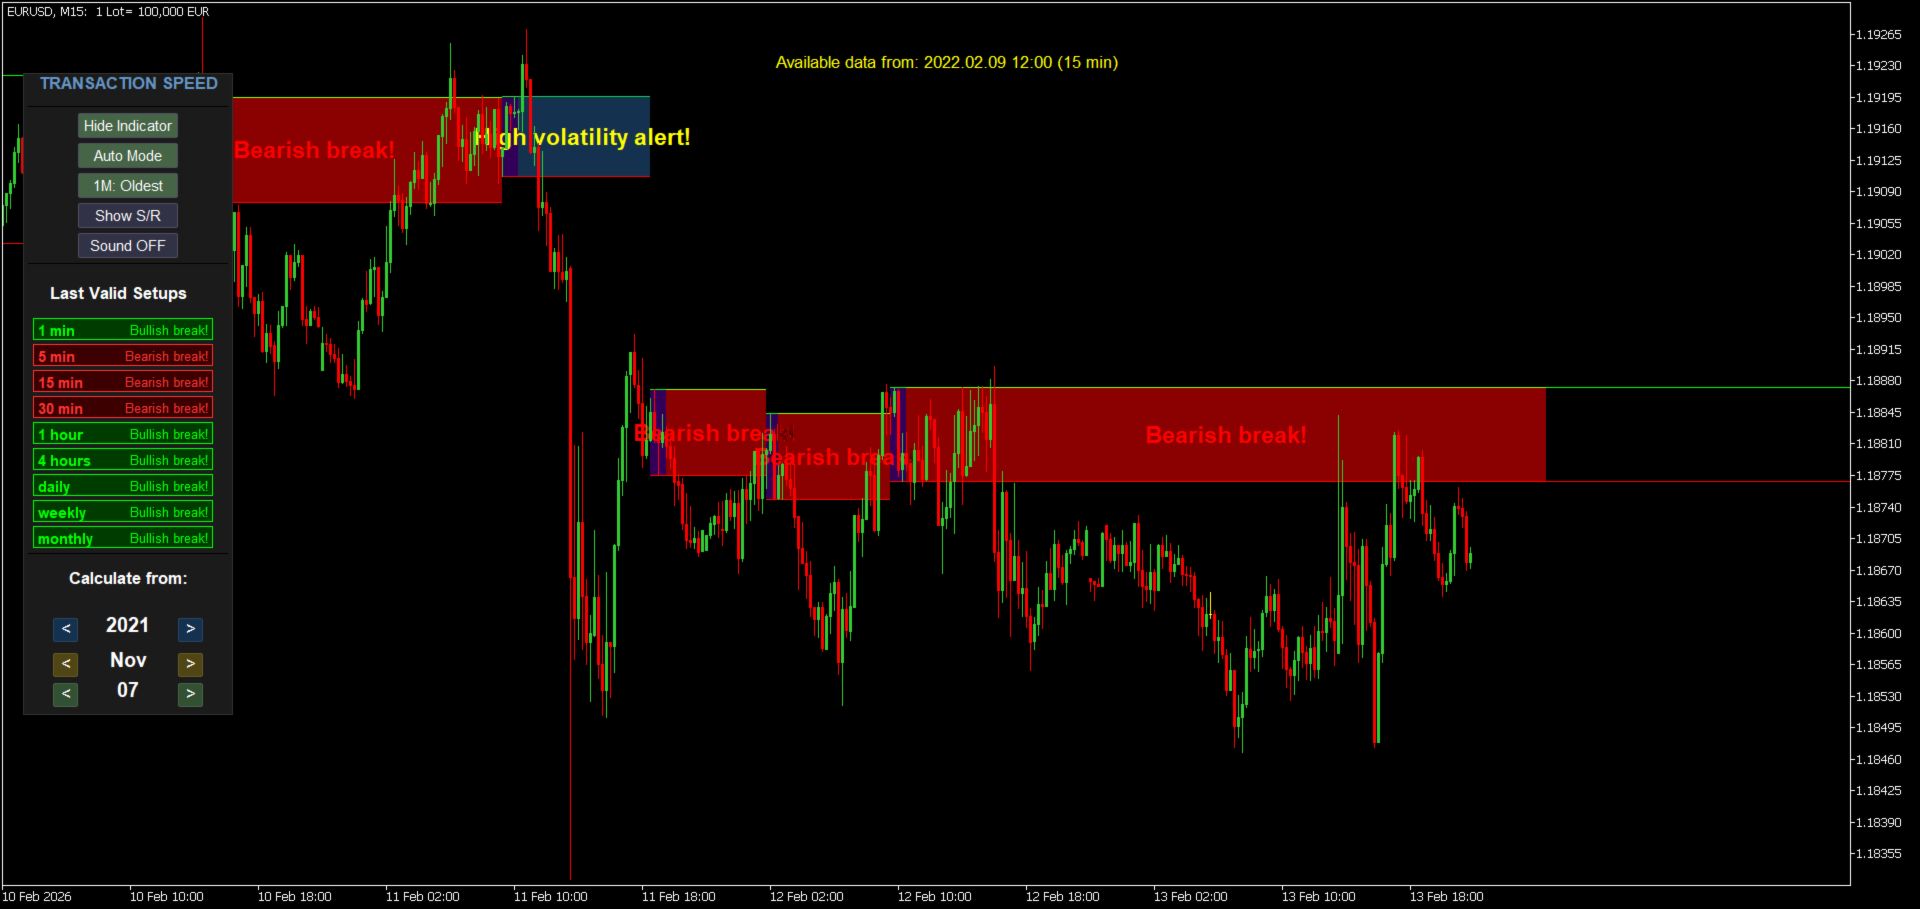
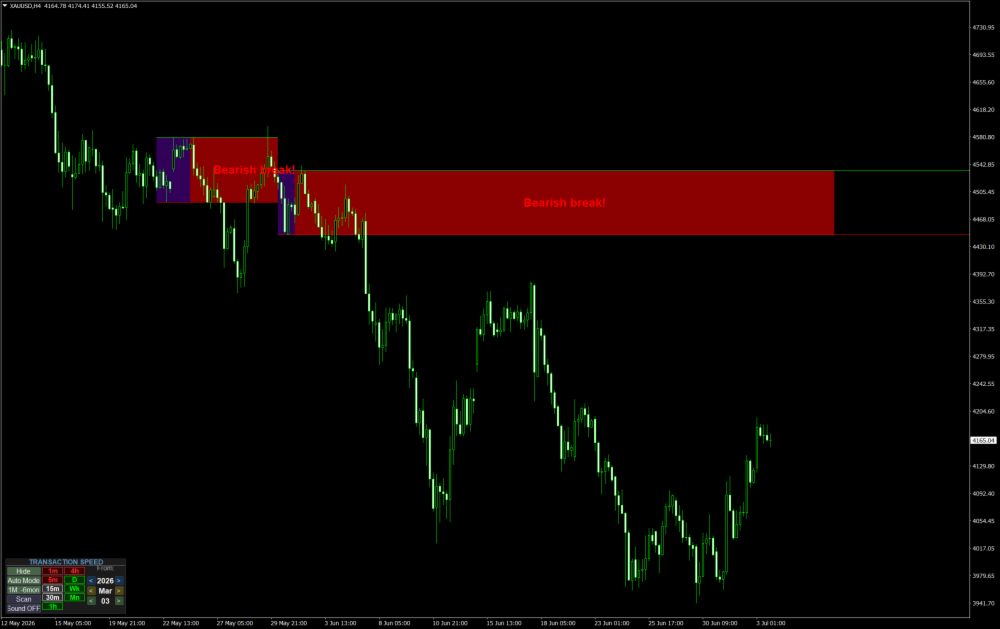
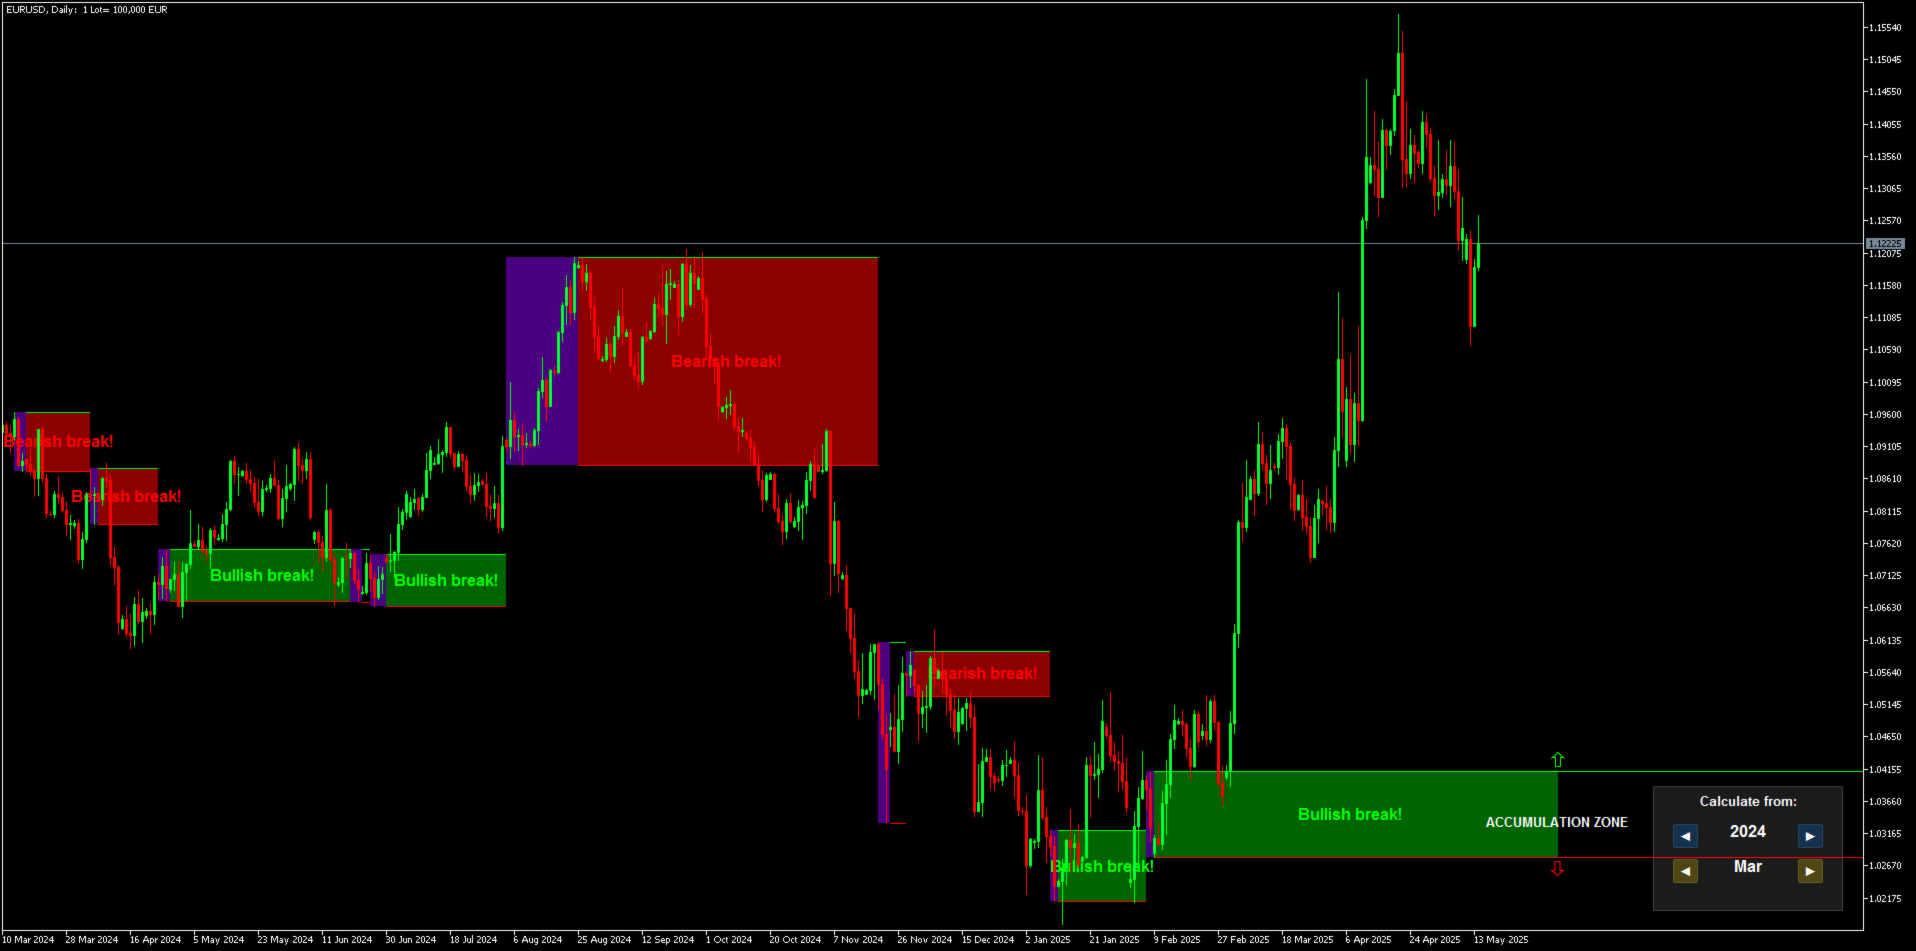
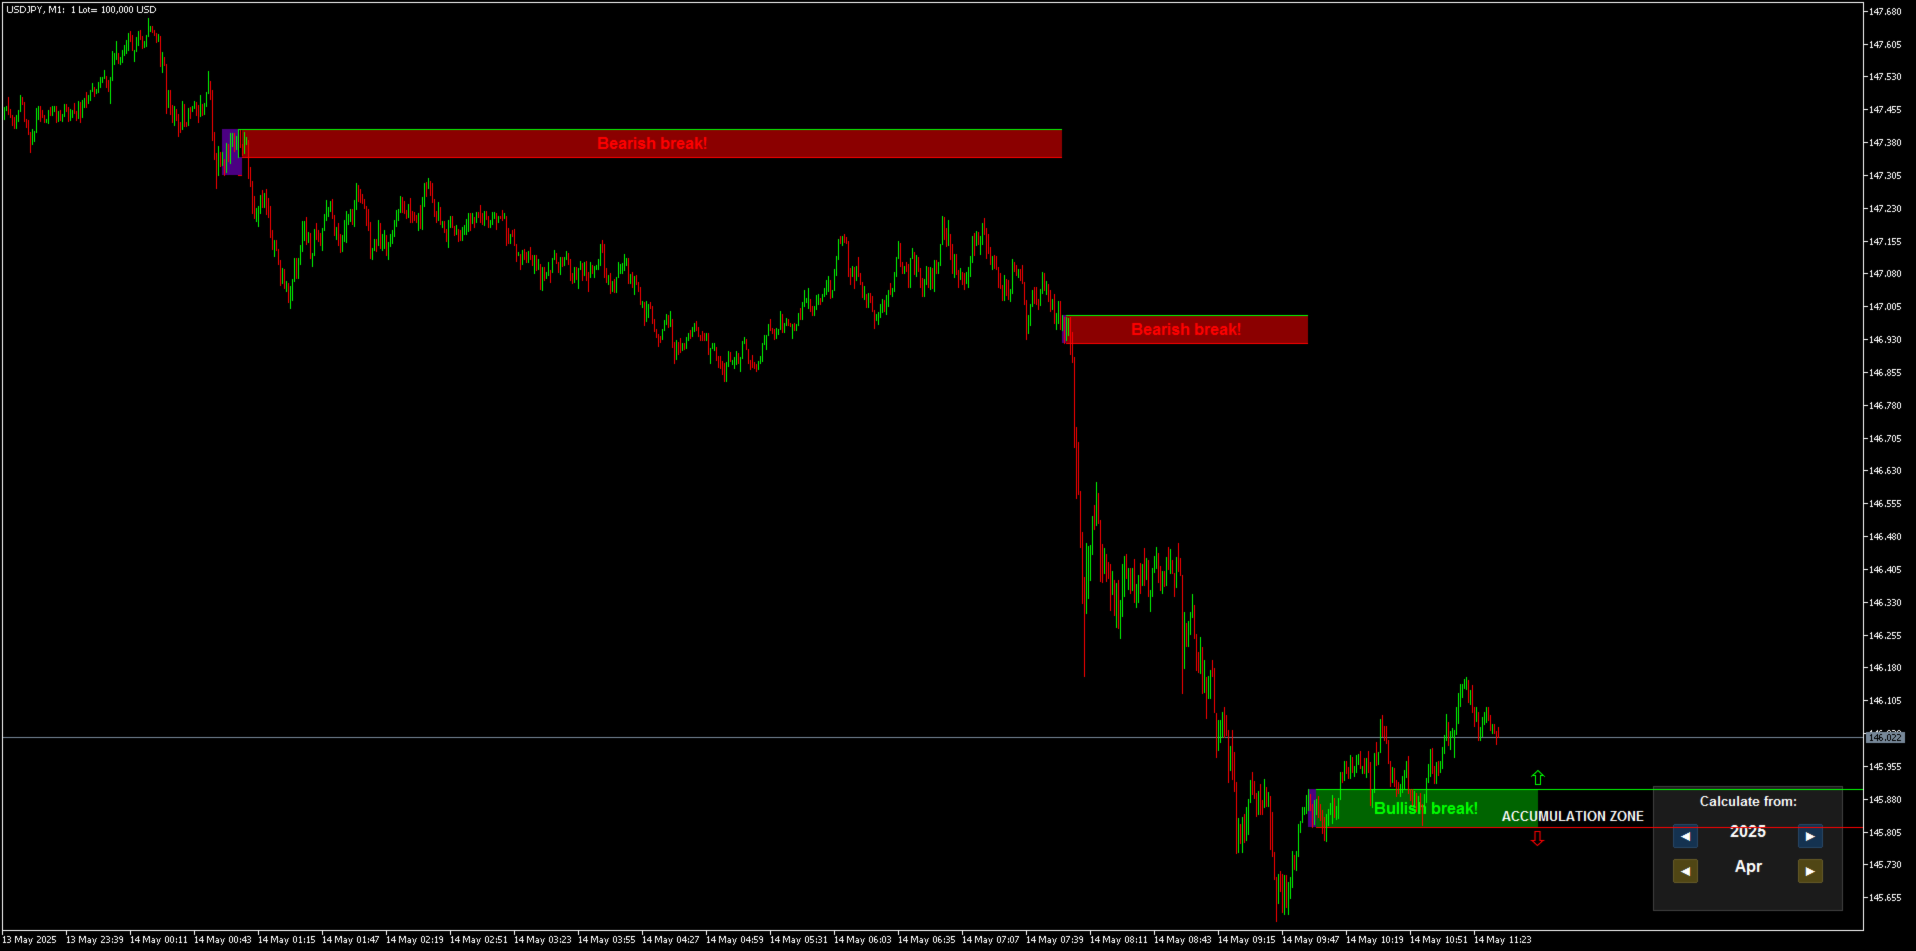
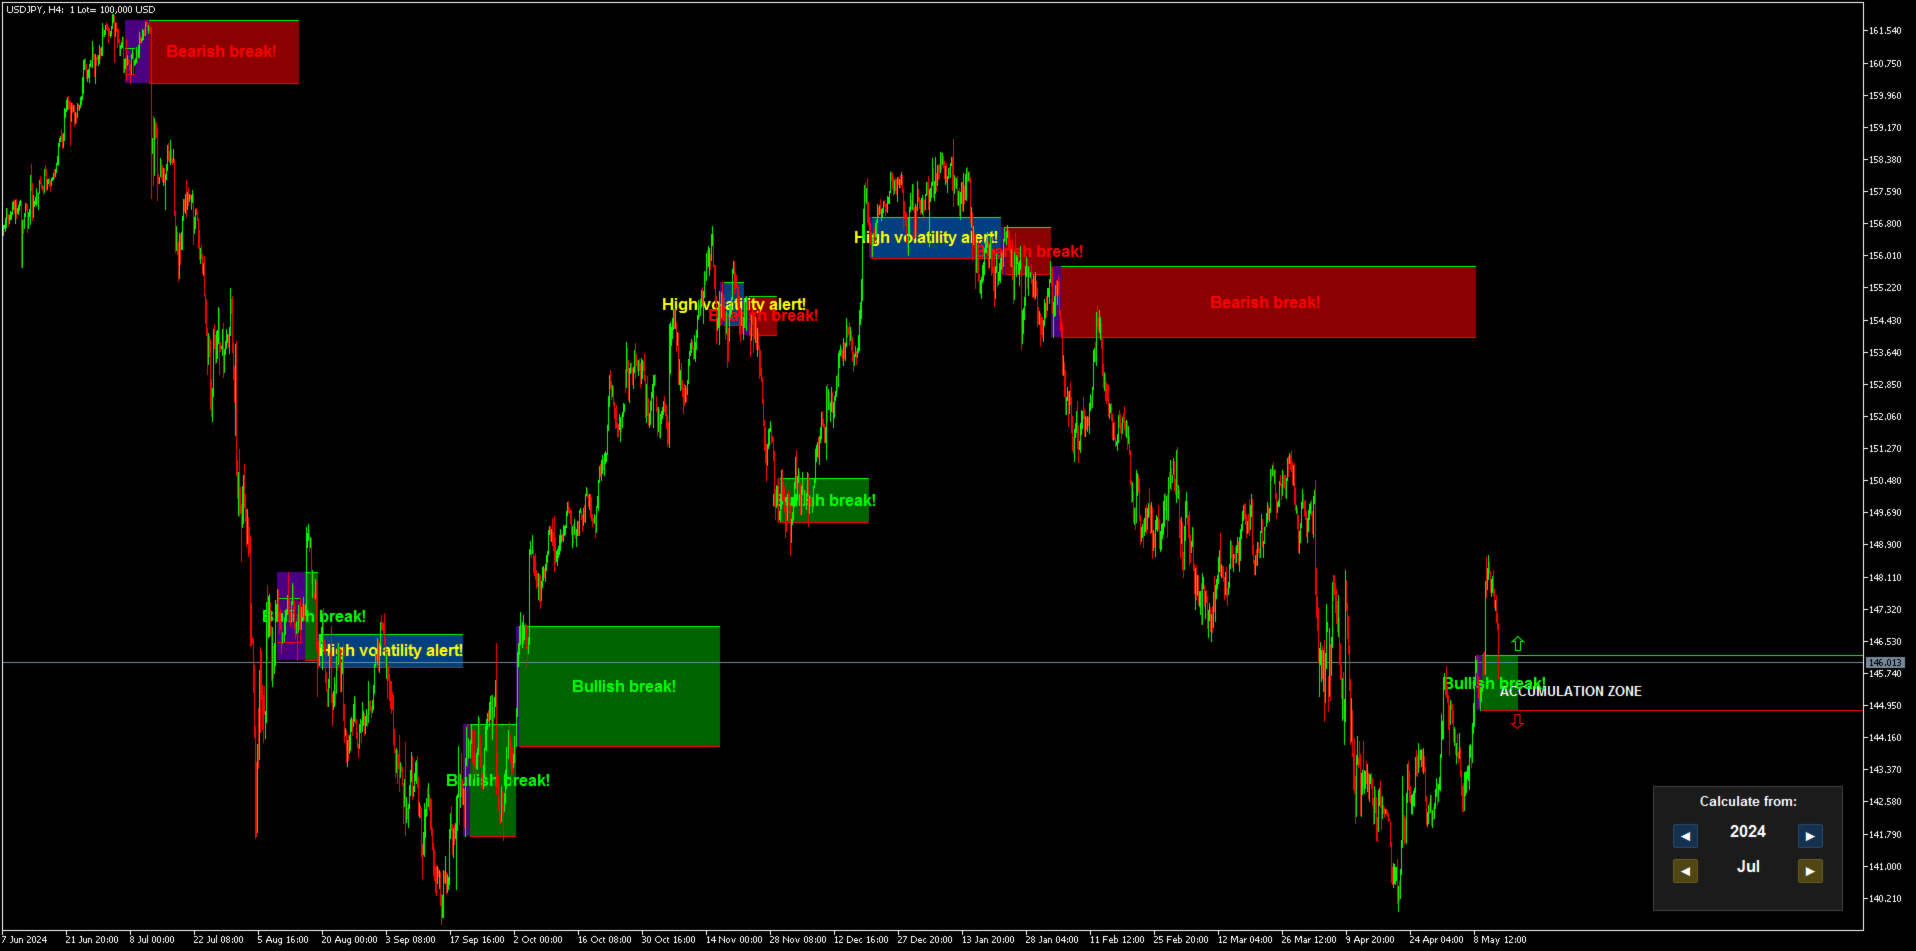
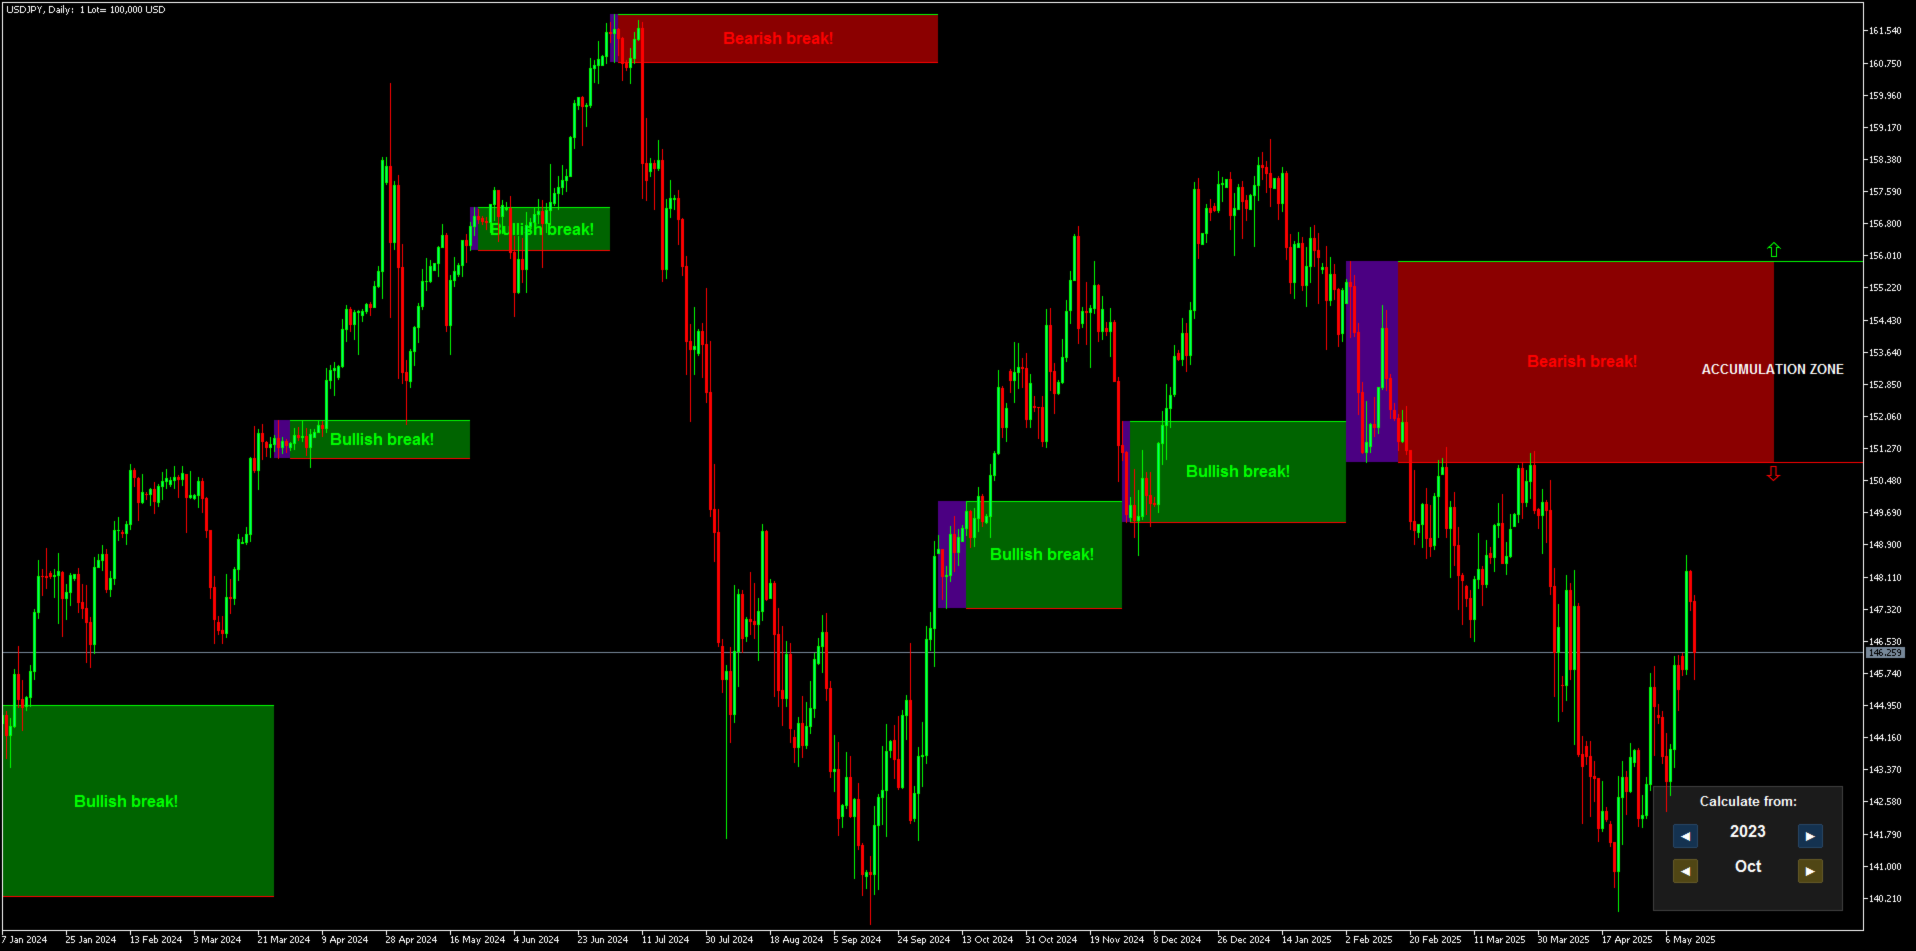
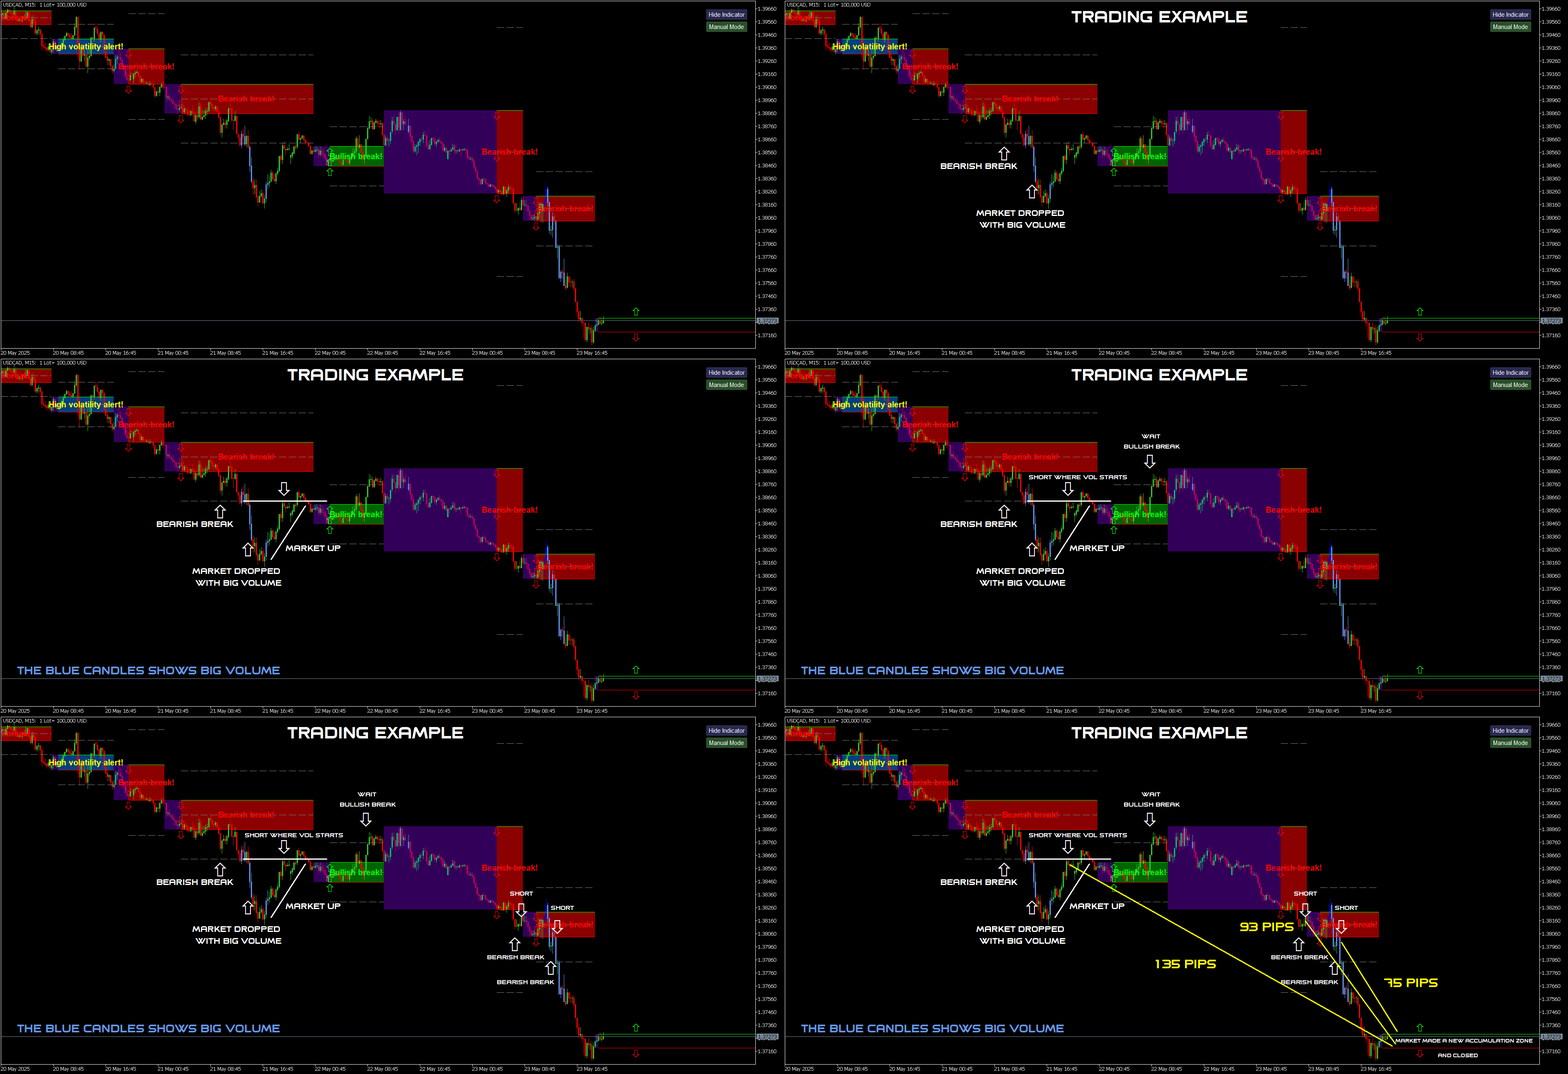
它绘制的内容:区域(矩形) 为了避免图表被线条弄得杂乱,TIMES 将分析浓缩为直接绘制在价格图上的彩色矩形。每个矩形标记由指标内部时间结构生成的重要价值区域——一个活动聚集的价格带,也是市场可能产生反应的地方。

颜色含义:

绿色 / 青绿色矩形 → 多头区域(动能在此累积——作为支撑 / 延续区域)。 红色 / 深红色矩形 → 空头区域(动能在此减弱——作为阻力 / 延续区域)。

区域的行为方式:

确认突破后的颜色翻转——如果价格完全穿过区域的一侧边界并收盘,矩形会切换颜色以反映新的市场状态(被向上突破的空头区域会变成多头区域,反之亦然)。这是一个实时信号,表示市场控制权已发生变化。

自动清理——当价格干净地穿过区域的两侧并收盘后,该区域不再具有意义,矩形会自动删除,使图表保持整洁。

区域来源选择——Rectangle source line 输入允许你选择用于构建矩形的内部结构线(较宽的设置用于主要区域,较窄的设置用于更多、更细的区域)。

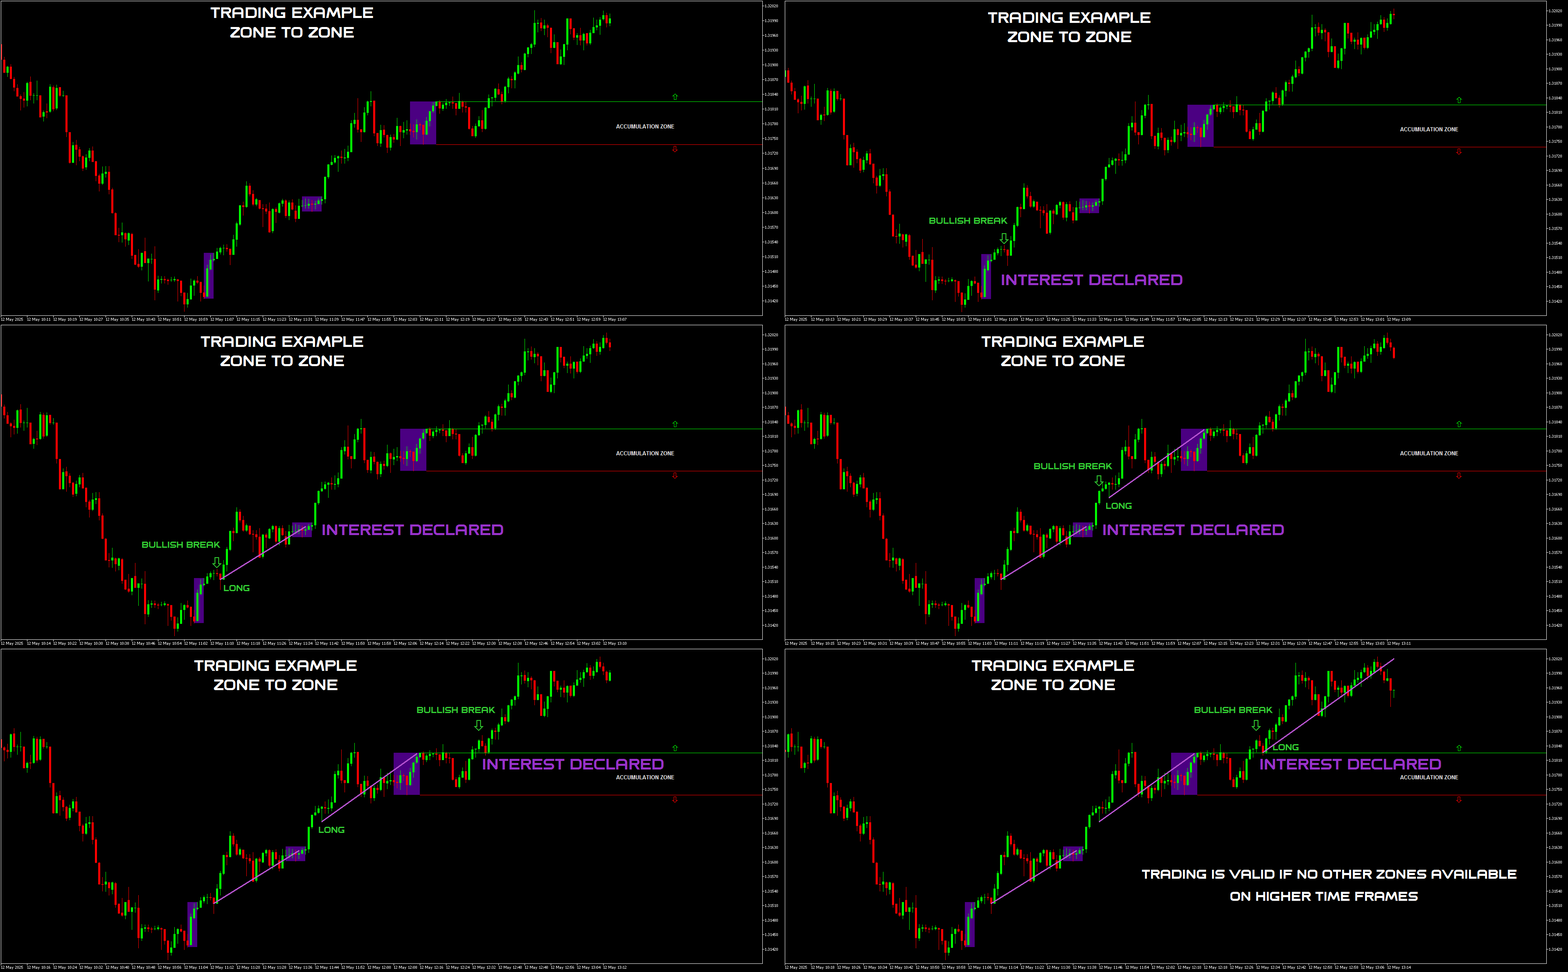
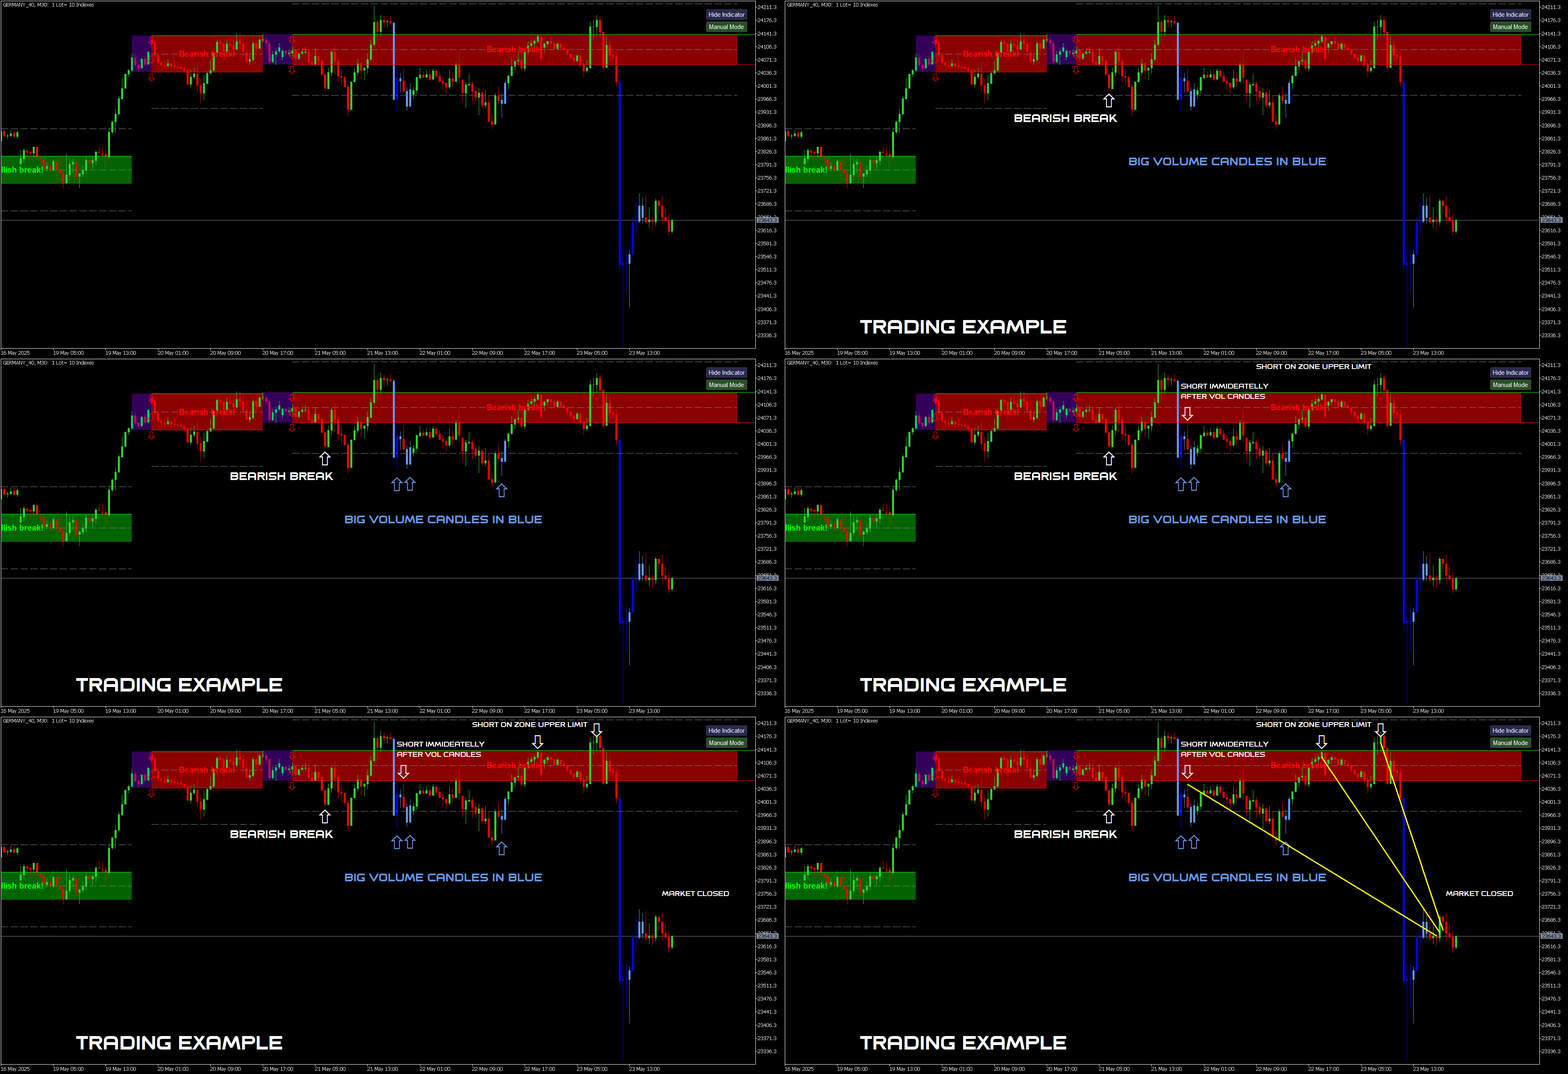
如何交易这些矩形 将一个活跃矩形视为决策区域:观察其边缘的反应(拒绝或支撑)。 颜色翻转 = 区域的确认突破——动能向新颜色的方向发生转移。 未被双向穿透的区域表示市场仍然尊重该区域;消失的区域则已被完全吸收。

额外工具 静止 / 新动能检测器——标记市场进入“盘整”状态,并在新动能爆发的瞬间打印箭头(可选要求价格 + 动能确认)。 RadioPhase 面板——将当前强度分为四个阶段:Null → Step → Lift → Full。 多时间框架 (MTF) 面板——显示最多 21 个时间框架的动能颜色,使你能够将低周期入场与高周期方向对齐。 提醒——关于新动能、新区域以及 MTF 颜色变化的弹窗 / 推送通知。

如何与整套工具一起使用 使用 Meravith 判断方向(价格),使用 TransactionSpeed 判断力度(成交量),使用 TIMES 判断时机和区域——优先选择价格在 TIMES 区域产生反应且方向与价格和成交量工具一致的交易。 根据你的偏好自由组合。
推荐产品
Alpha Trend sign Alpha Trend sign 是我么长期以来非常受欢迎的交易工具,它可以验证我们的交易系统,并且明确的提示交易信号,并且信号不会漂移。 主要功能: •  根据市场显示活跃区域,根据指标可以很直观的判断当前行情是属于趋势行情,还是震荡行情。    并根据指标的指示箭头切入市场,绿色箭头提示买入,红色箭头提示卖出。 •  建议使用5分钟以上的时间周期进行交易,避免因为小周期波动出现频繁的交易信号。 •  您也可以开启信号提示,以免错过最佳的交易时机。 •  本指标不但可以很好的预测趋势行情,也可以在宽幅震荡行情中获利。 •  本指标本着大道至简的原则,适合不同阶段的交易者使用。 注意事项: •  Alpha Trend sign 有明确的进出场信号,不建议逆势操作,以免造成损失。 •  Alpha Trend sign 是特别成熟的指标,我们团队人手一个,使用它可以实现稳定盈利。     


VR Cub
Vladimir Pastushak
VR Cub 这是获得高质量切入点的指标。该指标的开发是为了促进数学计算并简化对仓位入场点的搜索。多年来,该指标所针对的交易策略已被证明其有效性。交易策略的简单性是其巨大的优势,即使是新手交易者也能成功进行交易。 VR Cub 计算开仓点以及获利和止损目标水平,这显着提高了效率和易用性。查看使用以下策略进行交易的屏幕截图,了解简单的交易规则。 设置、设置文件、演示版本、说明、问题解决,可以从以下位置获取 [博客] 您可以在以下位置阅读或撰写评论 [关联] 版本为 [MetaTrader 5] 计算入场点的规则 开仓 要计算入场点,您需要将 VR Cub 工具从最后一个高点拉伸到最后一个低点。 如果第一个点在时间上早于第二个点,交易者等待柱线收于中线上方。 如果第一个点在时间上晚于第二个点,交易者等待柱线收于中线下方。 根据上述条件,严格在 柱线收盘 后建仓。 换句话说,如果我们在小时图上进行交易,那么从最高点到最低点的时间距离必须超过24小时,最高点和最低点之间的点数必须大于或等于平均价格变动每天。 维持和改变市场地位 可以有多个未平仓头寸;每个头寸都可以单独修改。 VR Cub
PZ Harmonacci Patterns
PZ TRADING SLU
3.17 (6)
可以说,这是您可以为MetaTrader平台找到的最完整的谐波价格形成自动识别指标。它检测19种不同的模式,像您一样认真对待斐波那契投影,显示潜在的反转区域(PRZ),并找到合适的止损和获利水平。 [ 安装指南 | 更新指南 | 故障排除 | 常见问题 | 所有产品 ] 它检测19种不同的谐波价格形态 它绘制了主要,衍生和互补的斐波那契投影(PRZ) 它评估过去的价格走势并显示每个过去的形态 该指标分析其自身的质量和性能 它显示合适的止损和获利水平 它使用突破来表明合适的交易 它在图表上绘制所有样式比率 它实现了电子邮件/声音/视觉警报 受斯科特·M·卡尼(Scott M. Carney)的书的启发,该指标旨在满足最纯粹和最熟练的交易者的需求。但是,它采取了一种使交易更容易的方式:在向交易发出信号之前,它会等待Donchian朝正确方向突破,从而使交易信号非常可靠。 斐波那契投影与向量无关 它实现了电子邮件/声音/推送警报 它绘制了ABCD投影 重要提示: 为了符合 Scott M. Carney先生 的商标申诉,某些图案名称已重命名为不言自明的替代方式, Scott M.
Gartley Projection D
Oleksandr Medviediev
3.71 (7)
具有经过验证的概念和盈利能力的最佳、最有效、可靠的产品。感谢您的考虑。  该指标根据H.M.Gartley的发展(《股票市场利润》,1935年)识别和确认谐波模式(XABCD)。 它将D点投影为透视投影中的一个点(在设置中指定ProjectionD_Mode = true)。 不会重绘。当工作时间段的柱形图关闭时,如果已识别的模式点在Patterns_Fractal_Bars柱中未移动,则在图表上出现一个箭头(指向预期价格运动的方向)。从此刻起,箭头将永久保留在图表上。 注意:连续出现2-3个或更多箭头 - 这是市场条件的变化,而不是重绘。 总共有85种模式(包括Gartley-222和Gartley-222WS,完整列表可在评论部分的Google Drive链接中找到)。在所有已识别的模式中,只有最新识别的模式填充了单一颜色。 参数 DrawPatterns(true/false)- 以实心颜色绘制模式 ProjectionD_Mode(true/false)- 定义D点作为透视投影模式 Patterns_Fractal_Bars - 在认定为形成分形的情况下,最新
This is an arrow indicator without a future function,developed based on the most advanced profit trading algorithms.It has the most innovative and advanced dual trend analysis module, as well as the latest and highly effective market trend prediction algorithm.Trends are your friends, and following larger trends can earn the maximum profit in foreign exchange. This indicator helps traders identify current trends and track them. Someone once made a profit of 10 times in a week by relying on it.No
Auto Fibo Pro m
DMITRII GRIDASOV
“Auto FIBO Pro” Crypto_Forex 指标 - 是交易中的绝佳辅助工具! - 指标自动计算并放置在图表斐波那契水平和局部趋势线(红色)上。 - 斐波那契水平指示价格可能反转的关键区域。 - 最重要的水平是 23.6%、38.2%、50% 和 61.8%。 - 您可以将其用于反转剥头皮或区域网格交易。 - 还有很多机会可以使用 Auto FIBO Pro 指标来改进您当前的系统。 - 它具有信息价差掉期显示 - 它显示所连接的外汇对的当前价差和掉期。 - 显示屏还显示账户余额、净值和保证金。 - 可以将信息价差掉期显示定位在图表的任何角落 . 点击这里查看高质量的交易机器人和指标! 这是仅在此 MQL5 网站上提供的原创产品。 ...............................................
Overview Harmonic Patterns MT4 is a technical analysis indicator designed for the MetaTrader 5 platform. It identifies and displays harmonic price patterns, such as Butterfly, Cypher, Crab, Bat, Shark, and Gartley, in both bullish and bearish directions. The indicator calculates key price levels, including entry, stop loss, and three take-profit levels, to assist traders in analyzing market movements. Visual elements and customizable alerts enhance usability on the chart. Features Detects six ha
Forex Gump
Andrey Kozak
2.4 (5)
Forex Gump is a fully finished semi-automatic trading system. In the form of arrows, signals are displayed on the screen for opening and closing deals. All you need is to follow the instructions of the indicator. When the indicator shows a blue arrow, you need to open a buy order. When the indicator shows a red arrow, you need to open a sell order. Close orders when the indicator draws a yellow cross. In order to get the most effective result, we recommend using the timeframes H1, H4, D1. There
The   RSI Divergence + FVG Signal   indicator combines   Relative Strength Index (RSI) Divergence   with   Fair Value Gap (FVG)   detection to generate high-probability buy and sell signals based on both momentum shifts and institutional imbalance zones. Core Features: RSI Divergence Detection : Identifies both regular and hidden bullish/bearish divergences between price and RSI. Divergences indicate potential trend reversals or continuation. FVG Zone Recognition : Detects Fair Value Gaps (imbal
Noize Absorption Index MT4
Ekaterina Saltykova
5 (1)
Noize Absorption Index - is the manual trading system that measures the difference of pressure between bears forces and bulls forces. Green line - is a noize free index that showing curent situation. Zero value of index shows totally choppy/flat market.Values above zero level shows how powerfull bullish wave is and values below zero measures bearish forces.Up arrow appears on bearish market when it's ready to reverse, dn arrow appears on weak bullish market, as a result of reverse expectation. S
PABT Pattern Indicator - it's classical system one of the signal patterns. Indicator logic - the Hi & Lo of the bar is fully within the range of the preceding bar, look to trade them as pullback in trend. In the way if indicator found PABT pattern it's drawing two lines and arrow what showing trend way.  - First line - it's entry point and drawing at: 1. On the high of signal bar or on middle of the signal bar (depending from indicator mode) for buy; 2. On the low of signal bar or on middle of t
Trendiness Index
Libertas LLC
5 (3)
"The trend is your friend" is one of the best known sayings in investing, because capturing large trendy price movements can be extremely profitable. However, trading with the trend is often easier said than done, because many indicators are based on price reversals not trends. These aren't very effective at identifying trendy periods, or predicting whether trends will continue. We developed the Trendiness Index to help address this problem by indicating the strength and direction of price trend
"Impulses and Corrections 4" is created to help traders navigate the market situation. The indicator shows multi-time frame upward and downward "Impulses" of price movements. These impulses are the basis for determining the "Base" , which is composed of zones of corrections of price movements, as well as "Potential" zones for possible scenarios of price movement. Up and down impulses are determined based on a modified formula of Bill Williams' "Fractals" indicator. The last impulse is always "U
RTSPattern
Tomas Belak
The indicator provides a superior alternative to price action analysis. It enables the identification of normalized patterns, which are then transformed into a graphical representation to forecast future steps within a time series. In the top-left corner, you'll find information regarding the expected prediction accuracy, determined through a complex MSQE calculation. You have the flexibility to adjust the time window, making it easy to validate the indicator's performance. Additionally, you can
Trade with Gann on your side!! MASTER CIRCLE 360 CIRCLE CHART, originally created by Gann admitted that this is “The Mother of all charts”. It is one of the last studies that this great trader left for us. The numeric tab le is apparently quite simple like all the tables and is based on square numbers, the SQUARE OF 12 and is by evolution, one of the most important square numbers. Here we can find CYCLE, PRICE AND TIME thanks to angles and grades, to show past and future support and resistance.
Quantum Falcon Signal Free is a smart visual trading indicator for MetaTrader 4 designed for Forex and Gold traders. The indicator combines: • Trend analysis • RSI momentum confirmation • MACD momentum filtering • ATR volatility filtering • Higher timeframe confirmation • Smart exit signal detection Main Features: • Smart Buy and Sell signals • Exit Buy / Exit Sell alerts • Real-time dashboard on chart • Professional candle arrows • Multi-timeframe trend confirmation • ATR market volatility filt
FREE
The Th3Eng PipFinite indicator is based on a very excellent analysis of the right trend direction with perfect custom algorithms. It show the true direction and the best point to start trading. With StopLoss point and Three Take Profit points. Also it show the right pivot of the price and small points to order to replace the dynamic support and resistance channel, Which surrounds the price. And Finally it draws a very helpful Box on the left side on the chart includes (take profits and Stop loss
Trend Ray
Andriy Sydoruk
The indicator shows the potential trend direction by cyclical-wave dependence. Thus, all the rays of the intersection will be optimal rays, in the direction of which the price is expected to move, taking into account the indicator period. Rays can be used as a direction for potential market movement. But we must not forget that the approach must be comprehensive, the indicator signals require additional information to enter the market.
ZhiBiCCI MT4
Qiuyang Zheng
【ZhiBiCCI】指标适合所有的周期使用,也适合所有的市场品种。 【ZhiBiCCI】绿色实线是逆转看涨背离。绿色虚线是经典的看涨背离。 【ZhiBiCCI】向红色实线是反向看跌背离。红色虚线是古典看跌背离。 【ZhiBiCCI】可以在参数里面设置(Alert、Send mail、Send notification),设置为(true)就可以发送即时信号到警报窗口、电子邮件、即时消息。 参数设置说明: 【displayAlert】:这是警报开关,设置成true,如果出现箭头就会自动警报提示;设置成false,则不会警报提示。 【sendmail_NO_OFF】:这是发送邮件的开关,设置成true,如果出现箭头就会发送邮件到你在MT4设置好的邮箱里面;设置成false,则不会发邮件。 【sendnotification_NO_OFF】:这是发送即时消息的开关,设置成true,如果出现箭头就会发送消息到你的移动设备;设置成false,则不会发消息。 更多好用的指标网址: https://www.mql5.com/en/users/zhengqiuyang/seller
Antabod Gamechanger
Rev Anthony Olusegun Aboderin
*Antabod GameChanger Indicator – Transform Your Trading!*   Are you tired of chasing trends too late or second-guessing your trades? The *Antabod GameChanger Indicator* is here to *revolutionize your trading strategy* and give you the edge you need in the markets!   Why Choose GameChanger? *Accurate Trend Detection* – GameChanger identifies trend reversals with *pinpoint accuracy*, ensuring you enter and exit trades at the optimal time.   *Clear Buy & Sell Signals* – No more guesswork! T
The indicator detects and displays М. Gartley's Butterfly pattern. The pattern is plotted by the extreme values of the ZigZag indicator (included in the resources, no need to install). After detecting the pattern, the indicator notifies of that by the pop-up window, a mobile notification and an email. The pattern and wave parameters are displayed on the screenshots. The default parameters are used for demonstration purposes only in order to increase the amount of detected patterns. Parameters z
这是一个预测蜡烛收盘价的指标。 该指标主要用于 D1 图表。 该指标适用于传统外汇交易和二元期权交易。 该指标可以用作独立的交易系统,也可以作为您现有交易系统的补充。 该指标分析当前蜡烛,计算蜡烛本身内部的某些强度因素,以及前一根蜡烛的参数。 因此,该指标预测市场走势的进一步方向和当前蜡烛的收盘价。 由于这种方法,该指标既适用于短期盘中交易,也适用于中长期交易。 该指标允许您设置指标在分析市场情况期间将产生的潜在信号的数量。 在指标设置中有一个特殊的参数。 此外,该指标可以通过图表上的消息、电子邮件以及推送通知的形式通知新信号。感谢您的关注!交易愉快! 购买后一定要写信给我! 我会给你我的交易指标的建议! 还可以获得奖金!
Color Stochastic Enhanced Stochastic Oscillator with Cross Detection and Visual Signal Support Overview Color Stochastic is a customized version of the classic Stochastic Oscillator designed for momentum analysis and crossover visualization. The indicator provides color-based signal marking and configurable crossover detection at user-defined overbought and oversold levels. It can be used as part of: Momentum analysis Mean reversion workflows DCA-based strategies Multi-indicator confirmation sys
FreqoMeterForecast
Stanislav Korotky
The main idea of this indicator is rates analysis and prediction by Fourier transform. Indicator decomposes exchange rates into main harmonics and calculates their product in future. You may use the indicator as a standalone product, but for better prediction accuracy there is another related indicator - FreqoMaster - which uses FreqoMeterForecast as a backend engine and combines several instances of FreqoMeterForecast for different frequency bands. Parameters: iPeriod - number of bars in the ma
QuantumEdge Trader
Hossam Ali Ahmed Ali
QuantumEdge Trader v1.0 AI-Powered Precision Signals for Serious Traders QuantumEdge Trader is a smart and reliable indicator that delivers accurate BUY and SELL signals using advanced market analysis and trend detection. Designed for M1 to M60 timeframes, it's ideal for scalping and intraday strategies. --- Key Features: No Repaint – Signals never change after appearing Smart trend filters to reduce noise Adjustable sensitivity and alerts Perfect for XAUUSD, EURUSD, and m
Chart Patterns Detect 15 patterns (Ascending Triangle, Descending Triangle, Rising Wedge, Falling Wedge, Bullish Flag, Bearish Flag, Bullish Rectangle, Bearish Rectangle Symmetrical triangle, Head and Shoulders, Inverted Head and Shoulders, Triple top, Triple Bottom, Double Top, Double Bottom) Use historical data to calculate the probability of each pattern to succeed (possibility to filter notification according to the chance of success) gives graphic indication about the invalidation level and
Price Magnets
Ivan Simonika
Price Magnet — Price Density and Attraction Levels Indicator Price Magnet is a professional analytical tool designed to identify key support and resistance levels based on statistical Price Density. The indicator analyzes a specified historical period and detects price levels where the market spent the most time. These zones act as “magnets,” attracting price action or forming a structural base for potential reversals. Unlike traditional Volume Profile tools, Price Magnet focuses on price-time d
RSI Speed mp
DMITRII GRIDASOV
Crypto_Forex MT4 指标“ RSI SPEED ”——卓越的预测工具,无需重绘。 - 该指标基于物理方程计算。RSI SPEED 是 RSI 本身的一阶导数。 - RSI SPEED 非常适合顺着主趋势方向进行剥头皮交易。 - 建议结合合适的趋势指标使用,例如 HTF MA(如图所示)。 - RSI SPEED 指标显示 RSI 本身方向变化的速度——它非常敏感。 - 建议将 RSI SPEED 指标用于动量交易策略:如果 RSI SPEED 指标的值小于 0:价格动量下降;如果 RSI SPEED 指标的值大于 0:价格动量上升。 - 指标内置移动端和 PC 端警报。 ................................................... 点击这里查看高质量的交易机器人和指标! 这是仅在 MQL5 网站上提供的原创产品。
Infinity Trend Pro
Yaroslav Varankin
1 (1)
This is a trend indicator without redrawing Developed instead of the binary options strategy (by the color of the Martingale candlestick) Also works well in forex trading When to open trades (binary options) A signal will appear in the place with a candle signaling the current candle It is recommended to open a deal for one candle of the current timeframe M1 and M5 When a blue dot appears, open a deal up When a red dot appears, open a trade down. How to open trades on Forex. When a signal is rec
Signal From Level
Yaroslav Varankin
Binary Options Support Resistance Indicator This indicator is designed for binary options trading and effectively shows retracements from support and resistance levels. Signals appear on the current candle. A red arrow pointing downwards indicates a potential selling opportunity, while a blue arrow pointing upwards suggests buying opportunities. All that needs adjustment is the color of the signal arrows. It is recommended to use it on the M1-M5 timeframes as signals are frequent on these timef
该产品的买家也购买
Miraculous Indicator Binary & Forex v3 StrategySafe Miraculous Indicator Binary & Forex v3 StrategySafe 是一款专业交易指标,适合希望获得清晰信号、强大确认工具以及结构化交易方式的 Binary 和 Forex 交易者。 v3 版本加入了 MIR Dashboard、Miraculous Confirmation Dashboard、GANN Law、Square of 9 水平线、GANN 角度以及更强的 Forex 分析模式。 核心功能 同时支持 Binary 和 Forex 交易模式。 MIR Dashboard 可快速读取市场状态。 Miraculous Confirmation Dashboard 用于确认交易机会。 GANN Law drawing lines 用于 Forex 市场结构分析。 Square of 9 线条、方向和关键价格水平。 1x1 GANN Angle 用于判断趋势压力。 Entry Information TP 帮助寻找合理止盈区域。 Strateg
Miraculous 指标 – 100% 不重绘的外汇和二元期权工具,基于江恩九方图 这个视频介绍的 Miraculous 指标 是一款专为外汇和二元期权交易者开发的高精度、强大交易工具。该指标的独特之处在于它建立在传奇的 江恩九方图 和 江恩振动法则 之上,使其成为现代交易中可用的最精确预测工具之一。 Miraculous 指标 完全不重绘 ,这意味着它的信号在 K 线收盘后不会改变或消失——你看到的就是你得到的。这为交易者提供了可靠且一致的基础,让他们能够自信地进出场交易。 主要特点: 基于江恩九方图和江恩理论构建 100% 不重绘的信号系统 适用于所有时间周期(M1、M5、H1、H4、日线、周线) 适用于外汇和二元期权交易 清晰的买卖信号,准确率高 可用于剥头皮、日内交易或波段交易 兼容大多数 MT4 平台 这款工具旨在帮助初学者和专业交易者做出更好、更明智的决策。无论您是交易货币、指数还是二元期权,Miraculous 指标都将为您在市场中提供所需的优势。
ORB Seeker
Marcela Goncalves De Oliveira
4 (1)
特价促销,限量供应,保持产品稀缺性! 仅售 599 美元! 购买后请联系我以获取奖励的 ORB Seeker EA 和个人优化设置文件。 自信地捕捉干净利落的比赛片段! ORB Seeker 是一款专业的开盘区间突破 (ORB) 指标,专为追求准确性、简洁性、灵活性和清晰图表结构的交易者而设计。 它能自动绘制任何交易品种的盘前或自定义交易时段区间,然后给出清晰的突破信号,包括入场点、止损点、止盈点以及可选的50%部分止盈位。所有数据均实时计算并直接显示在图表上。 您可以选择交易伦敦开盘、纽约交易时段、亚洲交易时段,或者您自定义的交易时段。ORB Seeker 会根据您选择的交易时段自动调整,让您精准掌握市场波动范围、突破位和交易位的位置。 每次购买均免费赠送 ORB Seeker EA 智能交易系统。该 EA 系统读取指标的突破信号并可自动下单,您可以选择手动交易,也可以让 EA 系统根据指标的信号逻辑自动处理入场。   为什么选择 ORB Seeker 支持多个交易时段 - 您可以自行设置伦敦、纽约、亚洲或自定义交易时段的盘前交易时间和交易时段。 完整的突破视觉效果 - 交易最高
TrendMaestro
Stefano Frisetti
4 (4)
Attention: beware of SCAMS, TRENDMAESTRO is only ditributed throught MQL5.com market place. note: this indicator is for METATRADER4, if you want the version for METATRADER5 this is the link:  https://www.mql5.com/it/market/product/108106 TRENDMAESTRO ver 2.5 TRENDMAESTRO recognizes a new TREND from the start, he never makes mistakes. The certainty of identifying a new TREND is priceless. DESCRIPTION TRENDMAESTRO identifies a new TREND in the bud, this indicator examines the volatility, volumes a
FFx Engulfing Setup Alerter gives trade suggestions with Entry, Target 1, Target 2 and StopLoss. Below are the different options available: Entry suggestion - pips to be added over the break for the entry 3 different options to calculate the SL - by pips, by ATR multiplier or at the pattern High/Low 3 different options to calculate the 2 TPs - by pips, by ATR multiplier or at Risk/Reward Offset the dashboard - any place on the chart Remove the suggestion once the price reached the SL line Lines
FFx InsideBar Setup Alerter gives trade suggestions with Entry, Target 1, Target 2 and StopLoss. Below are the different options available: Entry suggestion - pips to be added over the break for the entry Minimum candle size - to avoid too close buy/sell entry suggestions 3 different options to calculate the SL - by pips, by ATR multiplier or at the pattern High/Low 3 different options to calculate the 2 TPs - by pips, by ATR multiplier or at Risk/Reward Offset the dashboard - any place on the c
FFx OutsideBar Setup Alerter gives trade suggestions with Entry, Target 1, Target 2 and StopLoss. Below are the different options available: Entry suggestion - pips to be added over the break for the entry. 3 different options to calculate the SL - by pips, by ATR multiplier or at the pattern High/Low. 3 different options to calculate the 2 TPs - by pips, by ATR multiplier or at Risk/Reward. Offset the dashboard - any place on the chart. Remove the suggestion once the price reached the SL line.
FFx PinBar Setup Alerter gives trade suggestions with Entry, Target 1, Target 2 and StopLoss. Below are the different options available: Entry suggestion - pips to be added over the break for the entry Minimum candle size - to avoid too small candles 3 different options to calculate the SL - by pips, by ATR multiplier or at the pattern High/Low 3 different options to calculate the 2 TPs - by pips, by ATR multiplier or at Risk/Reward Offset the dashboard - any place on the chart Remove the sugges
Lineverse Trendlines
Arkady Segal
5 (1)
Automatic, live & interactive picture of all trendlines. Assign push, email and sound alerts to the lines of your choice and be informed about price rollback, breakout, rollback after breakout, number of rollbacks, line expiration by double breakout. Correct, drag or delete the lines and interactively tune the line system. https://youtu.be/EJUo9pYiHFA . Chart examples https: //www.mql5.com/en/users/efficientforex Price Interaction Events All events are effective immediately and only after one
FFx MACD Divergences
Eric Venturi-Bloxs
The purpose of this new version of the MT4 standard indicator provided in your platform is to display in a sub-window multiple timeframes of the same indicator with its divergences. See the example shown in the picture below. But the display isn't like a simple MTF indicator. This is the real display of the indicator on its timeframe. Here's the options available in the FFx divergences indicator: Select the timeframes to be displayed (M1 to Monthly) Define the width (number of bars) for each tim
FFx RSI Divergences
Eric Venturi-Bloxs
The purpose of this new version of the MT4 standard indicator provided in your platform is to display in a sub-window multiple timeframes of the same indicator with its divergences. See the example shown in the picture below. But the display isn't like a simple MTF indicator. This is the real display of the indicator on its timeframe. Here's the options available in the FFx divergences indicator: Select the timeframes to be displayed (M1 to Monthly) Define the width (number of bars) for each tim
FFx CCI Divergences
Eric Venturi-Bloxs
The purpose of this new version of the MT4 standard indicator provided in your platform is to display in a sub-window multiple timeframes of the same indicator with its divergences. See the example shown in the picture below. But the display isn't like a simple MTF indicator. This is the real display of the indicator on its timeframe. Here's the options available in the FFx divergences indicator: Select the timeframes to be displayed (M1 to Monthly). Define the width (number of bars) for each ti
The FFx Dashboard MTF alerter will show you on a single chart all the timeframes (M1 to Monthly) with their own status for the indicator. 2 Alert Options: Single timeframe: each selected timeframe alert separately when a signal occurs Multi timeframes: all selected timeframes must agree for an alert to be triggered Both options have an input to select the timeframes to be used for the alert(s). How to Understand the Status: Green/Red square: histogram above/below 0 line Green square + Red bord
The FFx Dashboard MTF alerter will show you on a single chart all the timeframes (M1 to Monthly) with their own status for the indicator. 2 Alert Options: Single timeframe: each selected timeframe alert separately when a signal occurs Multi timeframes: all selected timeframes must agree for an alert to be triggered Both options have an input to select the timeframes to be used for the alert(s). How to understand the status: Green/Red square: RSI above/below 50 line Green square + Red border: R
The FFx Dashboard MTF alerter will show you on a single chart all the timeframes (M1 to Monthly) with their own status for the indicator. 2 Alert Options: Single timeframe: each selected timeframe alert separately when a signal occurs Multi timeframes: all selected timeframes must agree for an alert to be triggered Both options have an input to select the timeframes to be used for the alert(s). How to understand the status: Green/Red square: Stoch above/below 50 line Green square + Red border:
The FFx Dashboard MTF alerter will show you on a single chart all the timeframes (M1 to Monthly) with their own status for the indicator. 2 Alert Options: Single timeframe: each selected timeframe alert separately when a signal occurs Multi timeframes: all selected timeframes must agree for an alert to be triggered Both options have an input to select the timeframes to be used for the alert(s). How to understand the status: Green/Red square: Price above/below Cloud (Kumo) Green square + Red bo
The FFx Dashboard MTF alerter will show you on a single chart all the timeframes (M1 to Monthly) with their own status for the indicator. 2 Alert Options: Single timeframe: each selected timeframe alert separately when a signal occurs Multi timeframes: all selected timeframes must agree for an alert to be triggered Both options have an input to select the timeframes to be used for the alert(s). How to understand the status: Green/Red square: MA pointing Up/Down Green square + Red border: MA po
The FFx Dashboard MTF alerter will show you on a single chart all the timeframes (M1 to Monthly) with their own status for the indicator. 2 Alert Options: Single timeframe: each selected timeframe alert separately when a signal occurs. Multi timeframes: all selected timeframes must agree for an alert to be triggered. Both options have an input to select the timeframes to be used for the alert(s). How to understand the status: Green square: Price above PSAR Red square: Price below PSAR Options
The FFx Dashboard MTF alerter will show you on a single chart all the timeframes (M1 to Monthly) with their own status for the indicator. 2 Alert Options: Single timeframe: each selected timeframe alert separately when a signal occurs Multi timeframes: all selected timeframes must agree for an alert to be triggered Both options have an input to select the timeframes to be used for the alert(s). How to understand the status: Green/Red square: CCI above/below levels (ie. 100/-100) Grey square: C
The FFx Dashboard MTF alerter will show you on a single chart all the timeframes (M1 to Monthly) with their own status for the indicator. 2 Alert Options: Single timeframe: each selected timeframe alert separately when a signal occurs Multi timeframes: all selected timeframes must agree for an alert to be triggered Both options have an input to select the timeframes to be used for the alert(s). How to understand the status: Green/Red square: ADX above level Grey square: ADX below level Red bor
The FFx Dashboard MTF alerter will show you on a single chart all the timeframes (M1 to Monthly) with their own status. 2 Alert Options: Single timeframe: each selected timeframe alert separately when a signal occurs Multi timeframes: all selected timeframes must agree for an alert to be triggered Both options have an input to select the timeframes to be used for the alert(s). How to understand the status: Green/Red square: bullish/bearish candle Options available in the FFx Dashboard Alerter
The indicator of a Professional Trader is an arrow indicator for predicting the direction of price movement. I have been working on this indicator since 2014. You can use this indicator as your main indicator, use its entry signals, and use it as your only indicator to find entry points. About the product: Recommended TF [H4-D1-W1]   . The indicator predicts the direction of the next candle. Fits a variety of tools; Flexibility in settings for different instruments and intervals through the MO
THE GRAFF III
Charles Harper
The [GRAFF] III manual trading system is based on multiple MetaTrader (MT4) indicators. Together, the entire PACK of GRAFF III indicators makes an advanced trading tool. The system consists of over 20 different custom-built indicators which have been carefully selected and tested in the long term to produce strong and efficient trading signals. The particular indicators are based on different mathematical formulas, so the entire system is calibrated to remove false signals from its own indicator
This indicator allows you to see the strength of the trend on all timeframes. It can be used for all currency pairs. The indicator can be displayed in the form of a column (from left to right): status buy / sell / strong buy / strong sell, strength of the trend in percentage, pips last candle, body candle now, remaining time, and the timeframe of M1 to MN. Information contained below (from left to right): total trend percent, sell percent, buy percent.
FFx Universal Strength Meter PRO is more than a basic strength meter. Instead of limiting the calculation to price, it can be based on any of the 19 integrated strength modes + 9 timeframes. With the FFx USM, you are able to define any period for any combination of timeframes. For example, you can set the dashboard for the last 10 candles for M15-H1-H4… Full flexibility! Very easy to interpret... It gives a great idea about which currency is weak and which is strong, so you can find the best pai
A simplistic indicator informing a user on RSI divergence by sending messages to mobile device and email. The indicator draws 2 vertical lines, marking two RSI extrema that formed the divergence. You get the alert, open the charts and make a decision. The indicator does not show past divergences, thus when you attach it to a chart for the first time you see nothing. Graphics and alerts will appear as soon as divergences do. Drop it in Tester to see how it works. Parameters: RSIPeriod - number of
ZLevels
Sergio Andres Zuleta Lopez
This indicator is based on Market Profile methodology, which contains the Z-Zone , unlike the latter, allows visualization of multiple time frames on the same graph. This methodology has proven to be very effective for: Reduce the number of windows required to analyze or track a financial asset. Display important resistance areas (ROZ), support (SoZ) and average distribution (PoC) in different periods of time. Define areas to take profits as well locate technical stop loss. Analysis in the devel
Pan PrizMA CD Phase is an analogue of the МetaТrader 5 indicator , and is an option based on the Pan PrizMA indicator. Details . Averaging by a quadric-quartic polynomial increases the smoothness of lines, adds momentum and rhythm. Extrapolation by the sinusoid function near a constant allows adjusting the delay or lead of signals. The value of the phase - wave status parameter (which is close in meaning to the trigonometric phase or the angle of the radius-vector rotation in the trigonometric p
作者的更多信息
Primes Action
Ivan Stefanov
Primes Action 在图表上绘制前一日、前一周和前一月的高点和低点,并在价格突破这些位置时给出提示。每个周期使用各自的颜色,三条参考线一目了然。 水平线如何确定 一个周期的精确高点或低点往往只是一根短促的尖刺。Primes Action 取前一个已完成周期的上八分之一和下八分之一区间,在每个区间内绘制价格停留时间最长的位置。计算使用一分钟数据,而不是您当前图表的K线。因此,日线、周线和月线的水平线在 M5、H1 或 H4 上完全相同。 每一天在纽约收盘时结束,即纽约时间 17:00。美国夏令时自动处理。一周从纽约时间周日 17:00 到周五 17:00。因此,这些水平线不依赖于经纪商服务器的时区。 突破线 W. D. Gann 描述过 lost motion:价格可以稍微越过一个水平位而并未真正突破它。Primes Action 在每条水平线之外绘制一条突破线,距离为高低两条水平线之间区间的八分之一。只有当前 Bid 价格越过这条线时,才标记为多头或空头突破。箭头标出发生突破的那根K线。水平线与其突破线之间的区域会被填色。 面板 面板显示三个周期各自的状态:中性、多头或
Currency Strength Anchor —— 会话自适应的相对强度指标,以日开盘、周开盘和月开盘为锚点。无重绘。 大多数强度指标在固定回溯期内比较不同品种。但随着交易日从一个交易时段进入下一个时段,这种比较的意义会发生变化:基于亚洲时段数据的排名在伦敦和纽约开盘后几乎没有参考价值。 Currency Strength Anchor 采用不同的参考方式。它将每个品种与三个固定锚点进行比较——日开盘、周开盘和月开盘——并根据你所处的交易时段自动调整计算范围。 上下文会自动在以下范围之间切换: 仅亚洲时段 亚洲 + 欧洲时段 亚洲 + 欧洲 + 美洲时段 仅美洲时段 所有数值均基于已完成的价格数据计算,不会重绘。 如何阅读 指标为图表上的每个组成部分绘制一条线,因此你始终是在比较两条线。 示例 1 —— 黄金。你会看到两条线,一条代表 XAU,一条代表 USD。如果 XAU 线高于 USD 线,说明黄金强于美元,你应寻找做多 XAUUSD 的机会。 示例 2 —— EURUSD。如果 EUR 线低于 USD 线,说明欧元弱于美元,你应寻找做空 EURUSD 的机会。 规则对所有品
Transaction Speed MT5
Ivan Stefanov
5 (4)
当然,以下是翻译成中文(简体)的版本: 该指标标出市场中显现出 交易兴趣 的区域,并随后显示 订单积累区域 。它的工作方式类似于大规模的订单簿。 这是为 大资金 打造的指标,性能卓越。市场中有任何兴趣,你都能通过它清晰看到。 (这是一个 完全重写的自动化版本 —— 不再需要手动分析。) 交易速度 是一个全新的概念指标,它显示了市场上大订单 何时 、 何地 聚集,并揭示了其背后的意义。它可以在 非常早期 就检测到趋势的变化。 在外汇市场,所谓的“交易量”实际上是误导性的,因为那指的是价格在单位时间内的变化,因此真正的名称应是“交易速度”。 一切都取决于我们如何思考、如何行动、如何分析。 改变分析范式至关重要。 该指标完全重构了外汇市场上“交易量”的概念,用逻辑方式重新定义并应用,从而成为一个 独特而精准的工具 。 使用方法: 默认情况下,指标处于 自动模式 ,可独立用于任何时间周期。如果你希望切换到手动模式,只需点击 Auto / Manual Mode 按钮即可。 在 手动模式 下,所有计算从 2025年1月1日 开始。你可以根据需要更改该日期,以查看不同的分析结果。 最优数据周期
Fibowave
Ivan Stefanov
FIBOWAVE 在七个时间周期上同时自动完成艾略特波浪计数,从月线图一直到 M5,并给出运行中调整浪的斐波那契回撤、第3浪、第5浪和C浪的斐波那契目标、计数失效的价位,以及第3浪或第5浪开始时的提醒。 手工数浪速度很慢,而且两位分析师很少能得出相同的计数。FIBOWAVE 按固定规则计数,每次的方式都相同,并把各浪、它们的子浪以及子浪的子浪标注在您的图表上。 计数从哪里开始 您不需要选择起点,也不需要设置任何参数。本指标从月线图开始逐级向下寻找市场最近一次显示出新一轮走势开端的位置,并从该位置开始计数。 在起始阶段,一段走势既可能是新趋势的第1浪,也可能是旧趋势的第2浪,在价格再次运行之前没有人能够确定。FIBOWAVE 会如实说明这一点:标签显示为 "1/2?",状态行会告诉您每种情况分别需要发生什么。一旦价格给出答案,标签就变为第1浪或第2浪,计数由此继续。若某段走势最终被确认为B浪,同样会重新标注。 高时间周期上尚未确定的浪不会中断分析。较低的时间周期会继续对该走势计数,状态行会说明它们采用的是哪一种解读。 从月线图逐级向下 每个时间周期的计数都一直延伸到最后一
GANN Master 为当前的日、周或月绘制江恩(W. D. Gann)平方根水平,并标出买方与卖方目标相遇的区域。水平由上一周期的最高价和最低价计算,在整个周期内保持不变,不会重画。 水平如何构建 上一周期的最高价成为 TOP 线,其最低价成为 BOTTOM 线。指标从 TOP 向下量出三个看跌目标(Bears' interest 1、2 和 3),从 BOTTOM 向上量出三个看涨目标(Bulls' interest 1、2 和 3),使用江恩的平方根步长 1/8、2/8 和 3/8。 江恩计算始终需要一个比例。GANN Master 会自行选择:它尝试每一个比例,并保留使看涨线与看跌线彼此最接近的那一个。当一条看跌线与一条看涨线相互靠近时,双方的利益就在此相遇。指标把这些位置着色为共同利益区域。每个周期最多绘制五个区域。 每个区域周围有两条虚线的区域突破线,位于该区域上方和下方,距离为 TOP-BOTTOM 区间的 1/8。TOP 和 BOTTOM 周围也有一条同样大小的着色带。 图表上显示的内容 TOP 与 BOTTOM、六条江恩线及其名称,显示在当前K线的右侧 当前日、周或
Meravith Scanner
Ivan Stefanov
5 (3)
MERAVITH SCANNER 是一款适用于 MetaTrader 5 的专业金融市场指标,将多种分析工具整合为一个统一的系统。它基于专有的成交量加权平均价格(VWAP)方法自动完成所有计算,完全消除主观判断。 该指标适用于所有资产类别(外汇、股票、指数、大宗商品、加密货币)以及从 M1 到 Monthly 的所有时间周期。其核心原理是价格跟随成交量。MERAVITH 识别机构资金成交量的集中区域,并从该集中区域中推导出数学上精确的价格水平。它不预测,不推测。它只计算。 使用 MERAVITH SCANNER,您可以在 2–3 分钟内扫描全部 28 个主要外汇货币对的所有时间周期。您也可以扫描任何您选择的市场——例如,大约 100 只股票约需 10 分钟。 该指标计算耗尽水平、平衡线、偏差、统计水平以及目标投射。 图表元素 Origin Point 标记所有计算的起始位置。指标会自动将其放置在最佳位置。红色标签(TOP)表示市场高点并带有看跌倾向。绿色标签(BOTTOM)表示市场低点并带有看涨倾向。 Sentiment Line 是一条动态曲线,反映基于成交量加权计算得出的市场情绪。
KAMA Confluence Engine
Ivan Stefanov
5 (2)
KAMA Confluence Engine 顺势交易——在趋势反转的那一刻立即知道你的入场、止损和目标位。 KAMA Confluence Engine 是一款基于考夫曼自适应移动平均线(KAMA)的全能趋势指标,并结合了成交量加权、多周期共振确认以及自动交易水平。它会根据市场环境自动调整:在趋势行情中快速敏捷,在震荡行情中平稳过滤噪音——让你始终站在正确的一侧。 它的独特之处 成交量加权自适应引擎 ——当真实的成交量进入市场时,KAMA 线会加速;当成交量减弱时,它会放缓,让你留在强势行情中,避开假突破。 醒目的霓虹趋势带 ——亮丽、流畅的线条,底部带有深色阴影。绿色 = 上升趋势,红色 = 下降趋势,灰色 = 横盘/无交易。趋势一眼即可识别,即使远距离也清晰可见。 趋势颜色蜡烛图 ——蜡烛本身会根据趋势着色,让整个图表呈现统一的趋势故事。 自动 Entry / SL / TP 水平(新功能) 当新趋势出现时,指标会自动在图表上绘制可直接使用的交易水平: 入场线位于信号价格 止损由 ATR 计算(根据品种波动性自动调整) TP1 / TP2 / TP3 按你设定的风险回报比(默认
Order Block Scorecard 在您的图表上标记供给区与需求区,并为每一个区域记录来自您自己历史数据的三项数值:价格进入该区域的次数、其中有多少次被守住,以及此后价格走出的最远距离。 这三个数字描述的是您眼前这个品种与周期上已经发生的事情。它是过去行为的记录,不是预测。 区域规则 只有一条规则,完整写出,您可以在任何一根K线上用肉眼验证: 供给区 - 下跌前的最后一根阳线,且该下跌在允许的K线数量内走完所需距离 需求区 - 上涨前的最后一根阴线,条件相同 区域就是这根K线,取整根或仅取实体,由您选择。没有隐藏过滤,没有平滑处理。 每个区域的记录 从区域生成的那一刻起,指标沿历史向前推演并记录发生了什么: 测试次数 - 价格进入该区域的次数 守住次数 - 其中有多少次之后出现了足够大的离开走势 最佳 - 触及后价格从区域边界走出的最远距离 当一个区域结束时它会变灰:或者因为有K线收盘穿过了它的远端边界,或者因为它已被测试到您允许的次数上限。结束的区域仍留在图表上,因为失效的区域同样是记录的一部分。 大幅走势上的箭头 当一次触及之后出现了超过您设定阈值的走势,会从区域边界画出一
FREE
MACD divergency
Ivan Stefanov
4.7 (10)
该指标准确地识别出价格走势与MACD柱状图之间的牛市和熊市背离,使用的指数移动平均线(EMA)周期为5(快速),34(慢速),信号线周期为5。该指标突出显示了动能减弱的点,提示可能的趋势反转。 正确识别背离的规则: 当价格形成更低的低点,而MACD柱状图同时在零线之上形成更高的低点时,牛市背离有效。 当价格形成更高的高点,而MACD柱状图同时在零线以下形成更低的高点时,熊市背离有效。 如果柱状图的极值和价格的极值没有位于零线的同一侧,则背离信号无效,因为这可能导致假信号。 这种方法代表了应用MACD背离分析最准确和可靠的方法。 指标特点: 清晰地标记已确认的牛市和熊市背离。 严格遵守MACD背离验证规则,提高可靠性。 其他信息:该指标作为MetaTrader 5的EX5编译文件提供。它不需要外部库或DLL文件。建议交易者将此工具与整体交易策略一起使用。在进行真实交易前,请务必在模拟账户中充分测试。该指标不保证盈利,仅作为帮助识别真实MACD背离的分析工具。
FREE
Ichimoku Nexus Pro
Ivan Stefanov
5 (1)
Ichimoku Nexus Pro 一目均衡表,将细田悟一的全部三大理论呈现在同一张图表上:五条线、波动论(I、V、N、P、Y、W 波)、价格论(N、V、E、NT 目标)和时间论(基本数值与对等数值的时间计数)。 另外还包含:不重绘的高周期云图、经过测算的迟行带(Chikou Span)、在基准线走平、云层过薄或价格处于云中时暂停交叉信号的震荡过滤器,以及读取"市场报价"中全部品种并按可靠度排序的扫描器。 多数一目均衡表工具只画五条线,再加一个面板和一个提醒。五条线只是一目均衡表的第一部分。细田悟一把这套系统建立在三大理论之上:行情的形态、应走的幅度,以及何时应当发生变化。Ichimoku Nexus Pro 三者全画。 五条线 转换线、基准线、云(先行带 A 与 B)和迟行带均在指标内部计算。策略测试器中的数值与实盘图表完全一致,没有断档,也没有空值。 周期预设: Traditional 9 / 26 / 52 / 26 Crypto 20 / 60 / 120 / 30 Doubled 18 / 52 / 104 / 26 Auto:加密货币品种用 Crypto,其余一律用 Tr
FREE
Institutional Sniper — 机构订单流 + 智能资金结构 + 精准信号 Institutional Sniper 是一款完整的全能图表指标,将专业趋势引擎、支撑/阻力与供需区间、智能资金概念(BOS / CHoCH + 订单块)、多周期仪表盘以及自动交易计划(入场 / 止损 / TP1 / TP2)全部整合在一个不重绘、界面高端简洁的工具中。 它旨在回答每个交易者的三个核心问题: 市场正在做什么? 关键位置在哪里? 我应该在哪里进场,目标在哪里? 功能说明 趋势引擎(Trend Engine) — 使用双 EMA,并通过 ADX 和 ATR 过滤,忽略弱势或震荡行情,仅突出真正的趋势。 价格区间(S/R + 供需) — 自动检测并绘制测试次数最多的价格区间,并按强度(触碰次数)排序。 智能资金结构(SMC) — 标记 BOS(结构突破)和 CHoCH(结构反转),并绘制相关订单块。 多周期同步(Multi-Timeframe Sync) — 仪表盘显示你选择的三个周期(如 M15 / H1 / H4)的趋势及其是否一致。 自动交易计划(Automatic Trade
FREE
该指标准确地识别出价格走势与MACD柱状图之间的牛市和熊市背离,使用的指数移动平均线(EMA)周期为5(快速),34(慢速),信号线周期为5。该指标突出显示了动能减弱的点,提示可能的趋势反转。 正确识别背离的规则: 当价格形成更低的低点,而MACD柱状图同时在零线之上形成更高的低点时,牛市背离有效。 当价格形成更高的高点,而MACD柱状图同时在零线以下形成更低的高点时,熊市背离有效。 如果柱状图的极值和价格的极值没有位于零线的同一侧,则背离信号无效,因为这可能导致假信号。 这种方法代表了应用MACD背离分析最准确和可靠的方法。 指标特点: 清晰地标记已确认的牛市和熊市背离。 严格遵守MACD背离验证规则,提高可靠性。 其他信息:该指标作为MetaTrader 5的EX5编译文件提供。它不需要外部库或DLL文件。建议交易者将此工具与整体交易策略一起使用。在进行真实交易前,请务必在模拟账户中充分测试。该指标不保证盈利,仅作为帮助识别真实MACD背离的分析工具。
FREE
Meravith
Ivan Stefanov
5 (3)
做市商工具。 Meravith 将: 分析所有时间周期并显示当前正在运行的趋势。 标注流动性区域(成交量均衡区),即多头与空头成交量相等的位置。 在您的图表上直接显示来自不同时间周期的所有流动性水平。 生成并展示基于文本的市场分析供您参考。 根据当前趋势计算目标位、支撑位和止损位。 计算交易的风险回报比。 根据您的账户余额计算仓位大小,并估算潜在利润。 在市场出现重大变化时,Meravith 还会发出警告。 指标的主要线条: 多头/空头成交量衰竭线 —— 作为目标位使用。 趋势线 —— 指示市场趋势方向。根据市场是多头还是空头而改变颜色,并作为趋势支撑。其颜色主要反映市场情绪。 成交量均衡线(Eq)—— Eq(Volume Equilibrium)是系统的核心。它表示买卖双方成交量的平衡点,即市场流动性所在位置。向上突破 Eq 表示多头倾向,向下突破 Eq 表示空头倾向。突破后,应等待回调——当价格回到相反趋势的偏离线或衰竭线附近时。 使用方法:只需将其添加到图表中。 Meravith 可以分析一切——趋势和回调。 趋势线与某条成交量衰竭线之间的距离越大,说明该方向的成交量越高。 趋
Meravith MT5
Ivan Stefanov
5 (3)
做市商工具。 Meravith 将: 分析所有时间周期并显示当前正在运行的趋势。 标注流动性区域(成交量均衡区),即多头与空头成交量相等的位置。 在您的图表上直接显示来自不同时间周期的所有流动性水平。 生成并展示基于文本的市场分析供您参考。 根据当前趋势计算目标位、支撑位和止损位。 计算交易的风险回报比。 根据您的账户余额计算仓位大小,并估算潜在利润。 在市场出现重大变化时,Meravith 还会发出警告。 指标的主要线条: 多头/空头成交量衰竭线 —— 作为目标位使用。 趋势线 —— 指示市场趋势方向。根据市场是多头还是空头而改变颜色,并作为趋势支撑。其颜色主要反映市场情绪。 成交量均衡线(Eq)—— Eq(Volume Equilibrium)是系统的核心。它表示买卖双方成交量的平衡点,即市场流动性所在位置。向上突破 Eq 表示多头倾向,向下突破 Eq 表示空头倾向。突破后,应等待回调——当价格回到相反趋势的偏离线或衰竭线附近时。 使用方法:只需将其添加到图表中。 Meravith 可以分析一切——趋势和回调。 趋势线与某条成交量衰竭线之间的距离越大,说明该方向的成交量越高。 趋势
Naturu MT4
Ivan Stefanov
“Naturu” 是一个使用大自然对称性作为算法的手动指标。 用简单策略和隐藏智慧,掌控市场! 加载指标后,您会看到两条线——上线(Top)和下线(Bottom)。 单击一次即可激活某条线。要移动,只需点击您想放置该线的那根K线。 您设定一个高点和一个低点,指标会自动计算: 洋红色区域,显示多空双方兴趣最接近之处,也就是最有可能成为支撑/阻力的区域。 灰色区域,标示下一层次的关注区。 青绿色线条,表示多方的目标价位。 金色线条,表示空方的目标价位。 手动指标赋予您完全的控制和灵活性,让您根据实时市场环境和个人直觉调整级别。它们迫使您更深入地亲自分析价格走势,帮助您真正理解支撑、阻力和形态是如何形成的。依靠人工判断,可以过滤掉自动系统常常误判的大量“噪音”,减少错误信号。而且,因您亲自设定每个级别,可在突发新闻或极端行情时立即调整,无需等候代码更新。 隐藏于简单游戏背后的神圣力量!
RSI Divergence Pulse 是一个全面的 RSI 指标,结合了背离检测、多时间框架分析和可视化工具于一身,轻量级应用。它自动识别常规和隐藏背离,显示实时多时间框架 RSI 面板,填充 OB/OS 区域以便视觉识别,在价格图表和 RSI 子窗口上绘制背离线,放置买卖箭头,并提供实时警报。 Features Color-Coded RSI Line RSI 线根据当前区域改变颜色。蓝色表示中性区域(30 到 70 之间)。绿色标记超买区域(高于 70)。红色标记超卖区域(低于 30)。 RSI Signal Line RSI 的 SMA(默认周期 9)作为信号线。RSI 和信号线的交叉提供额外的时机信息。差值(Diff)显示在仪表板中。 Automatic Divergence Detection 基于分形的枢轴算法扫描最多 500 根 K 线,检测两种类型的背离。常规(实际)背离识别经典反转信号,即价格创出新极值而 RSI 不认可。隐藏背离识别趋势延续信号,在回调期间。 Dual Divergence Lines 实线代表常规背离,虚线代表隐藏背离。线条同时绘制在价格图表
Imbalance Pro
Ivan Stefanov
5 (4)
该指标测量所选时段内牛市和熊市之间的不平衡,并在两点之间显示一条直线。 如果牛市的成交量大于熊市,则该线变为绿色。 如果熊市成交量更大,则为红色。 直线还显示成交量的百分比差异。 该指标在单独的窗口中显示相同的数据。您还可以看到分割后的成交量。 该指标有两种模式。 为此,左上方有一个按钮、  - 如果不按下,它将测量市场任意点与当前价格之间的不平衡。 - 如果按下按钮,则可以测量市场任意两点之间的平衡。 该指标测量所选时段内牛市和熊市之间的不平衡,并在两点之间显示一条直线。 如果牛市的成交量大于熊市,则该线变为绿色。 如果熊市成交量更大,则为红色。 直线还显示成交量的百分比差异。 该指标在单独的窗口中显示相同的数据。您还可以看到分割后的成交量。 该指标有两种模式。 为此,左上方有一个按钮、  - 如果不按下,它将测量市场任意点与当前价格之间的不平衡。 - 如果按下按钮,则可以测量市场任意两点之间的平衡。
RSI Divergence Pulse is an RSI-based indicator for MetaTrader 4. It detects regular and hidden divergences, draws them on the price chart and in the RSI subwindow, shows RSI values from five timeframes in one panel, and reports the current RSI state in an information panel. Alerts can be sent when a divergence is confirmed. How it works The indicator calculates a standard RSI and a signal line, which is a simple moving average of the RSI. Significant RSI highs and lows are located with a frac
Enigmera
Ivan Stefanov
5 (9)
ENIGMERA: 市场的核心 重要提示:MQL5.com 演示版本在策略测试器中运行,可能无法完全反映 Enigmera 的功能。请查看描述、截图和视频了解详细信息。如有任何问题,请随时联系我! 该指标的代码已完全重写。版本 3.0 增加了新功能并修复了自指标发布以来积累的错误。 简介 这个指标和交易系统是金融市场的一种独特方法。ENIGMERA 使用分形周期来精确计算支撑和阻力水平。它展示了真实的积累阶段,并提供了方向和目标。无论是在趋势中还是在修正中,这个系统都能工作。 它是如何工作的 指标的大部分功能通过图表左侧的按钮控制,使得能够快速响应不同的市场情况。 按钮 ON/OFF – 显示或隐藏整个指标。 Channel – 激活支撑通道,显示可接受的偏差范围。 Dev1 (第一偏差) – 指示价格在支撑偏差内的波动,信号表示市场正在整合或积累力量。 Dev2 (第二偏差) – 显示价格在偏差之间的波动,表示趋势形成和方向。 Dev3 (第三偏差) – 表示趋势的显著加速和高波动性。 45deg (45度) – 显示市场的节奏和相对于 45 度线的运动稳定性。 Tgt1/2
Sense
Ivan Stefanov
5 (2)
SENSE 是一个自动系统,它将选定的 GANN 方法与分形计算相结合。系统会告诉我们在哪里开仓,在哪里平仓。无需再将时间浪费在复杂的计算上 - SENSE 会为您完成一切。只需安装指标即可。 基本原则: 当价格高于白线时,市场看涨 在白线上方买入,在白线下方止损 绿线为上涨目标 当价格低于白线时,市场看跌。 在白线下方卖出,在白线上方止损 红线为下行目标 双绿线或红线表示较强的区域。 为什么是 SENSE? 获利目标: SENSE 自动设置获利目标,帮助您最大限度地提高交易成功率。 自动适应: 该指标可自动重新计算任何时间框架,提供准确可靠的信号,无需手动调整。 非常适合剥头皮交易。 查看演示版! SENSE 是一个自动系统,它将选定的 GANN 方法与分形计算相结合。系统会告诉我们在哪里开仓,在哪里平仓。无需再将时间浪费在复杂的计算上 - SENSE 会为您完成一切。只需安装指标即可。 基本原则: 当价格高于白线时,市场看涨 在白线上方买入,在白线下方止损 绿线为上涨目标 当价格低于白线时,市场看跌。 在白线下方卖出,在白线上方止损 红线为下行目标
Two Snakes
Ivan Stefanov
5 (1)
Levelss
Ivan Stefanov
5 (1)
LEVELSS 指标显示 - 每日看涨和看跌区域。每天从 00:00 至 23:59 都可以看到。 - 周线看涨和看跌区域。每周从周一 0:00 至周五 23:59。 - 从特定时间框架特别计算的通道,显示在所有其他时间框架上。默认情况下,这是 4 小时时间框架,您可以将其更改为您希望交易的任何其他时间框架。它是不间断计算的。 屏幕左上方显示区域和通道是看涨、看跌还是中性。当三个区域都看涨时,当前蜡烛上会出现一个绿点。当三个区域都看跌时,则出现粉红色。 该指标没有任何限制。 LEVELSS 指标显示 - 每日看涨和看跌区域。每天从 00:00 至 23:59 都可以看到。 - 周线看涨和看跌区域。每周从周一 0:00 至周五 23:59。 - 从特定时间框架特别计算的通道,显示在所有其他时间框架上。默认情况下,这是 4 小时时间框架,您可以将其更改为您希望交易的任何其他时间框架。它是不间断计算的。 屏幕左上方显示区域和通道是看涨、看跌还是中性。当三个区域都看涨时,当前蜡烛上会出现一个绿点。当三个区域都看跌时,则出现粉红色。 该指标没有任何限制。
GANN Master
Ivan Stefanov
5 (1)
GANN Master 为当前的日、周或月绘制江恩(W. D. Gann)平方根水平,并标出买方与卖方目标相遇的区域。水平由上一周期的最高价和最低价计算,在整个周期内保持不变,不会重画。 水平如何构建 上一周期的最高价成为 TOP 线,其最低价成为 BOTTOM 线。指标从 TOP 向下量出三个看跌目标(Bears' interest 1、2 和 3),从 BOTTOM 向上量出三个看涨目标(Bulls' interest 1、2 和 3),使用江恩的平方根步长 1/8、2/8 和 3/8。 江恩计算始终需要一个比例。GANN Master 会自行选择:它尝试每一个比例,并保留使看涨线与看跌线彼此最接近的那一个。当一条看跌线与一条看涨线相互靠近时,双方的利益就在此相遇。指标把这些位置着色为共同利益区域。每个周期最多绘制五个区域。 每个区域周围有两条虚线的区域突破线,位于该区域上方和下方,距离为 TOP-BOTTOM 区间的 1/8。TOP 和 BOTTOM 周围也有一条同样大小的着色带。 图表上显示的内容 TOP 与 BOTTOM、六条江恩线及其名称,显示在当前K线的右侧 当前日、周或
Stefanov
Ivan Stefanov
The indicator displays support and resistance zones defined logically using the MACD. The entire concept is explained in the video, with specific examples shown. The indicator works on any instruments and timeframes. It does not repaint. After placing it on the chart, please go through all the timeframes sequentially, from monthly to 1-minute, so that all lines load correctly. After that, you can start using it. The concept is unique and has not been seen in other systems or indicators.
Fifty Pro
Ivan Stefanov
5 (1)
FIFTY 指标现在提供自动化版本,无需手动绘制水平线。此版本可自动在图表上绘制每日、每周、每月和年度水平线,确保准确性并节省时间。此外,提供按钮以切换这些水平线的可见性,实现完全自定义。对于喜欢手动操作的用户,免费版本仍然可用且功能齐全,让交易者可以根据自己的需求选择手动或自动工具。 最符合逻辑的指标之一。 高度可靠。 FIFTY 指标现在提供自动化版本,无需手动绘制水平线。此版本可自动在图表上绘制每日、每周、每月和年度水平线,确保准确性并节省时间。此外,提供按钮以切换这些水平线的可见性,实现完全自定义。对于喜欢手动操作的用户,免费版本仍然可用且功能齐全,让交易者可以根据自己的需求选择手动或自动工具。 最符合逻辑的指标之一。 高度可靠。
Enigmera MT5
Ivan Stefanov
3.67 (3)
Enigmera 是一款用于 MetaTrader 5 的手动指标与交易系统。它利用分形周期计算支撑与阻力位,标记积累阶段,并绘制当前走势的方向与目标。该分析在趋势行情与回调行情中均适用。 该指标通过图表上的按钮手动操作。可以在 MetaTrader 策略测试器的可视模式下运行,在购买前查看它在历史数据上的表现;部分由按钮控制的功能在测试器中的表现可能与实盘图表不同。 工作原理 指标根据品种的分形周期推导出当前趋势的支撑线、支撑线周围的允许偏离通道、三个偏离水平以及目标线。支撑线定义了市场状态:价格保持在其上方时趋势延续,跌破该线则表示趋势改变。已经绘制的线条不会重绘。 大部分功能通过图表左侧的按钮控制,因此可以在市场状况变化时快速调整显示内容。 按钮 ON/OFF:显示或隐藏整个指标。 Support:趋势的主支撑线。 Ch:启用支撑通道,显示允许的偏离范围。 Dev1:价格在支撑偏离范围内运行,表示盘整或积累。 Dev2:价格在各偏离水平之间运行,表示趋势形成及其方向。 Dev3:价格运行显示趋势加速与波动加大。 45deg:显示市场相对于 45 度线的运行速度。 Tgt:趋势的目
Fifty Pro MT5
Ivan Stefanov
这是为数不多仅基于价格计算水平的指标之一。该指标不受时间周期、趋势或市场周期的影响,是有史以来最具逻辑性的指标之一。 现在, FIFTY 指标推出了自动版本,无需手动绘制水平线。此版本会自动在图表上绘制每日、每周、每月和每年的水平线,确保精确并节省时间。此外,提供了按钮用于切换这些水平线的显示,方便用户完全自定义。对于喜欢手动方式的用户,免费版本仍然可用且功能齐全,可根据交易需求选择手动或自动工具。 非常可靠,强烈推荐!快来索取你的手动版 FIFTY 指标吧! 这是为数不多仅基于价格计算水平的指标之一。该指标不受时间周期、趋势或市场周期的影响,是有史以来最具逻辑性的指标之一。 现在, FIFTY 指标推出了自动版本,无需手动绘制水平线。此版本会自动在图表上绘制每日、每周、每月和每年的水平线,确保精确并节省时间。此外,提供了按钮用于切换这些水平线的显示,方便用户完全自定义。对于喜欢手动方式的用户,免费版本仍然可用且功能齐全,可根据交易需求选择手动或自动工具。 非常可靠,强烈推荐!快来索取你的手动版 FIFTY 指标吧!
Speculator MT5
Ivan Stefanov
SPEKULATOR 是一个手动交易系统和指标,帮助您识别关键支撑区域和市场方向。 用简单的策略和隐藏的智慧掌握市场。 您可以在图表上选择任意一个顶部(TOP)和底部(BOTTOM),指标将自动绘制: 您趋势方向的支撑区。 如果是多头趋势,将显示绿色区域;如果是空头趋势,将显示红色区域。该支撑区的灵敏度可以在设置中调整。该区域基于您选择的趋势,表示支撑最可能出现的位置。 高偏差线和低偏差线 根据甘氏九宫格(W.D. Gann’s Square of 9)计算的角度线 入场规则如下: 如果价格向上突破高偏差线,可以做多 如果价格向下突破低偏差线,可以做空 如果价格在偏差线之间震荡,可以在区间内高抛低吸,同时遵守支撑区的方向 甘氏角度线可用作止盈参考 关键水平是360度线: 如果价格高于该线,市场可能会上涨 如果价格低于该线,市场可能会继续下跌 加载指标后,它会出现在图表上的第20根到第50根K线之间。 点击该线即可激活,激活后可以将其移动到任意顶部或底部。 SPEKULATOR 是少数几个将清晰逻辑与优雅视觉效果结合在一起的指标之一。 您可以选择启用区域之间的颜色渐变,使图表显示更为平
Naturu
Ivan Stefanov
5 (1)
“Naturu” 是一个使用大自然对称性作为算法的手动指标。 用简单策略和隐藏智慧,掌控市场! 加载指标后,您会看到两条线——上线(Top)和下线(Bottom)。 单击一次即可激活某条线。要移动,只需点击您想放置该线的那根K线。 您设定一个高点和一个低点,指标会自动计算: 洋红色区域,显示多空双方兴趣最接近之处,也就是最有可能成为支撑/阻力的区域。 灰色区域,标示下一层次的关注区。 青绿色线条,表示多方的目标价位。 金色线条,表示空方的目标价位。 手动指标赋予您完全的控制和灵活性,让您根据实时市场环境和个人直觉调整级别。它们迫使您更深入地亲自分析价格走势,帮助您真正理解支撑、阻力和形态是如何形成的。依靠人工判断,可以过滤掉自动系统常常误判的大量“噪音”,减少错误信号。而且,因您亲自设定每个级别,可在突发新闻或极端行情时立即调整,无需等候代码更新。 隐藏于简单游戏背后的神圣力量!
一种先进的动量振荡器,可根据市场波动性自动调整计算周期,从而更准确地识别超买和超卖信号。 工作原理 该指标使用自适应周期计算方法:在高波动性情况下缩短周期,在低波动性情况下延长周期。这种动态调整在趋势市场中能够提供更快的信号,并在震荡行情中减少虚假信号。 RSI 数值基于这一可变周期进行计算,因此对当前市场状况更加敏感。仍然使用传统的 30(超卖)和 70(超买)水平,但由于其自适应特性,这些水平被触及时具有更高的参考价值。 主要特点: 根据市场波动性自动调整计算周期 在图表上显示买入 / 卖出箭头 彩色振荡器:高于 50 为绿色,低于 50 为红色 在趋势行情中反应更快 在震荡行情中减少虚假信号 无重绘指标——K 线收盘后数值保持不变 适用于所有时间周期和所有市场
筛选:
无评论
回复评论