Recognizer 1 2 3 Patterns

4.67

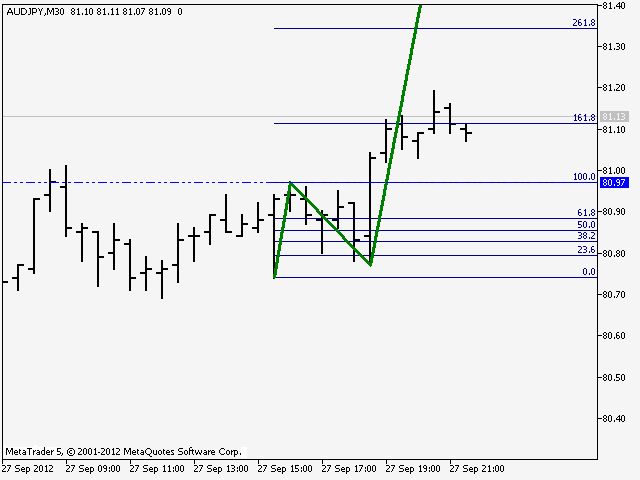
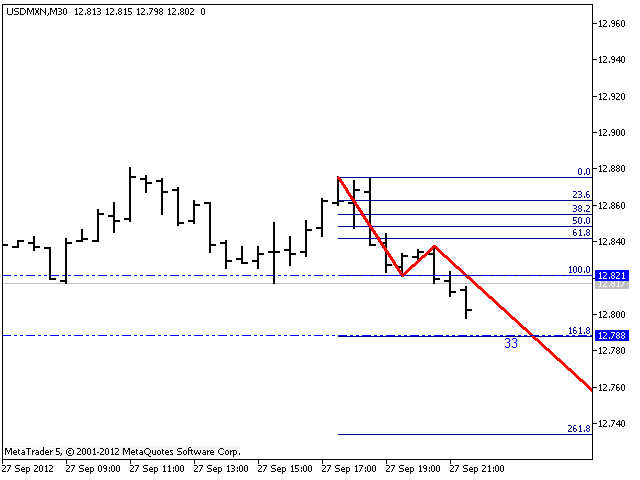
本指标用于在图表上识别和标记 1-2-3 多头和空头形态。本指标可辅助确定交易的开始和分形信号,以及 МetaTrader 5 所有时间帧内的可能入场点。在图表上绘制的菲波纳奇线用来指示在波浪理论基础上价格移动的可能目标。

在价格顶部或底部形成 1-2-3 形态尤其重要,它的出现可作为离散 (聚合)。

本指标可以调整射线和菲波纳奇线的颜色。

本指标对于任何交易系统或模板都是一个极好的补充。

评分 50
pinheirotrade
20
pinheirotrade 2025.10.18 18:05 
 

Hello! Congratulations on the excellent indicator. Could you make the source code available so I can extend it?

Rafal Krzysztof Manuszewski
2387
Rafal Krzysztof Manuszewski 2024.09.13 18:30 
 

helpful indicator

FELICE TRANI
18
FELICE TRANI 2023.10.07 10:18 
 

THX for sharing the indicator. Very very good!

推荐产品
Free automatic Fibonacci is an indicator that automatically plots a Fibonacci retracement based on the number of bars you select on the BarsToScan setting in the indicator. The Fibonacci is automatically updated in real time as new highest and lowest values appears amongst the selected bars. You can select which level values to be displayed in the indicator settings. You can also select the color of the levels thus enabling the trader to be able to attach the indicator several times with differe
FREE
前一版本指标的发展 ZigZag WaveSize MT4 ZigZag WaveSize - 修改后的标准锯齿指标,增加了波浪长度、水平和不同警报逻辑的信息 一般改进: 为MetaTrader 5适配代码 优化了图形对象的操作 新特性: 极值处的水平线 选择水平类型:水平线/射线/线段 液性水平滤波器(未被价格突破) 突破缓冲区:设置对错误突破的敏感度 标签设置和功能:数量、外观、删除旧标签 结构突破警报(BoS) 移动性质变化警报(ChoCH) 优化: 修正更新极值的逻辑 动态更新新对象 减少新柱出现时的负载 集中的标签系统 修复: 修复了数组越界问题 正确的标签定位 删除了重复的参数 将ZigZag WaveSize指标作为您交易系统的补充使用   也可以尝试我在市场上的其他产品  https://www.mql5.com/ru/users/capitalplus/seller 如果您喜欢该指标,请对其进行评分并留下评论,这对我来说非常重要! 祝您交易获利丰厚!
FREE
Easy GOLD MT5
Franck Martin
3.95 (41)
Easy Gold is the latest addition to the BotGPT family. It is surprising and very powerful. It is ideal for beginners due to its simplicity.  There is absolutely nothing to do, it's 100% automated, simply indicate the percentage of risk you want to take per trade and the EA is ready. Whatever your capital, the EA takes care of everything. Optimized on (XAUUSD).  Unleash all the power with the professional version (AGI Gold) and its connection to the neural network, available in my store. My othe
FREE
Zigzag Price Arrows
Aiman Saeed Salem Dahbag
The Zigzag Price Arrow indicator is an enhanced version of the classic Zigzag indicator, combining the traditional zigzag pattern with advanced visual features. It not only identifies major market turning points but also provides clear trading signals through: • Directional arrows: Displays colored arrows (green for buy, magenta for sell) indicating potential trend directions. • Price labels: Shows the exact price values at each pivot point directly on the chart. • Improved visual clarity: Make
FREE
Caicai L&S Yield Histogram Important Notice: This indicator is an integral tool of the automated EA Caicai Long and Short Pair Trading . This indicator visually displays the percentage deviation (Yield %) of a pair's current spread relative to its own historical mean. It is an excellent tool for quickly visualizing the gross financial potential of a market distortion in Long & Short operations. Main Features: Percentage Visualization: Understand the size of the distortion in palpable percentage
FREE
Easy Correlations Indicator The Easy Correlations Indicator is designed to help traders analyze the relationship between two correlated instruments. By monitoring the distance between their Relative Strength Index (RSI) values, the indicator highlights situations where one instrument has moved significantly further than the other. This creates potential trading opportunities: Sell the stronger instrument (overstretched RSI) Buy the weaker instrument (lagging RSI) Because the positions are opened
FREE
Binary Profit Gainer
Myo Min Aung
5 (2)
This indicator is especially for the binary trading. Time frame is 1 minutes and exp time 5 or 3 minutes only. You must be use martingale 3 step. So you must put lots size is 10 % at most. You should use Mt2 trading platform to connect with my indicator to get more signal without human working. This indicator wining rate is over 80% but you may get 100% of profit by using martingale 3 step. You should use MT2 Trading Platform to connect meta trader platform and binary platform . You can get mt2
FREE
Donchian Breakout And Rsi
Mattia Impicciatore
5 (1)
概述 本指标是经典 Donchian 通道 的增强版,增加了多种实用的交易功能。 除了标准的三条线(最高、最低和中线),系统能够检测 突破 ,并在图表上用箭头进行可视化标记,同时只显示 与当前趋势方向相反的那条线 ,让图表更加简洁。 功能包括: 可视化信号 :突破时在图表上绘制彩色箭头 自动通知 :弹窗、Push 推送和 Email 邮件 RSI 过滤 :根据市场相对强弱验证信号 个性化设置 :颜色、线条粗细、箭头符号、RSI 阈值等 工作原理 Donchian 通道计算: 上轨线 :最近 N 根已收盘 K 线的最高价 下轨线 :最近 N 根已收盘 K 线的最低价 中线 :最高价和最低价的平均值 看涨突破 :收盘价高于上轨线 看跌突破 :收盘价低于下轨线 指标会: 绘制三条 Donchian 通道线 仅在 方向变化后的首次突破 绘制箭头 隐藏顺应趋势方向的那条线(上涨趋势: 只显示红色下轨线;下跌趋势: 只显示绿色上轨线) 可选用 RSI 过滤突破信号,减少虚假突破 支持实时发送通知 参数说明 Donchian 通道设置 indPeriod :计算通道高低点的已收盘 K 线数量 Lin
FREE
Follow The Line MT5
Oliver Gideon Amofa Appiah
4.6 (35)
This indicator obeys the popular maxim that: "THE TREND IS YOUR FRIEND" It paints a GREEN line for BUY and also paints a RED line for SELL. (you can change the colors). It gives alarms and alerts of all kinds. IT DOES NOT REPAINT and can be used for all currency pairs and timeframes. Yes, as easy and simple as that. Even a newbie can use it to make great and reliable trades. NB: For best results, get my other premium indicators for more powerful and reliable signals. Get them here: https://www.m
FREE
Important Lines
Terence Gronowski
4.88 (24)
This indicator displays Pivot-Lines, preday high and low, preday close and the minimum and maximum of the previous hour. You just have to put this single indicator to the chart to have all these important lines, no need to setup many single indicators. Why certain lines are important Preday high and low : These are watched by traders who trade in a daily chart. Very often, if price climbs over or falls under a preday low/high there is an acceleration in buying/selling. It is a breakout out of a
FREE
High Low Open Close
Alexandre Borela
4.98 (43)
如果你象这个项目一样,就有5个饥饿审查。 这项指标采用了既定价格的公开、高、低价和关闭价格 可以对特定时间区加以调整。 许多机构和专业人士都认为这些是重要的。 贸易商可以为你了解他们可能更进一步的地点, 积极。 现有期间为: 前一日。 前一星期。 曾任Month。 曾任。 前一年。 或: 目前日。 目前周。 目前 Month。 目前配额。 今年。
FREE
Haven Key Levels PDH PDL
Maksim Tarutin
5 (8)
"Haven Key Levels PDH PDL"   指标可帮助交易者在图表上将关键水平可视化。它会自动标记以下水平: DO (Daily Open)   — 每日开盘价。 NYM (New York Midnight)   — 纽约午夜价。 PDH (Previous Day High)   — 前一日最高价。 PDL (Previous Day Low)   — 前一日最低价。 WO (Weekly Open)   — 每周开盘价。 MO (Monthly Open)   — 每月开盘价。 PWH (Previous Week High)   — 前一周最高价。 PWL (Previous Week Low)   — 前一周最低价。 CMH (Current Month High)   — 当月最高价。 CML (Current Month Low)   — 当月最低价。 PMH (Previous Month High)   — 上一月最高价。 PML (Previous Month Low)   — 上一月最低价。 其他产品 ->  点击这里 。 自定义功能: 选择线条颜
FREE
PZ Penta O MT5
PZ TRADING SLU
3.5 (4)
The Penta-O is a 6-point retracement harmonacci pattern which usually precedes big market movements. Penta-O patterns can expand and repaint quite a bit. To make things easier this indicator implements a twist: it waits for a donchian breakout in the right direction before signaling the trade. The end result is an otherwise repainting indicator with a very reliable trading signal. The donchian breakout period is entered as an input. [ Installation Guide | Update Guide | Troubleshooting | FAQ | A
FREE
Fibonacci Moving Averages
Brendan Jonathan Stoyanowski-campbell
2 (1)
OVERVIEW The Fibonacci Moving Averages are a toolkit which allows the user to configure different types of Moving Averages based on key Fibonacci numbers. Moving Averages are used to visualise short-term and long-term support and resistance which can be used as a signal where price might continue or retrace. Moving Averages serve as a simple yet powerful tool that can help traders in their decision-making and help foster a sense of where the price might be moving next. The aim of this scrip
FREE
This indicator is an automated version of the Fibonacci retracement (Fib) indicator. Deciding the best areas to use when drawing the fib can be tricky and this  indicator was made with that in mind. When you drop it on the chart it will automatically choose the best points to draw the fib with, but in case you aren't satisfied with those regions, you can adjust it as you wish.
FREE
Indicator and Expert Adviser  EA Available in the comments section of this product. Download with Indicator must have indicator installed for EA to work. Mt5 indicator alerts for bollinger band and envelope extremes occurring at the same time. Buy signal alerts occur when A bullish candle has formed below both the lower bollinger band and the lower envelope  Bar must open and close below both these indicators. Sell signal occur when A bear bar is formed above the upper bollinger band and upper
FREE
FlatBreakout MT5
Aleksei Vorontsov
FlatBreakout MT5 (Free Version) Flat Range Detector and Breakout Panel for MT5 — GBPUSD Only FlatBreakout MT5   is the free version of the professional FlatBreakoutPro MT5 indicator, specially designed for flat (range) detection and breakout signals on the   GBPUSD   pair only. Perfect for traders who want to experience the unique fractal logic of FlatBreakout MT5 and test breakout signals on a live market without limitations. Who Is This Product For? For traders who prefer to trade breakout of
FREE
MACD Enhanced
Nikita Berdnikov
5 (3)
Introducing the MACD  Enhanced – an advanced MACD (Moving Average Convergence Divergence) indicator that provides traders with extended capabilities for trend and momentum analysis in financial markets. The indicator uses the difference between the fast and slow exponential moving averages to determine momentum, direction, and strength of the trend, creating clear visual signals for potential entry and exit points. Attention! To achieve the best results, it is recommended to adapt the indicator
FREE
LT Donchian Channel
Thiago Duarte
4.86 (7)
Donchian Channel is an indicator created by Richard Donchian. It is formed by taking the highest high and the lowest low of the last specified period in candles. The area between high and low is the channel for the chosen period. Its configuration is simple. It is possible to have the average between the upper and lower lines, plus you have alerts when price hits one side. If you have any questions or find any bugs, please contact me. Enjoy!
FREE
Trendline mt5 indicator
David Muriithi
3 (1)
Are you tired of drawing trendlines every time you're analyzing charts? Or perhaps you would like more consistency in your technical analysis. Then this is for you. This indicator will draw trend lines automatically when dropped on a chart. How it works Works similar to standard deviation channel found on mt4 and mt5. It has 2 parameters: 1. Starting Bar 2. Number of bars for calculation The   starting bar   is the bar which drawing of the trend lines will begin, while the   number of bars for c
FREE
The indicator detects and displays М. Gartley's Butterfly pattern. The pattern is plotted by the extreme values of the ZigZag indicator (included in the resources, no need to install). After detecting the pattern, the indicator notifies of that by the pop-up window, a mobile notification and an email. The pattern and wave parameters are displayed on the screenshots. The default parameters are used for demonstration purposes only in order to increase the amount of detected patterns. Parameters z
APCT Chart Pattern
Mthandeni Mnyandu
3 (2)
APICT Chart Patterns – Trend Line & Pattern Recognition for MT5 Enhance your technical analysis with the APICT Chart Patterns Indicator — an advanced tool for automatic pattern and trend line detection in MetaTrader 5. Key Features Automatic Pattern Detection: Identifies over 10 classic chart patterns, including pennants, wedges, channels, and double tops/bottoms. Real-Time Trend Lines: Draws support and resistance lines using smart algorithms. Custom Sensitivity: Adjust detection for major or
FREE
This indicators automatically draws the   support and resistances   levels (key levels) for you once you've dropped it on a chart. It reduces the hustle of drawing and redrawing these levels every time you analyse prices on a chart. With it, all you have to do is drop it on a chart, adjust the settings to your liking and let the indicator do the rest. But wait, it gets better; the indicator is absolutely free! For more information:  https://youtu.be/rTxbPOBu3nY For more free stuff visit:  https:
FREE
这种用于从无穷远衡量货币强弱的创新指标是长期交易的黄牛和交易者不可或缺的助手。 分析货币强弱的系统早已被世界领先的交易者所熟知并在市场上使用。 没有这种分析,任何套利交易都是不完整的。 我们的指标很容易确定基础货币相对于彼此的强弱。 它显示所有或当前货币对的折线图,允许即时分析和搜索最强的入口点。 该指标直观,允许您快速找到并切换到任何一对,具有可放置在地下室和主图表上的移动面板。 通知货币强度变化的计时器模式使交易者有机会在手机上收到通知。  使用货币功率计无穷大指示器的几种策略: 1. 使用货币强度的线性显示图表搜索交叉点作为新兴趋势的信号 2. 在趋势反转信号出现后,向强势货币方向反弹 3. 使用货币强度发散分析扭转当前趋势 4. 使用其他无限指标向强势货币方向交易 
FREE
ADR ST Patterns Strategy
Vladimir Poltoratskiy
5 (1)
ADR ST Patterns Strategy  is a modification of the classical  ADR  indicator. This simple indicator corresponds to the parameters specified in the  ST Patterns Strategy ( https://stpatterns.com/ ) .  Structural Target Patterns represents the market consistently divided into components. No trend lines, geometric proportions of the model itself, trading volume, or open market interest are needed for the formation of  ST Patterns . They are easily recognized and built only on the basis of breaking
FREE
Price Magnet — Price Density and Attraction Levels Indicator Price Magnet is a professional analytical tool designed to identify key support and resistance levels based on statistical Price Density. The indicator analyzes a specified historical period and detects price levels where the market spent the most time. These zones act as “magnets,” attracting price action or forming a structural base for potential reversals. Unlike traditional Volume Profile tools, Price Magnet focuses on price-time d
Mirror Chart MT5
Andrej Hermann
5 (1)
The Mirror Chart MT5 is a overlay indicator specifically designed to project a second financial instrument directly onto the main chart window. This tool is invaluable for traders who rely on correlation analysis, as it visualizes the price movements of two different instruments in real time. Unlike traditional overlays, this indicator utilizes intelligent, dynamic centering and scaling logic. It continuously analyzes the visible price range in the current window for both symbols and calculates
FREE
ATR Plus
Ivan Pochta
5 (1)
ATR Plus is an enhanced version of the classic ATR that shows not just volatility itself, but the directional energy of the market . The indicator converts ATR into a normalized oscillator (0–100), allowing you to clearly see: who dominates the market — buyers or sellers when a trend begins when a trend loses strength when the market shifts into a range where volatility reaches exhaustion zones ATR Plus is perfect for momentum, trend-following, breakout and volatility-based systems. How ATR Plus
FREE
ExMachina CandleTimerFit
William Jefferson Mukam Tatsinke
ExMachina CandleTimerFit — MetaTrader 5 免费K线倒计时工具。 准确掌握当前K线的收盘时间。这款轻量级指标在图表上直接显示实时倒计时,帮助您精确把握进出场时机。 倒计时面板 — 三种显示模式可选: 数字时钟:大字号倒计时数字。任何缩放级别下均清晰可读。 进度条:带百分比的视觉填充指示器。一眼即可了解K线进展。 两者兼备:数字时钟与进度条组合。推荐模式。 闪烁提醒 — K线收盘前最后10秒,计时器每秒在琥珀色和红色之间交替。即使在多图表环境中也不会错过。可开启或关闭。 声音提醒 — 新K线形成时可选声音通知。 已用/剩余时间 — 计时器下方紧凑显示已用和剩余时间。 折叠/展开 — 标题栏一键切换。折叠模式显示30像素紧凑条带,包含品牌、交易品种、时间周期和实时倒计时。 适用于所有交易品种和所有时间周期。无DLL。无外部依赖。 包含7个分析面板的完整版(K线、点差、波动率、多周期、交易时段、统计)可在MQL5市场获取:ExMachina CandleTimer。 ExMachina Trading Systems — Precisi
FREE
Fvg Edge
Ahmad Meftah Abdulsalam Alawwami
5 (2)
FVG智能区域 - 免费版 MetaTrader 5 (MT5) 公允价值缺口检测指标   您是否在寻找真正的交易工具,而不仅仅是另一个随机指标? FVG智能区域 - 免费版通过自动检测公允价值缺口(FVG)并在图表上直接高亮显示高概率交易区域,为您提供专业的市场洞察。   专为以下交易者打造: 聪明资金概念(SMC) ICT交易概念 价格行为 供需分析 机构交易策略 该指标帮助您专注于真正重要的事情:价格可能做出反应的区域。 主要特点: 智能区域检测: 自动检测看涨和看跌缺口 清晰、专业的视觉区域 智能过滤以消除弱相关或不相关的缺口 高级确认: 更高时间框架(HTF)汇合验证 当价格填补时智能移除无效区域 活动区域与已填补区域之间的清晰视觉区分 优化性能: 轻量快速 - 不会拖慢您的图表 兼容所有货币对和时间框架 真实交易条件下的平稳运行 完全自定义: 完全可调整的颜色和视觉风格 完美适用于外汇、黄金(XAUUSD)、指数和加密货币 适合日内交易、波段交易和剥头皮交易
FREE
该产品的买家也购买
SuperScalp Pro
Van Minh Nguyen
5 (10)
SuperScalp Pro – 高级多重过滤剥头皮指标系统 SuperScalp Pro 是一款高级剥头皮指标系统,将经典 Supertrend 与多重智能确认过滤器相结合。该指标在 M1 到 H4 的所有时间框架上均运行良好,尤其适用于 XAUUSD、BTCUSD 及主要外汇货币对。可作为独立系统使用,也可灵活整合到现有交易策略中。 指标集成超过 11 个过滤器,包括快慢 EMA、用于趋势判断的三条 EMA、EMA 斜率 (EMA slope)、RSI、ADX、成交量、VWAP、布林带突破(Bollinger Bands Breakout)以及 MACD 背离过滤器。智能蜡烛过滤器用于确认蜡烛收盘并剔除弱信号,而以三条 EMA 结合 MACD 背离的趋势识别机制则有助于筛选出更高胜率的交易信号。 SuperScalp Pro 基于 ATR 自动计算进场(Entry)、止损(Stop Loss)和止盈(Take Profit)水平。所有重要价格水平均直接显示在图表上,方便用户管理风险并做出更精准的交易决策。 系统在超过 5,000 根蜡烛上进行模拟与性能分析,展示完整指标如胜率、总交
Divergence Bomber
Ihor Otkydach
4.89 (83)
购买该指标的每位用户将额外免费获得以下内容: 原创工具“Bomber Utility”,该工具会自动跟踪每一笔交易,设置止损和止盈点,并根据策略规则自动平仓; 适用于不同交易品种的指标设置文件(Set 文件); 三种不同风险模式下的 Bomber Utility 设置文件:“最低风险”、“平衡风险” 和 “观望策略”; 一套详细的 视频操作手册,帮助您快速完成安装、配置并开始使用本交易系统。 注意: 要获取以上所有赠品,请通过 MQL5 的私人消息系统联系卖家。 我为您介绍原创的自定义指标 “Divergence Bomber”(背离轰炸机),它是一套基于 MACD 背离交易策略 的“全功能”交易系统。 该技术指标的主要任务是识别 价格与 MACD 指标之间的背离,并发出交易信号(包括推送通知),指示未来价格可能的运动方向。平均而言,这些信号的准确率超过 98%。有关该指标如何工作的详细说明,请观看本页面上的视频演示。 该系统使用 止损订单 和 动态回撤平仓机制 来管理交易。 Divergence Bomber 指标的主要特点: 支持交易的品种: AUDCAD、AUDCHF、AUDSG
Entry In The Zone and SMC Multi Timeframe is a real-time market analysis tool developed based on Smart Money Concepts (SMC). It is designed to analyze market structure, price direction, reversal points, and key zones across multiple timeframes in a systematic way. The system displays Points of Interest (POI) and real-time No Repaint signals, with instant alerts when price reaches key zones or when signals occur within those zones. It functions as both an Indicator and a Signal System (2-in-1), c
购买此指标即可免费获得我的专业交易管理器。 首先,值得强调的是,这个交易系统是一个非重绘、非重画和非滞后的指标,这使得它非常适合手动和机器人交易。 在线课程,手册和下载预设。 “智能趋势交易系统 MT5”是专为新手和经验丰富的交易者量身定制的综合交易解决方案。它结合了超过 10 个优质指标,具有 7 多个强大的交易策略,使其成为适用于各种市场条件的多功能选择。 趋势跟随策略:提供精确的入场和止损管理,以有效地跟随趋势。 反转策略:识别潜在的趋势反转,使交易者能够利用区域市场的机会。 剃头策略:专为快速准确的日内交易和短期交易而设计。 稳定性:所有指标都不会重绘、不会重画和不会滞后,确保可靠的信号。 定制:支持自定义策略,以满足个人交易偏好。超过 7 种策略和组合可帮助您找到最佳策略。 信号清晰度:提供箭头信号,以指示清晰的入场和退出点。 实时警报:通过交易进出警报使交易者保持了解。 深入分析:提供更高时间框架的趋势分析和实时交易监控。 自适应颜色编码:利用蜡烛颜色编码来显示成交量、趋势和反转蜡烛信号。通过蜡烛颜色分析市场方向。 “智能趋势交易系统 MT5”赋予交易者必要的工具,以便在
FX Trend MT5 NG
Daniel Stein
5 (4)
FX Trend NG:新一代多市场趋势智能分析工具 概述 FX Trend NG 是一款专业的多时间周期趋势分析与市场监控工具,帮助您在几秒钟内全面了解市场结构。 无需在多个图表之间来回切换,您可以立即看到哪些品种处于趋势中、哪里动能正在减弱,以及哪些时间周期之间存在强烈共振。 限时发布优惠 – 仅需 $30(6个月) 或 $80 终身授权 即可拥有 FX Trend NG 。 已经是 Stein Investments 客户? -> 发送消息 以获取专属客户群访问权限。 需要帮助或安装指导? -> 请访问 Stein Investments 官方页面 。 1. FX Trend NG 的核心优势 三状态趋势逻辑 —— 不只是 Buy 或 Sell • 大多数指标仅显示两种状态:Buy 或 Sell。 • FX Trend NG 增加第三种状态: Fade 。 • Fade 表示趋势强度正在减弱,在完全反转之前提前发出信号。 这种结构化逻辑让您看到趋势变化过程,而不仅仅是简单方向信号。 多时间周期分析(M1 至 MN1) • 从短线交易到中长线交易全面覆盖。 • 快速识别趋势
ARICoins
Temirlan Kdyrkhan
ARICoin is a powerful trading companion designed to generate high-probability entry signals with dynamic TP/SL/DP levels based on volatility. Built-in performance tracking shows win/loss stats, PP1/PP2 hits, and success rates all updated live. Key Features: Buy/Sell signals with adaptive volatility bands Real-time TP/SL/DP levels based on ATR Built-in MA Filter with optional ATR/StdDev volatility Performance stats panel (Success, Profit/Loss, PP1/PP2) Alerts via popup, sound, push, or email Cust
Grabber System MT5
Ihor Otkydach
4.82 (22)
向您介绍一款优秀的技术指标——Grabber,它是一套即开即用的“全包式”交易策略。 在一个代码中集成了强大的市场技术分析工具、交易信号(箭头)、提醒功能和推送通知。 每位购买该指标的用户还可免费获得以下内容: Grabber辅助工具:用于自动管理已开仓位 视频操作指南:逐步教学如何安装、设置和使用该指标进行交易 原创Set文件:可快速自动配置,帮助实现最佳交易效果 忘掉其他策略吧!只有Grabber能够真正激励你在交易中攀登新高峰! Grabber策略的主要特点: 交易周期:从M5到H4 适用资产:任意,但我推荐我亲自测试过的品种(GBPUSD、GBPCAD、GBPCHF、AUDCAD、AUDUSD、AUDSGD、AUDCHF、NZDUSD、NZDCAD、EURCAD、EURUSD、EURAUD、EURGBP、EURCHF、USDCAD、USDSGD) 交易时间:全天候 24/7 交易效果:我分享自己的真实交易结果,并在此教学如何操作: https://www.mql5.com/ru/market/product/134563?source=Site+Market+MT5+Indic
Power Candles MT5
Daniel Stein
5 (6)
Power Candles – 适用于所有市场的基于强度的入场信号 Power Candles 将 Stein Investments 经过验证的强度分析直接带入价格图表。与仅对价格作出反应不同,每一根蜡烛都基于真实的市场强度进行着色,使交易者能够立即识别动能累积、强度加速以及清晰的趋势转换。 一套逻辑,适用于所有市场 Power Candles 可自动适用于 所有交易品种 。该指标会检测当前品种是否为外汇货币对或非外汇市场,并在内部自动应用相应的强度模型。 外汇与黄金 使用 FX Power Delta 数值(绝对范围最高至 100) 指数、加密货币和 CFD 使用 IX Power 强度数值(绝对范围最高至 50) 所需的强度计算已直接嵌入 Power Candles。本指标在蜡烛着色和信号逻辑方面无需额外安装任何其他指标。 以强度状态替代价格噪音 每根蜡烛都会被归类为九种清晰定义的强度状态之一: 中性 轻度、中度、强烈、极端空头 轻度、中度、强烈、极端多头 这种基于状态的方法能够过滤随机的价格波动,专注于有意义的市场参与行为。它帮助交易者识别新的方向性阶段正在形成,而不是对单根蜡
Trend Screener Pro MT5
STE S.S.COMPANY
4.84 (101)
使用趋势筛选指标释放趋势交易的力量:由模糊逻辑和多货币系统提供支持的终极趋势交易解决方案! 使用趋势筛选器(由模糊逻辑提供支持的革命性趋势指标)提升您的趋势交易。 它是一个强大的趋势跟踪指标,结合了超过 13 种高级工具和功能以及 3 种交易策略,使其成为使您的 Metatrader 成为趋势分析器的多功能选择。 限时优惠:趋势筛选指标终身仅需 50 美元。 ( 原价 250$ ) (优惠延长) 体验趋势筛选器 100% 无需重新绘制的准确性,确保您的交易决策不受过去价格变化的影响。 释放多时间框架和多货币功能的多功能性,使您能够以无与伦比的信心在外汇、商品、加密货币和指数领域进行交易。 利用 Trend Screener 的综合策略套件增强您的交易: - 趋势跟踪策略和趋势延续策略 :趋势筛选器的趋势跟踪策略提供清晰的趋势延续信号,让您有效捕捉趋势走势并管理风险。 - 反转策略和早期入场点策略 :趋势筛选器的反转策略可检测市场方向的潜在变化,使您能够预测趋势反转并利用疲弱的市场趋势。通过早期入场点,您可以在潜在的趋势变化之前定位自己 获取可观的利润。 - 倒卖策略: 趋势筛选器的倒卖
Gold Entry Sniper
Tahir Mehmood
5 (5)
Gold Entry Sniper – 专业多周期ATR黄金交易仪表盘,适合黄金剥头皮与波段交易 Gold Entry Sniper 是一款先进的 MetaTrader 5 指标,旨在为 XAUUSD 及其他品种提供精准的 买/卖信号 。基于 ATR 移动止损逻辑 和 多周期分析仪表盘 ,适合剥头皮交易者与波段交易者,帮助识别 高概率黄金入场点 。 主要功能与优势 多周期信号分析 – 同时显示 M1、M5、M15 趋势方向。 基于ATR的动态止损 – 根据波动性自动调整。 专业图表仪表盘 – 展示信号状态、ATR水平、线性回归中线和交易方向。 清晰买卖标记 – 自动箭头与文字标签提示。 离场提示与交易管理 – 自动检测离场信号锁定利润。 全面自定义 – 调整仪表盘位置、颜色、字体及参数。 专为黄金优化 – 适用于 M1至M15 黄金剥头皮 ,也适合外汇、指数与加密货币。 为什么选择 Gold Entry Sniper? 为追求 快速、精准、可视化交易决策 的交易者打造,ATR 与多周期确认结合,帮助你抓住 最佳黄金入场点
AriX
Temirlan Kdyrkhan
1 (4)
AriX Indicator for MT5 A powerful trend-following and signal-evaluation tool AriX is a custom MT5 indicator that combines Moving Averages and ATR-based risk/reward logic to generate clear buy/sell signals. It visualizes dynamic SL/TP levels, evaluates past trade outcomes, and displays win/loss statistics in a clean on-chart panel. Key features include: Buy/Sell signals based on MA crossovers ATR-based SL/TP1/TP2/TP3 levels with visual lines and labels Signal outcome tracking with real-time stat
Atomic Analyst MT5
Issam Kassas
4.03 (30)
首先值得强调的是,该交易指标是非重绘、非延迟的指标,这使其成为手动和机器人交易的理想选择。 用户手册:设置、输入和策略。 Atomic Analyst是一种PA价格行动指标,利用价格的力量和动量来寻找市场上更好的机会。配备了高级过滤器,可帮助去除噪音和假信号,并提高交易潜力。使用多层复杂的指标,Atomic Analyst扫描图表,并将复杂的数学计算转化为任何初学者都能理解并用来做出一致交易决策的简单信号和颜色。 “Atomic Analyst”是专为新手和经验丰富的交易者量身定制的综合交易解决方案。它将高级指标和一流功能融合为一体的交易策略,使其成为所有类型交易者的多功能选择。 日内交易和剥头皮策略:专为快速准确的日内交易和短期交易而设计。 日内和摆动交易策略:可用作追求价格大幅波动的日内和摆动交易者的可靠工具。 多货币和市场:凭借其可靠的精度,在不同的工具和市场上运作。 多个时间框架:可在多个时间框架上使用,性能良好。 稳定性:所有指标均不重绘、不重绘和不滞后,确保可靠的信号。 信号清晰度:提供箭头信号,用于清晰的入场和出场点。 实时警报:通过交易入场、SL和TP警报通知交易者
Quantum TrendPulse
Bogdan Ion Puscasu
5 (22)
介绍 Quantum TrendPulse   ,这是一款终极交易工具,它将 SuperTrend   、   RSI 和 Stochastic 的强大功能整合到一个综合指标中,以最大限度地发挥您的交易潜力。该指标专为追求精准和效率的交易者而设计,可帮助您自信地识别市场趋势、动量变化以及最佳进入和退出点。 主要特点: 超级趋势整合: 轻松跟随当前的市场趋势并乘上盈利浪潮。 RSI 精度: 检测超买和超卖水平,非常适合把握市场逆转时机,可用作 SuperTrend 的过滤器 随机精度: 利用随机振荡在波动的市场中寻找隐藏的机会, 用作超级趋势的过滤器 多时间范围分析: 从 M5 到 H1 或 H4,在不同时间范围内关注市场动态。 可定制的警报: 当您的自定义交易条件得到满足时收到通知,这样您就不会错过任何交易。 无论您是新手还是经验丰富的交易员,   Quantum TrendPulse 都能为您提供所需的优势,帮助您增强策略并自信地进行交易。借助这一强大的指标,将洞察力转化为利润 — 掌控您的交易! ***购买 Quantum TrendPulse,即可免费获得 Quantum Tr
介绍     Quantum Breakout PRO   ,突破性的 MQL5 指标,正在改变您交易突破区域的方式!由拥有超过13年交易经验的资深交易员团队开发,     量子突破 PRO     旨在通过其创新和动态的突破区域策略将您的交易之旅推向新的高度。 量子突破指标将为您提供带有 5 个利润目标区域的突破区域的信号箭头,以及基于突破框的止损建议。 它既适合新手交易者,也适合专业交易者。 量子 EA 通道:       点击这里 重要的!购买后请私信我领取安装手册。 建议: 时间范围:M15 货币对:GBPJPY、EURJPY、USDJPY、NZDUSD、XAUUSD 账户类型:ECN、Raw 或 Razor,点差极低 经纪商时间:GMT +3 经纪商:IC Markets、Pepperstone with Raw 和 Razor 的点差最低 规格: 不重漆! 最多 5 个建议利润目标区域 建议止损水平 可定制的盒子。您可以设置自己的 Box Time Start 和 Box Time End。 接触 如果您有任何疑问或需要帮助,请通过私人消息与我联系。
HFT Spike Detector
OMG FZE LLC
5 (1)
[ My Products ] , [ My Channel ] HFT Spike Detector HFT Spike Detector 是一款专业的 tick 监控工具,旨在实时分析和测量高频交易(HFT)引发的价格剧烈波动。 其目标是通过数值数据帮助您识别由经纪商引起的异常滑点、流动性缺口以及毫秒级价格跳动。 工作原理 该 Expert Advisor 会实时分析每一个传入的 tick 数据,并: 价格变化速度 每秒 tick 密度 滑点幅度 同方向微观流动 进行测量并以图表面板形式展示。 因此,您可以看到除点差之外的真实执行质量。 面板显示指标 Slippage 显示监控 tick 中的最大滑点值(以 points 为单位)。 用于检测突发流动性缺口和激进的价格跳动。 Avg Slippage 显示所有传入 tick 的滑点平均值(以 points 为单位)。 用于评估经纪商的整体执行质量。 Perfect Tick 表示在 1 秒内接收到的所有 tick 均为同一方向。 通常代表强烈的算法买入或卖出压力。 Tick/Sec 显示每秒接收的 t
Game Changer Indicator mt5
Vasiliy Strukov
4.62 (21)
Game Changer 是一款革命性的趋势指标,适用于任何金融工具,可将您的 Metatrader 平台升级为强大的趋势分析工具。它适用于任何时间框架,能够帮助您识别趋势、发出潜在反转信号、作为追踪止损机制,并提供实时警报,以便您及时响应市场反应。无论您是经验丰富的专业人士,还是寻求优势的初学者,这款工具都能让您充满信心、纪律严明地进行交易,并清晰地理解潜在的趋势动态。该指标支持重绘功能。 购买后请立即联系我,即可获得专属赠品。您可以免费获得我们的“强支撑”和“趋势扫描器”指标,请私信联系我。 请注意,我不会在 Telegram 上出售我的 EA 或特殊设置,它们仅通过 Mql5 提供,我的设置文件也仅发布在我的博客上。谨防诈骗,切勿从其他任何人处购买任何设置。 设置 启用趋势变化提醒 - 真/假 - 趋势变化时在图表上显示提醒 发送推送通知 - 真/假 - 启用向手机推送提醒通知 发送邮件通知 - 真/假 - 趋势变化时向邮箱发送邮件通知
Smart Stop Indicator – 智能化止损逻辑,直接呈现在您的图表上 概述 Smart Stop Indicator 是为希望以清晰、系统、非情绪化方式设置止损的交易者量身打造的工具。它将经典的价格结构逻辑(更高的高点、更低的低点)与现代突破识别技术相结合,精准标记真正合理的止损位置。无论是趋势、盘整还是快速突破行情,指标都会在图表上直接显示最佳 SL 区域及其状态(“new”、“broken”、“valid”)并且现在新增 SL 与 %ADR 的距离显示。 亮点 基于市场结构的自动止损识别 • 根据市场结构与实时价格行为自动识别关键止损位置。 智能突破适应能力 • 能适应突破与快速方向变化,不会强迫过早调整止损。 SL %ADR 显示 • 显示止损距离占平均日波动范围 ADR 的百分比与 Smart Stop Scanner 完全一致帮助交易者即时识别紧密机会或已延伸的行情。 内置警报逻辑 • 当止损水平变为“new”、“valid”或“broken”时触发警报包含准确的状态切换与冷却逻辑。 破损级别的淡化显示 • 对于“broken”状态的方向、价格、S
OmniSync Projection
Antonio-alin Teculescu
5 (1)
Chronos Fractal Engine is an innovative price projection indicator for MetaTrader 5, designed to transform your technical analysis by intelligently identifying and projecting historical price patterns. Built upon an advanced correlation algorithm and the fractal principles of the market, this powerful tool visualizes potential future price movements, giving you a unique edge in your trading decisions. What is Chronos Fractal Engine? At its core, the Chronos Fractal Engine employs a sophisticat
RFI levels PRO MT5
Roman Podpora
3.67 (3)
该指标能够准确显示反转点和价格回落区域。     行业领军人物 。您能洞察新趋势的形成,并以最高的精准度做出决策,掌控每一笔交易。 VERSION MT4     -    与……结合时,展现其最大潜力     趋势线专业版   指标 该指标显示的内容: 新趋势开始时的反转结构和反转水平及其激活。 显示屏   获利了结   和   止损   风险回报比最低的水平     RR 1:2       。 具有智能减值逻辑的止损。 显示指定指标中两种趋势类型的反转形态。 指标: 根据     趋势线     (全球趋势变化) 潮流专业版     (趋势快速变化) 简单有效   扫描器   实时趋势(新增)。 多时间框架工具筛选。 展示   利润   在 LOGIC AI 信号之后。 以下列出今日走势积极的金融工具。(RB键) 能够为终端启用通知(警报)功能,并向移动设备推送通知。 逻辑人工智能     — 利用人工智能寻找最佳切入点。 只有在启用 MTF(多时间框架分析)模式时,该功能才可用。 兼容性。 当与趋势线指标结合使用时,该指标能发挥其最大潜力。 这     RFI LEVELS
FX Power MT5 NG
Daniel Stein
5 (31)
FX Power:分析货币强度,助您做出更明智的交易决策 概述 FX Power 是一款专业工具,帮助您全面了解主要货币和黄金在任何市场条件下的真实强度。通过识别强势货币用于买入,弱势货币用于卖出, FX Power 简化了交易决策,并帮助您发现高概率的交易机会。不论您是想跟随趋势还是通过极端的 Delta 值预测反转,这款工具都能完美适应您的交易风格。别再盲目交易——用 FX Power 让您的交易更加智慧。 1. 为什么 FX Power 对交易者极具价值 实时货币和黄金强度分析 • FX Power 实时计算并显示主要货币和黄金的相对强度,助您全面了解市场动态。 • 监控领先或落后资产,轻松识别值得交易的货币对。 全面的多时间框架视图 • 跟踪短期、中期和长期时间框架的货币和黄金强度,以便将您的交易策略与市场趋势保持一致。 • 无论是快进快出的短线交易还是更长期的投资策略, FX Power 都能为您提供所需的信息。 Delta 动态分析用于趋势和反转 • 极端 Delta 值常常预示反转机会,而平缓的 Delta 变化则确认趋势延续。 • 使用 Delta 分析,轻
Azimuth Pro
Ottaviano De Cicco
5 (4)
上市促销 Azimuth Pro 前100位买家特惠价 299 美元。最终价格为 499 美元。 散户与机构入场的区别不在于指标,而在于位置。 大多数交易者在任意价格水平入场,追逐动量或对滞后信号做出反应。机构投资者等待价格到达供需真正转换的结构性水平。 Azimuth Pro 自动映射这些水平:波段锚定VWAP、多时间框架结构线,以及仅在高概率位置出现的ABC形态。 Azimuth Pro 专为需要结构分析和智能自动化的专业交易者打造。 Azimuth 以外科手术般的精度映射市场结构,而Azimuth Pro增加了智能层:自动检测您的交易风格、智能配置的移动平均线,以及经过20年数据回测优化的参数。结果是专业级分析自动适应您的交易品种和时间框架。 这是我们Merkava Labs每天为自己和客户使用的指标。 PRO版本的独特之处 智能配置 Pro版本理解您的交易环境。将它放在EURUSD M15上,它知道您在做日内交易。放在BTCUSD H4上,它会调整为波段交易。无需手动调整。 自适应移动平均线 标准EMA有效。但ATR自适应StepMA(响应波动率)和动
Crystal Heikin Ashi Signals
Muhammad Jawad Shabir
5 (1)
Crystal Heikin Ashi Signals - Professional Trend & Signal Detection Indicator Advanced Heikin Ashi Visualization with Intelligent Signal System for Manual & Automated Trading Final Price: $149 ---------> Price goes up $10 after every 10 sales . Limited slots available — act fast . Overview Crystal Heikin Ashi Signals is a professional-grade MetaTrader 5 indicator that combines pure Heikin Ashi candle visualization with an advanced momentum-shift detection system. Designed for both manual traders
ARIPoint
Temirlan Kdyrkhan
ARIPoint is a powerful trading companion designed to generate high-probability entry signals with dynamic TP/SL/DP levels based on volatility. Built-in performance tracking shows win/loss stats, PP1/PP2 hits, and success rates all updated live. Key Features: Buy/Sell signals with adaptive volatility bands Real-time TP/SL/DP levels based on ATR Built-in MA Filter with optional ATR/StdDev volatility Performance stats panel (Success, Profit/Loss, PP1/PP2) Alerts via popup, sound, push, or email Cu
RelicusRoad Pro MT5
Relicus LLC
5 (24)
RelicusRoad Pro: 量化市场操作系统 终身访问限时 70% 折扣 - 加入 2,000+ 交易员社区 为什么大多数交易者即使拥有“完美”指标也会失败? 因为他们在真空中交易 单一概念 。没有背景的信号是赌博。要持续获胜,您需要 共振 (CONFLUENCE) 。 RelicusRoad Pro 不是一个简单的箭头指标。它是一个完整的 量化市场生态系统 。它描绘价格运行的“公允价值之路”,区分市场噪音和真实的结构性突破。 停止猜测。开始用机构级“路”逻辑进行交易。 核心引擎:“Road” (路) 算法 系统的核心是 Road Algo ,一个实时适应市场条件的动态波动率通道。它投射出 安全线 (平衡) 和价格可能反转的 扩展水平 。 Simple Road: 典型市场的标准结构映射。 Smooth Road: 针对震荡盘整的降噪计算。 Breakout Road: 专为识别波动率扩张和爆发性走势而调整。 1. 算法动量与确认 我们的“剥头皮箭头”不只是简单的交叉。它们利用 高阶多项式逻辑 过滤噪音,确保信号与主周期一致。我们检测动量、价格行为和 Road 结构汇聚的精确入场
Entry Points Pro for MT5
Yury Orlov
4.48 (138)
这款指标用于 MT5,可提供准确的入场交易信号,且无重绘。 它可应用在任何金融资产:外汇、加密货币、贵金属、股票、指数。 它将提供极其精准的评估,并告诉您何时开仓和平仓的最佳时机。 观看 视频 (6:22),其中包含一个仅处理单一信号的示例,该信号即可值回指标购价! 大多数交易者在 Entry Points Pro 指标的帮助下,在第一个交易周内即改善了他们的交易结果。 订阅我们的 Telegram 群 ! Entry Points Pro 指标的益处。 入场信号无重绘 如果信号出现,并得到确认,则它不会再消失;不像是重绘指标,它会导致重大的财产损失,因为它们可以在显示信号后再将其删除。 无差错开仓 指标算法可令您找到入场交易(买入或卖出资产)的理想时机,从而提高每位交易者的成功率。 Entry Points Pro 可操作任何资产 它允许您在 MT5 平台上交易任何经纪商的加密货币、股票、贵金属、指数、大宗商品和货币。 提供任何方向的信号 Entry Points Pro 指标提供针对任意价格走势的入场交易信号 - 上涨、下跌或横盘(横向)。 最大盈利潜力 离场信号
Gold Sniper Scalper Pro
Ich Khiem Nguyen
3.78 (9)
Gold Sniper Scalper Pro 是一款专为检测 XAUUSD 上的 假突破 (false breakout)形态而构建的 MetaTrader 5 指标。它识别 4 根K线陷阱结构——价格突破区间边界、吸引突破交易者入场、然后反转回区间内部——确认该突破为虚假突破。指标通过 17 个质量因子对每个交易设置评分,经过 4 层汇流管道评估,对照 7 个时间框架趋势共识引擎验证,并通过黄金波动率状态分类器过滤——所有这些都在信号显示在图表之前完成。 详细的用户指南可在作者的   MQL5 博客   中找到。额外更新可通过作者的   MQL5 频道   获取。 根据当前的支持政策,购买者可能会获得作者开发的精选配套工具的额外使用权限。 该系统也适用于外汇货币对、指数和加密货币,但其检测参数、波动率处理和过滤器逻辑针对 XAUUSD 的特性进行了优化。 4 根K线假突破形态 检测引擎识别特定的四组件K线结构。Mother Bar 建立清晰的价格区间。一到三根 Inside Bar 在该区间内形成,压缩价格。False Breakout Candle 将价格推出边界——扫
FX Levels MT5
Daniel Stein
5 (13)
FX Levels:适用于所有市场的高精度支撑与阻力 快速概览 想要精准确定适用于任何市场(外汇、指数、股票或大宗商品)的支撑与阻力吗? FX Levels 将传统的“Lighthouse”方法与前沿的动态分析相结合,实现近乎通用的准确性。依托真实经纪商经验和自动化的每日与实时更新, FX Levels 帮助您捕捉价格反转点、设置合理的盈利目标,并自信地管理交易。立即使用,体验更准确的支撑/阻力分析如何助力您的交易更上层楼! 1. 为什么 FX Levels 对交易者非常有利 极度精准的支撑 & 阻力区 • FX Levels 专为不同经纪商提供的行情源和时间设置而设计,可生成几乎相同的价位区,解决数据不一致的常见问题。 • 这意味着无论您在哪里交易,都能获得稳定一致的水平线,为策略打下更加牢固的基础。 结合传统与先进技术 • 通过将久经考验的“Lighthouse”方法与动态分析相融合, FX Levels 不仅限于每日刷新,还可针对新的价格波动进行即时更新。 • 您可以选择经典的静态方式,或实时捕捉新出现的水平,以贴近最新的市场行为。 识别清晰的反转点 • FX Lev
Pips Stalker mt5
Abdulkarim Karazon
5 (1)
Pips Stalker是一种多头空头箭头型指标,该指标帮助各级别交易者做出更好的市场交易决策,该指标从不重新绘制,并以RSI作为主要信号逻辑,一旦给出箭头,它就不会重新绘制或反绘,箭头也不会延迟。 MT4版本<---- PIPS STALKER ARROW的功能 : 统计面板 一个独特的信息仪表盘,显示整体胜率百分比和有用统计数据,如连续最大胜负交易数,以及其他有用信息。 TP和SL,内置资金管理 该指标在每个箭头上都标注了TP和SL对象,因此交易者内置了资金和风险管理,SL基于ATR,TP基于当前ATR SL价值的风险与回报比。 无需重新涂色,高度可调 该指标提供了多种提升信号质量的选项,使其在任何交易对上都能正常工作,只需少量周期调整,面板会显示当前设置和期间是否有利可图。 推荐时间框架:M1。 重新调整启动资本:100美元。 推荐账户类型:原始价差。
FX Dynamic MT5
Daniel Stein
5 (5)
FX Dynamic:借助可定制的 ATR 分析,追踪波动率与趋势 概述 FX Dynamic 是一款强大的工具,通过计算平均真实波幅(ATR)来为交易者提供日内和日间波动性方面的深度见解。通过设置 80%、100%、130% 等关键波动率阈值,您可以快速识别潜在的盈利机会,或者在市场超出常规范围时及时得到预警。 FX Dynamic 可根据您经纪商的时区进行调整,帮助您保持一致的波动率衡量标准,并能与 MetaTrader 平台完美结合,实现实时分析。 1. 为什么 FX Dynamic 对交易者极具价值 实时 ATR 洞察 • 仅需一眼便可了解日间与日内波动水平。当价格触及或突破 80%、100%、130% 的 ATR 阈值时,会发出提示,让您知道市场是否达到临界水平。 • 在波动完全爆发前预判可能的衰竭或突破走势。 多市场通用 • 适用于外汇、商品、指数等多种资产。 FX Dynamic 可以自动识别经纪商时区,也可手动进行调整。 • 您可选择只专注于某一特定品种,或在多市场保持一致的 ATR 标准。 更智能的风险管理 • 利用 ATR 门槛来优化止损或止盈位置。当市场
Trend Lines PRO MT5
Roman Podpora
5 (1)
趋势线专业版 -     有助于了解市场真正转变的方向。该指标显示了真正的趋势反转点以及主要参与者重新入场的点位。 你看     BOS线路   无需复杂设置或不必要的干扰,即可在高时间框架内显示趋势变化和关键水平。信号不会重绘,并在K线收盘后仍保留在图表上。 MT4 版本   - 与 RFI LEVELS PRO 指示器结合使用时,可发挥其最大潜力 该指标显示的内容: 真正的转变   趋势线(BOS线) 一旦信号出现,它就始终有效!这与会重绘的指标有着重要的区别,后者可能会发出信号后又改变信号,从而导致资金损失。现在,您可以更精准、更准确地进入市场。此外,还有一个功能:在箭头出现后,K线会着色,直到达到目标价位(止盈)或出现反转信号为止。 重复条目   以及主要玩家的充值 为了提高寻找入场点时的视觉清晰度,我们创建了一个模块,该模块首先显示买入/卖出区域,并在该区域内寻找最佳入场点。此外,我们还加入了智能逻辑来管理止损位,该逻辑会随着时间的推移逐步降低止损位的大小,从而降低入场时的初始风险( 移动止损位 )。 信号强度水平     (BOS) 该指标采用三个显著性等级来衡量趋势变化
作者的更多信息
Trading Chaos Expert
Gennadiy Stanilevych
5 (11)
世界上没有本软件的同等产品,它代表一个覆盖交易信号的通用交易 "控制台",自动入场,设置止损和止盈,还有在单一窗口里同时进行多交易尾随终止。EA 的 "三次点击" 直观控制,确保在不同计算机上全方位使用所有功能,包括平板电脑。 与附加的信号指标交互来标记图标,给出实际市场的全貌,EA 令您做出正确的选择,以及在大多数情况下成为胜者一方。内置资金管理算法, 还有自动计算手数, 虚拟订单交易, 以及一些其它从崩溃账户里挽救交易者的 "诀窍"。它不是一个 "黑盒子"。而是一个深思熟虑的交易员的不可或缺的助理, 至少要尝试一次它的动作。 注,在面板上形成的 EA 不能在策略测试员中测试。可以在您的模拟账户里以实时模式检查它, 您可以下载本 EA 的免费版 - 混沌交易 EA 演示 。 EA 表现为一个面板,带有内置功能的交易机器人的,自动基于交易者可直观检查的交易信号入场,完全按照比尔·威廉姆斯的策略“混沌交易:第二版”和“新贸易维度”。在单独的窗口里,EA 识别价格走势的导向,用于指定品种和时间帧的全自动交易模式,也可以多品种并发。 它同时分析 MetaTrader 5“市场观察”窗口中显示
Modified Accelerator Oscillator
Gennadiy Stanilevych
5 (1)
本指标的主要目的是根据 "混沌交易, 第二版" 和 "新交易维度" 的描述,在加速振荡器的直方图里检测并标记交易信号。信号列表: 当指标直方条低于零轴此为做多信号。 当指标直方条低于零轴此为做空信号。 当指标直方条高于零轴此为做空信号。 当指标直方条高于零轴此为做多信号。  当指标直方条与零轴交叉此为做多信号。  指标包括一个信号块,用来方便地通知交易者任何新信号的形成。 本指标是基于 "混沌交易" 和 "新交易维度" 策略的复杂交易系统的一部分。本指标是形态的一部分。建议指标与以下产品配合使用: 混沌交易法 EA   混沌交易图表 新交易维度图表 改编的动量指标 识别 1 2 3 形态 波浪制造者 点差和利息监控 虚拟挂单突破做空 (混沌交易法 EA 的简化版本) 虚拟挂单突破做多 (混沌交易法 EA 的简化版本)
FREE
Trading Chaos Chart
Gennadiy Stanilevych
5 (1)
本指标的主要目的是根据 "混沌交易, 第二版" 策略,在图表里检测并标记交易信号。 带有角度的多头和空头背离柱线 (包括下蹲)。 柱线位于红色或绿色区域,是根据动量振荡器的直方条颜色。 图表上的下蹲柱线颜色独立于动量振荡器直方条。 "important" 级别的分形与鳄鱼指标的 "Teeth line" 相关。 绘制角度射线,是从平衡线至反转柱线。 第二智者和蓝光信号。 动量振荡器指标的 "区域里随后的第五根柱线" 信号。 本指标包括 新交易维度图表 指标的基本功能, 即以下: 检测并指示当直方条线穿越零轴时在图表上生成信号,以及相同方向上形成的蓝光特殊信号。 彩色柱线有三个区域 (红, 绿, 灰), 检测下蹲柱线。 为了切换 新交易维度图表 的功能, 将输入参数 Use new trading dimensions colors 设为 TRUE 值。 本指标根据 B. Williams 描述的策略专为 MetaTrader 5 开发。 图例: 蓝色柱线 - 下蹲柱线。 柱线之上的红星或绿星 - 柱线含有 "反向" 背离信号 (BDB)。 红色菱形或绿色菱形 - "第二智者" 信号。
Stairway
Gennadiy Stanilevych
4.75 (4)
The multi-timeframe indicator of the levels of the Pivot Points. Every closed daily period has its own so-called reference point - Pivot Point, which sets the levels for smaller intraday timeframes for the following day. The Pivot Points indicators existing in the codes have no method of showing the dynamics of the pivot point changes on the historical data of the price chart. Pivot Point calculation formula. Pivot=(High + Low + Close) /3 High — the maximum of the previous day; Low — the minimum
FREE
Fractal breakout level
Gennadiy Stanilevych
Purpose and functions of the indicator The indicator determines and marks the moments of trend change on the chart based on the theory of fractal levels breakout on any of the analyzed timeframes. If a breakout based on all rules is valid, a horizontal line with corresponding color will appear on the chart. If there is an uptrend, the line will be blue. In the descending trend, the line will be red. The blue line is a strong support level, the trader should look for buying opportunities above th
FREE
Fifth dimension
Gennadiy Stanilevych
5 (2)
The indicator looks for the "Fifth dimension" trade signals and marks them on the chart. A detailed description of the chart patterns that generate the trade signals can be found in Chapter 8 "The Balance Line Trades" in the book Williams' "New Trading Dimensions". Signal levels with indication of the position entry or stop loss placement price are indicated directly on the chart. This feature creates additional convenience for the trader when placing pending orders. A solid horizontal line is d
FREE
Modified Bollinger Bands
Gennadiy Stanilevych
The standard Bollinger Bands indicator has been improved by integrating additional indications from the Standard Deviation indicator (StdDev), which gives an additional filter for confirming trading signals. In addition, the color of the indicator's lines shows the beginning of a trend, its development and exhaustion. This indicator has a signal block that notifies the trader of the beginning of the trend on any time frame to which it is attached. Settings Type of messages - select the type of
FREE
Spread and Swap monitor
Gennadiy Stanilevych
5 (1)
本指标的目的是判断点差和利率大小,以及按照存款货币每一个点的风险,设置从当前价位计算的止损距离。 本指标告知交易者有关金融工具在每个时段之间转换时可能的额外费用和利润。它还告知有关的点差和挂单的距离,从当前价位的尾随止损位。此外,指标告知交易者有关存款货币每一个点的风险。 信息被显示在图表下方的单独子窗口里。它可以避免图表被不同的信息塞满。点差和利率监控指标适合任何自定义模板。
Iranger
Gennadiy Stanilevych
Description The indicator based on Average True Range (ATR) is designed to accurately determine the possible range of price fluctuations on a selected timeframe. This tool is ideal for both beginner traders and experienced professionals looking to effectively plan their trades. Key Features: Displays possible price fluctuation levels on the chart, simplifying visual analysis. Utilizes the power of the ATR algorithm to calculate precise volatility values. Adapts to any timeframe, providing releva
FREE
Slider profy
Gennadiy Stanilevych
The idea of ​​enhancing the free Slider utility appeared after the release of a lite version of the EA trade panel Trading Chaos Expert Lite , which operates in the Current Chart mode without the possibility to maintain trades of several symbols in a single window. The purpose of Slider profy Ease search for trading signals by automatic display of charts of currency pairs from the "Market Watch" one by one at a specified interval of time in seconds. Automation of one-click placing of pending ord
FREE
Lifebuoy
Gennadiy Stanilevych
The script analyzes all trading instruments listed in the Market Watch of the MT5 platform to assess their suitability for trading on the timeframes specified in the settings. Based on the analysis, the script displays a table, where trading instruments deemed suitable and recommended for trading are marked in green, based on their compliance with the risk-to-reward ratio coefficient, including the spread (default 1:3). Instruments not recommended for trading are marked in red.
FREE
Slider
Gennadiy Stanilevych
This is a utility created to ease charts watching on tablet PCs. The indicator allows you automatically alternately display "slide show" of all currency charts from "MarketWatch". The user can set the display time interval (in seconds) between charts in indicator settings. In addition, there is an option of selecting the angle of Start/Stop button which starts and stops the display of charts. This function is very useful if a trader noticed a trading signal and would like to study it in more det
FREE
Modified Awesome Oscillator
Gennadiy Stanilevych
5 (2)
本指标的主要目的是根据 "混沌交易, 第二版" 和 "新交易维度" 策略,在动量振荡器的直方图里检测并标记交易信号。 本指标检测并标记以下交易信号: "双峰" - 背离。 信号 "第二智者" - 动量振荡器连续三根柱线之后颜色改变。 直方条与零轴交叉。 信号 "飞碟"。 指标包括一个信号块,用来方便地通知交易者任何新信号的形成。 本指标是基于 "混沌交易" 策略的复杂交易系统的一部分。本指标是形态的一部分。建议指标与以下产品配合使用: 混沌交易法 EA 混沌交易图表 新交易维度图表 改编的加速振荡器 识别 1 2 3 形态 波浪制造者 点差和利息监控 虚拟挂单突破做空 (EA 的简化版本) 虚拟挂单突破做多 (EA 的简化版本)
Auto Format
Gennadiy Stanilevych
这是一款实用程序,用于图表的自动缩放,可使至少 140 根柱线可见。根据 Bill Williams 的 "混沌交易法" 策略,这是正确分析波浪所必需的。此实用程序可用于 МetaТrader 5 上的所有时间帧。 它在计算开始的第一根柱线位置绘制一条垂线。这条线可以让您看到在图表上充足的柱线,以及波浪序列的可能起始点。它也使得在选定时间帧内显示金融工具的历史价格波浪的标签更加容易。 指标可以自动选择能够容纳 140-150 根柱线所需要的较低时间帧。为此,在图表上使用矩形选择图上所需要的区域,然后鼠标双击矩形边框。该指标会自动选择波浪分析所需的适合时间帧。要返回到初始时间帧,点击 MetaTrader 5 界面上的相应按钮,并使用 "删除" 来删除对象。 建议保存指标至模板,以及 MetaTrader 5 中包含的其它标准 Bill Williams 指标,或在 MQL5 市场里提供的它们的模拟品。亦即以下产品: 混沌交易图表 改编的动量指标 改编的加速振荡器 混沌交易法 EA
Short term extremum
Gennadiy Stanilevych
5 (1)
The indicator determines and marks the short-term lows and highs of the market on the chart according to Larry Williams` book "Long-term secrets to short-term trading". "Any time there is a daily low with higher lows on both sides of it, that low will be a short-term low. We know this because a study of market action will show that prices descended in the low day, then failed to make a new low, and thus turned up, marking that ultimate low as a short-term point. A short-term market high is just
Alligator modified
Gennadiy Stanilevych
5 (4)
The MT5 platform indicator has standard settings and requires no modifications when connected to the chart. Modifying the indicator involves adding two functions: Marking the area when the indicator lines are in the correct sequence (green line above or below red and blue lines, and red above or below blue). This creates a confirmed cross marked by the closing price to avoid false signals during the Alligator lines' entanglement periods. Drawing horizontal rays from market structure break levels
Stop close only
Gennadiy Stanilevych
The script in the form of an expert is created for the possibility of automatic installation of pending orders of the Stop Close Only type, which are not in MT5 by default. This type of order implies entering a long position in case the price closes above a given price level and opening a short position if the price closes below the price set by the trader. At the same time, level breakouts are not taken into account. The expert indicates the levels on the chart with lines, overcoming which will
筛选:
pinheirotrade
20
pinheirotrade 2025.10.18 18:05 
 

Hello! Congratulations on the excellent indicator. Could you make the source code available so I can extend it?

Rafal Krzysztof Manuszewski
2387
Rafal Krzysztof Manuszewski 2024.09.13 18:30 
 

helpful indicator

Jerrycuellar
134
Jerrycuellar 2024.01.27 13:29 
 

Es muy bueno se debe manejar muy bien las entradas aprovechando un buen tp gracias

Aziz Ahmad
174
Aziz Ahmad 2024.01.05 20:46 
 

Hello, the indicator is very good, I would suggest putting a sound warning in the program when the green and red lines start on the graph

Michael-MT5
449
Michael-MT5 2023.12.17 09:32 
 

用户没有留下任何评级信息

mohamad.H Valipour
296
mohamad.H Valipour 2023.12.15 08:53 
 

用户没有留下任何评级信息

FELICE TRANI
18
FELICE TRANI 2023.10.07 10:18 
 

THX for sharing the indicator. Very very good!

Andres Felipe Valencia Garcia
124
Andres Felipe Valencia Garcia 2023.08.11 02:56 
 

用户没有留下任何评级信息

Gennadiy Stanilevych
52871
来自开发人员的回复 Gennadiy Stanilevych 2023.08.11 04:25
Thank you, mate!
Mustafa Nail Sertoglu
1102
Mustafa Nail Sertoglu 2023.07.24 08:27 
 

THX for sharing free , looking to get advice sometimes..

Gennadiy Stanilevych
52871
来自开发人员的回复 Gennadiy Stanilevych 2023.07.24 12:26
please ask. If I can, I will definitely help.
amin13eko
434
amin13eko 2023.06.17 04:42 
 

用户没有留下任何评级信息

Clemildes Horta
287
Clemildes Horta 2023.06.07 09:17 
 

Excelente indicador. Parabens e obrigado por compartilhar.

Evgen0926
44
Evgen0926 2023.05.15 07:20 
 

The indicator is not optimized. If you put it on more than 5 graphs, the computer processor loads completely and the system hangs.

Kittisak Waipattama
168
Kittisak Waipattama 2023.04.13 17:31 
 

The indicator is really working well.Thanks for sharing at free., Do you have a version for mobile phone?

Abbey166
384
Abbey166 2023.03.22 00:18 
 

!! The indicator is really working well.Thanks for sharing at free!!!!

Jose Berrio
45
Jose Berrio 2023.02.04 01:06 
 

Excelente indicador! me ha servido mucho para analizar junto con el contexto, posibles entradas y salidas. Altamante recomendado. Gracias por contribuir con él.

volga99
145
volga99 2023.01.31 18:37 
 

спасибо.отличный индикатор.супер.

LittleBig100
27
LittleBig100 2022.09.12 17:48 
 

Thank you for sharing

Sihle Gumede
24
Sihle Gumede 2022.07.21 13:04 
 

I find this indicator very useful, well all of them are, you just need to find one that fits your trading lifestyle.

migelhenri
64
migelhenri 2022.07.19 12:50 
 

Bom indicador. Parabéns e obrigado pela partilha.

max zotov
70
max zotov 2022.04.26 13:55 
 

Thats good display. Супер.

Хотелось чтоб во вкладке цвета, меняя толщину линий, линии на графике тоже становились крупнее.

Так лучше видно сигналы. Сигналы 100% надо сделать крупнее

спс автору

123
回复评论