Dynamic Scalper System
- Göstergeler
- Sürüm: 2.10
- Güncellendi: 9 Nisan 2026
- Etkinleştirmeler: 10

"Dynamic Scalper System" göstergesi, trend dalgaları içinde işlem yapmak için scalping yöntemi için tasarlanmıştır.
Başlıca döviz çiftleri ve altın üzerinde test edilmiştir, diğer işlem araçlarıyla uyumluluğu mümkündür.
Ek fiyat hareketi desteğiyle trend boyunca pozisyonların kısa vadeli açılması için sinyaller sağlar.
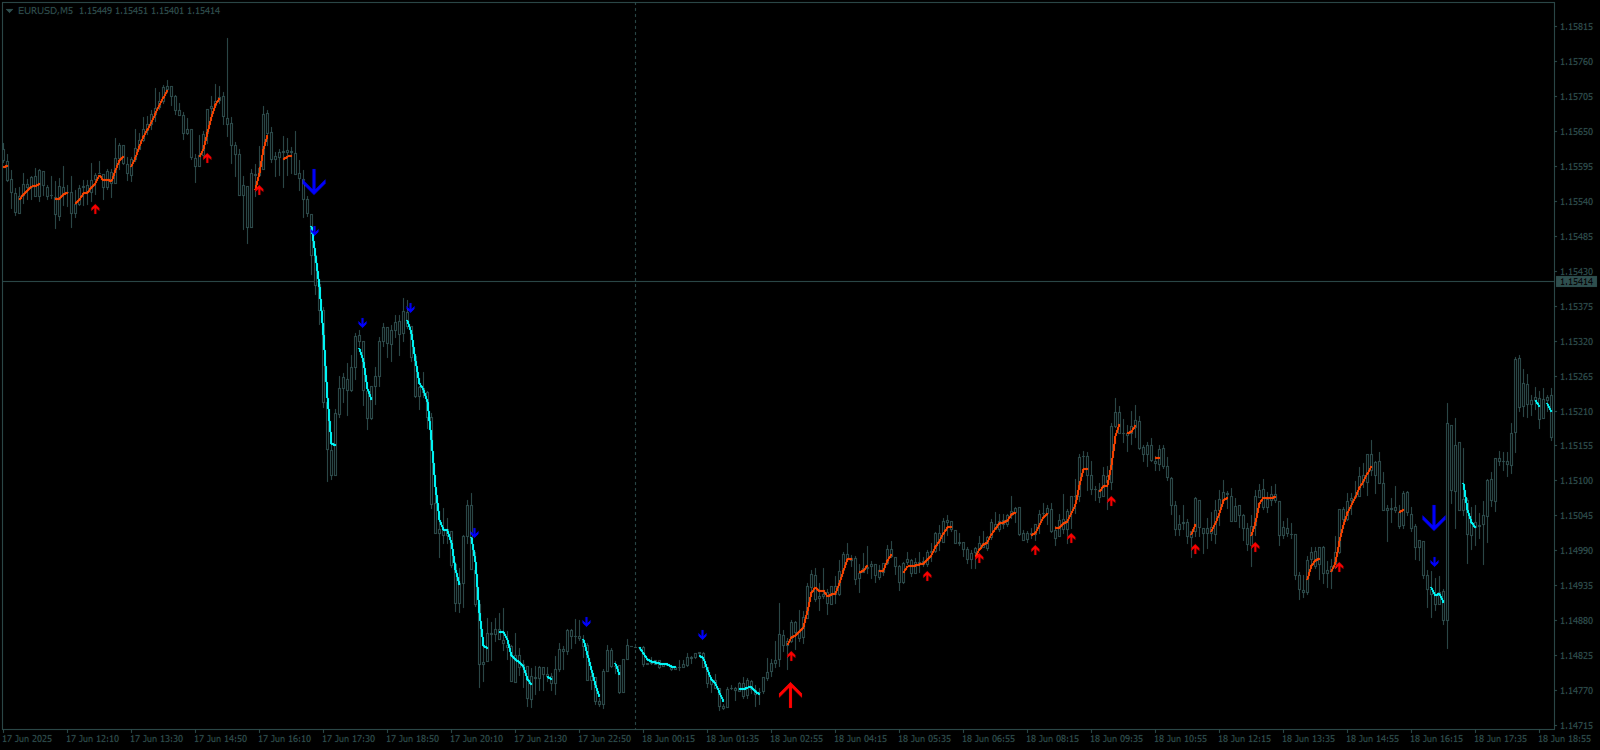
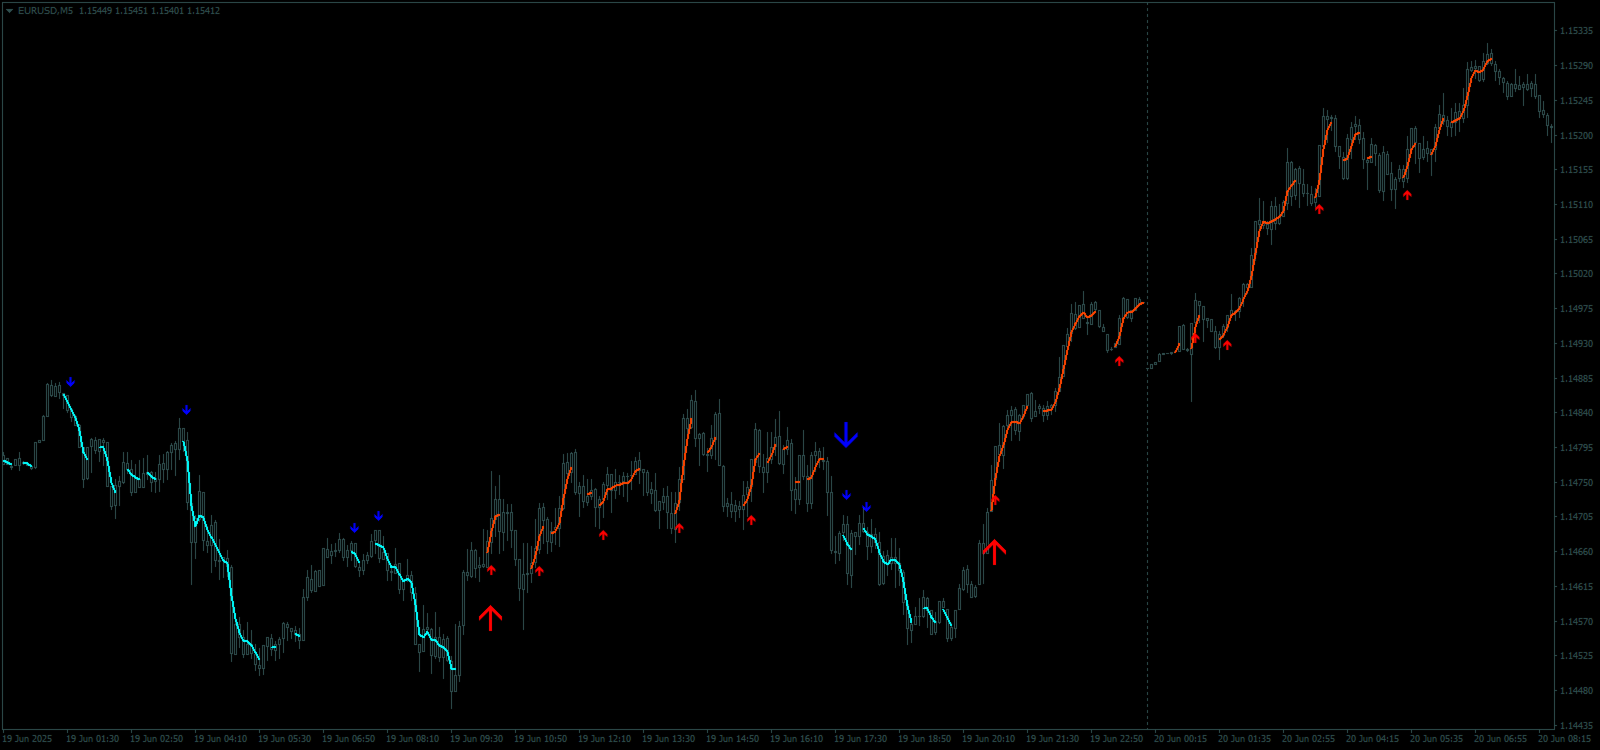
Göstergenin prensibi.
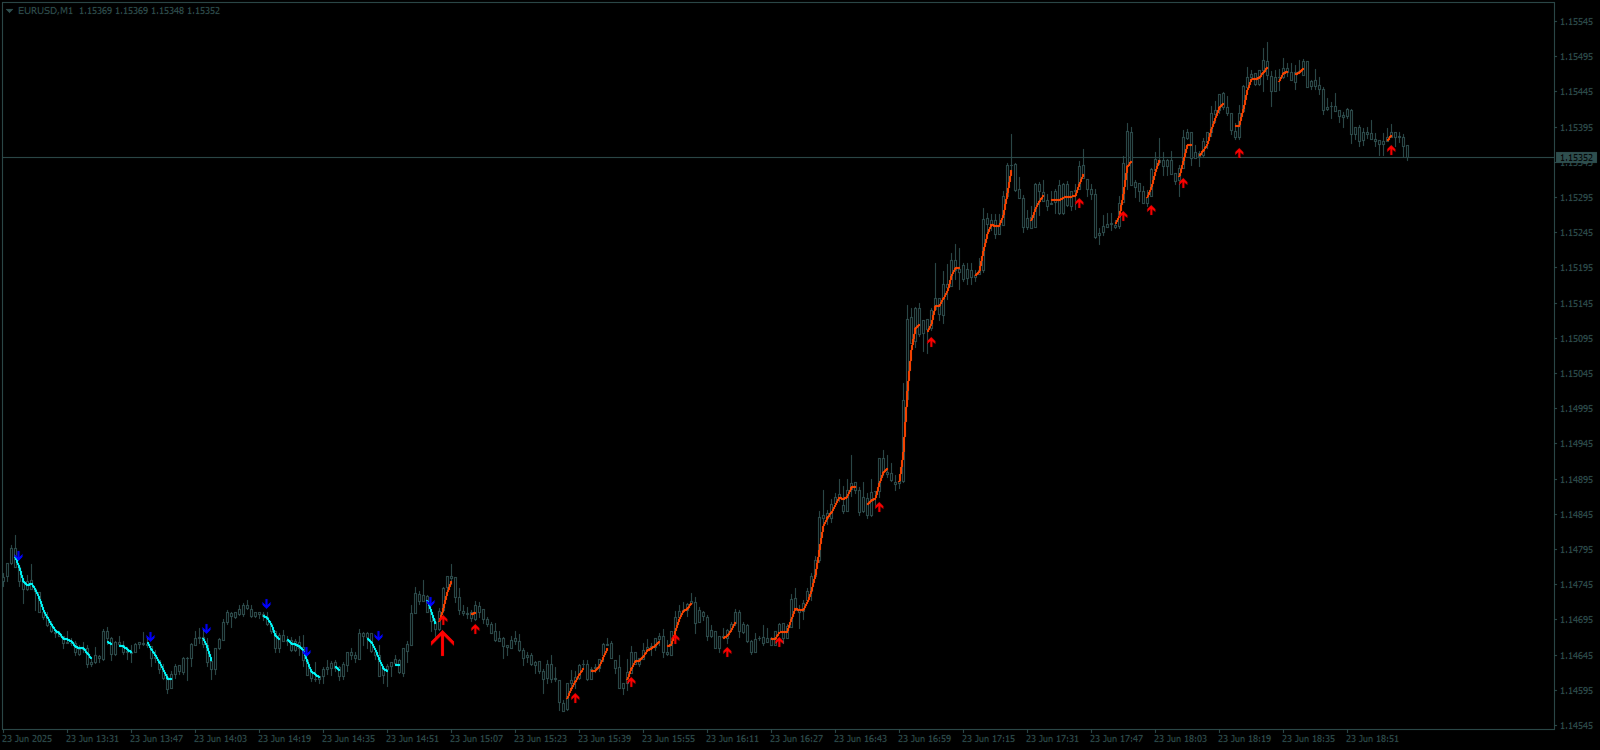
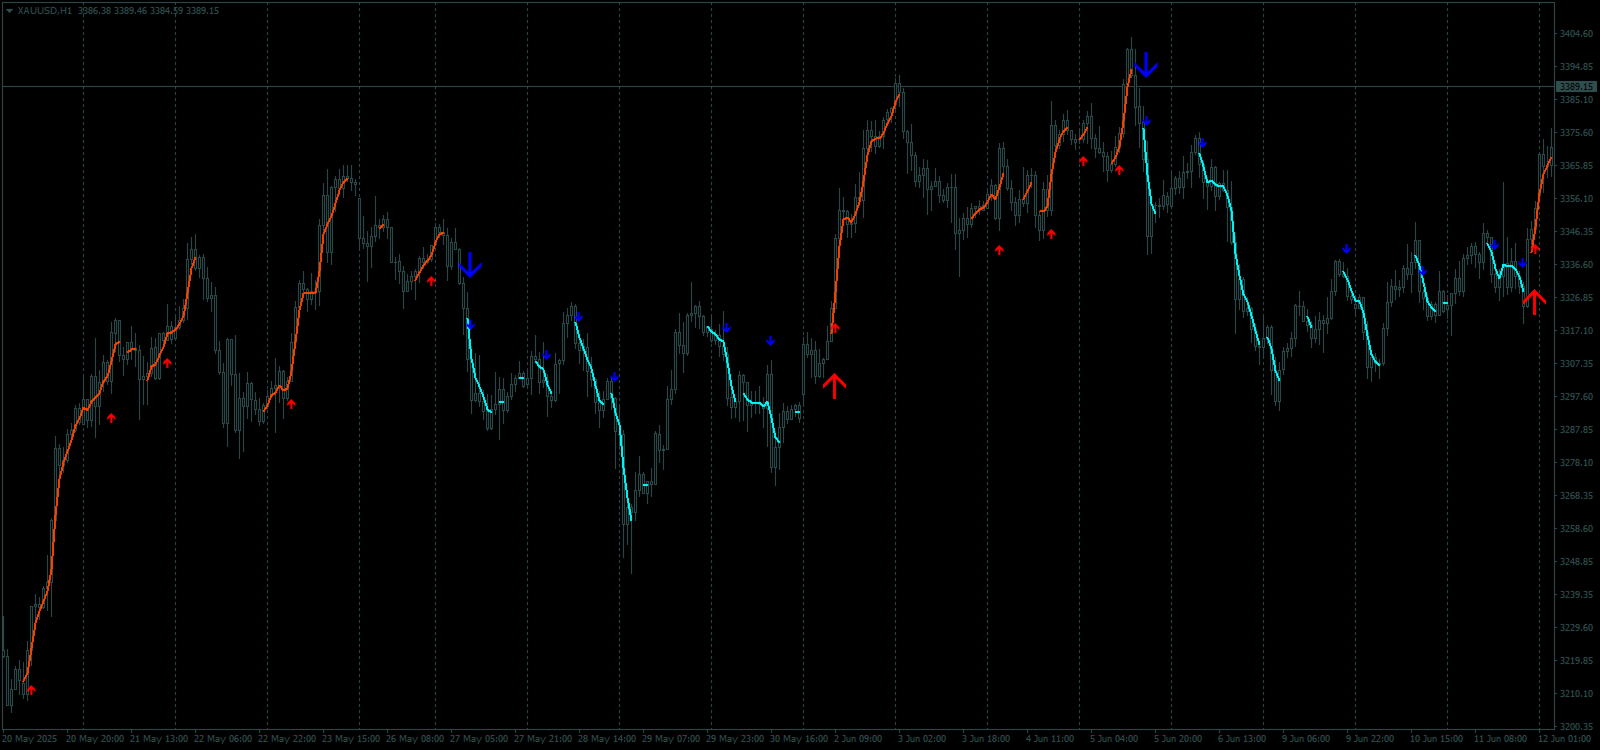
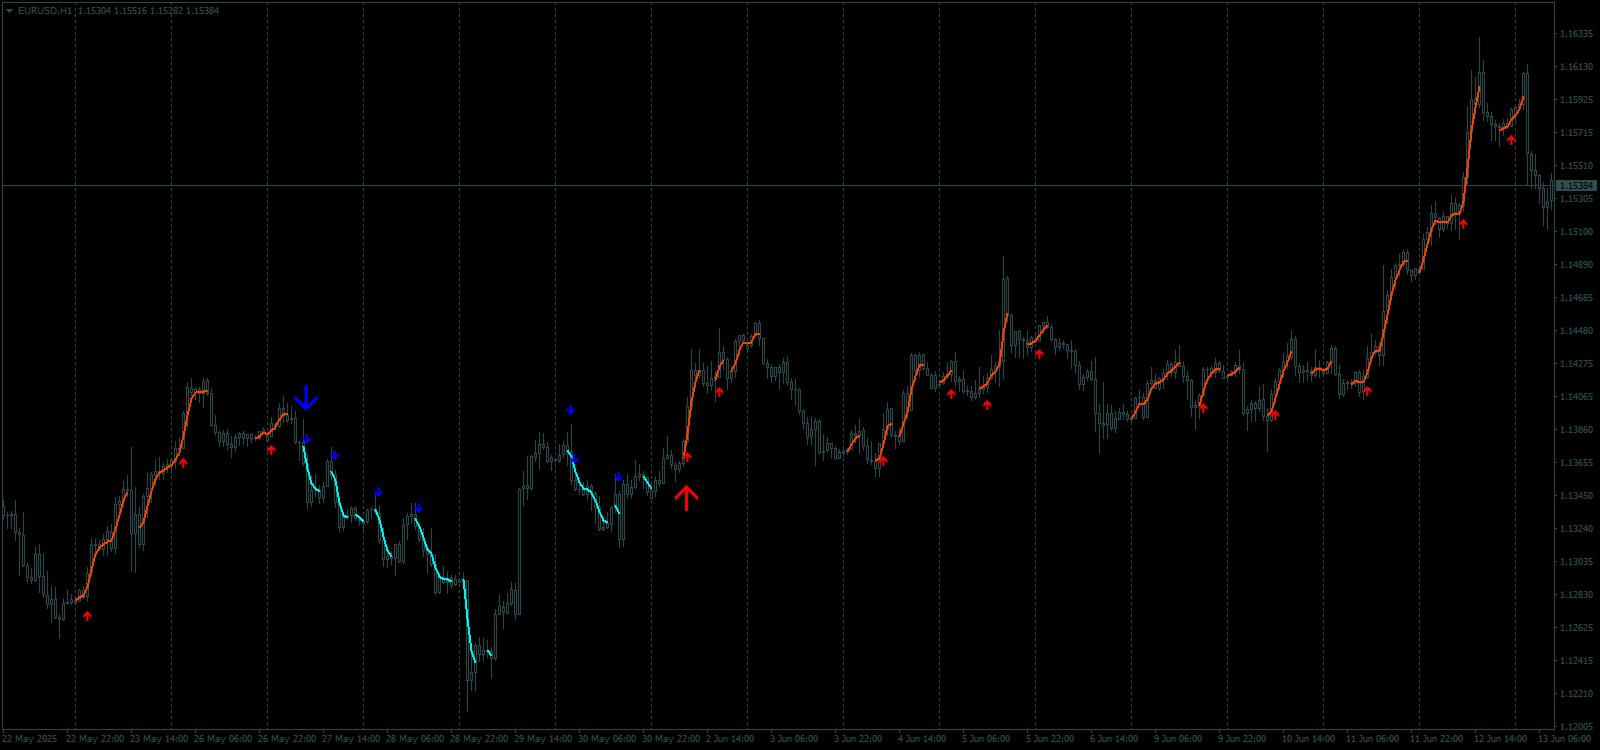
Büyük oklar trend yönünü belirler.
Küçük oklar şeklinde scalping için sinyaller üreten bir algoritma trend dalgaları içinde çalışır.
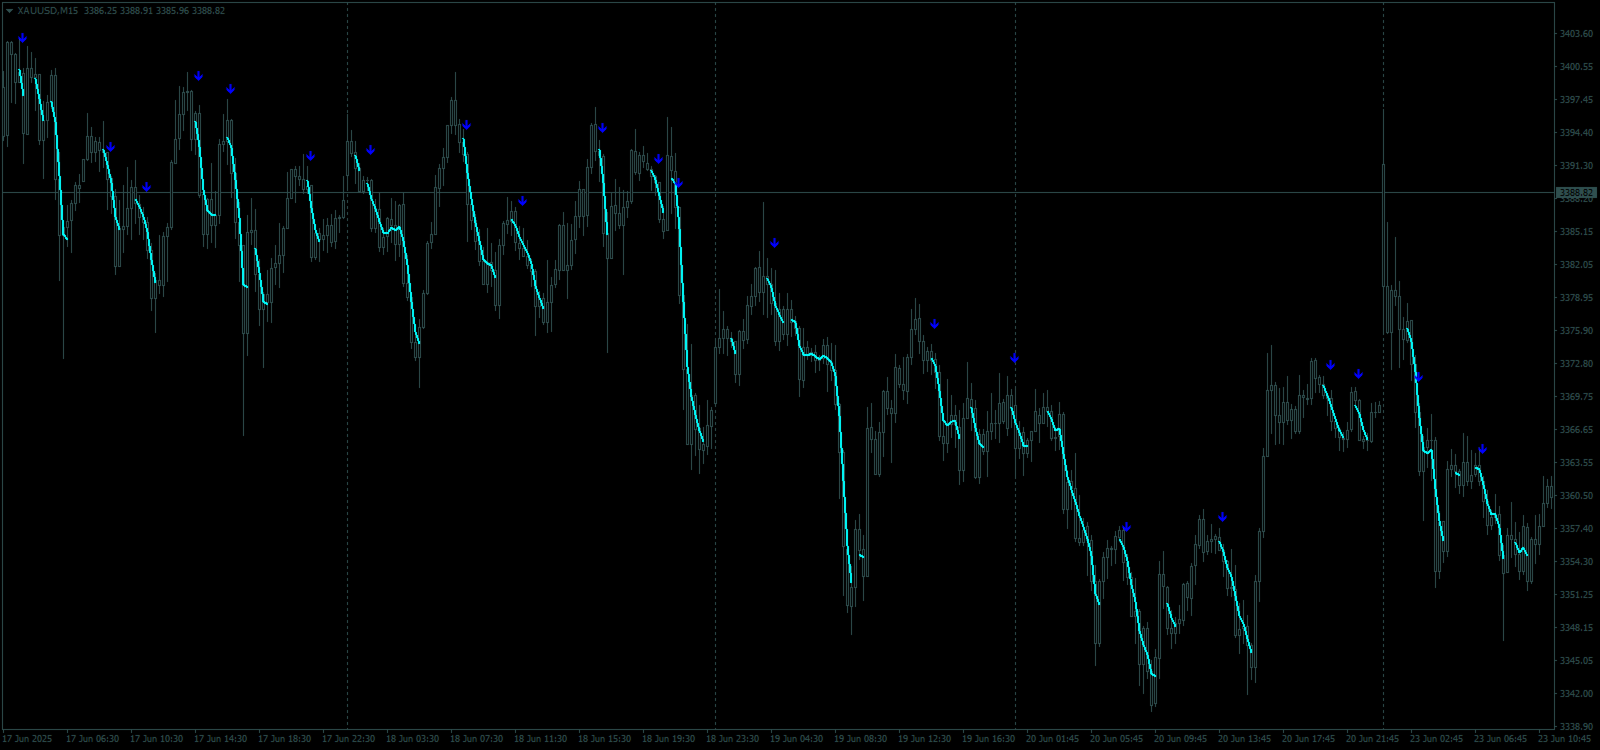
Kırmızı oklar yükseliş yönü, Mavi oklar düşüş yönü içindir.
Hassas fiyat hareketi çizgileri trend yönünde çizilir, küçük okların sinyalleriyle birlikte hareket ederler.
Sinyaller şu şekilde çalışır: çizgiler uygun anlarda göründüğünde, giriş sinyalleri oluşturulur, çizgiler varken açık pozisyonlar tutulur ve tamamlandığında işlemden çıkılır.
Çalışma için önerilen zaman dilimleri M1 - H4'tür.
Oklar mevcut mum üzerinde oluşturulur, bir sonraki mum açılmışsa, bir önceki mum üzerindeki ok yeniden çizilmez.
Giriş parametreleri
Trend Wave Period - Trend yönünün dönemi (büyük oklar), trend dalgalarının zaman aralığını değiştirir. Değer 1, yönün en uzun süresidir, parametrede bir artışla süre azalır.
Scalper Arrows Period - Sinyal oklarının hesaplama dönemi (küçük oklar), giriş için sinyallerin üretim sıklığını değiştirir. Değer 3, en sık üretimdir, parametrede bir artışla okların sıklığı azalır ve doğruluk artar.
Parametreler farklı zaman dilimleri ve işlem araçları için değiştirilebilir. Tüm sinyaller için uyarılar vardır.
Başlıca döviz çiftleri ve altın üzerinde test edilmiştir, diğer işlem araçlarıyla uyumluluğu mümkündür.
Ek fiyat hareketi desteğiyle trend boyunca pozisyonların kısa vadeli açılması için sinyaller sağlar.
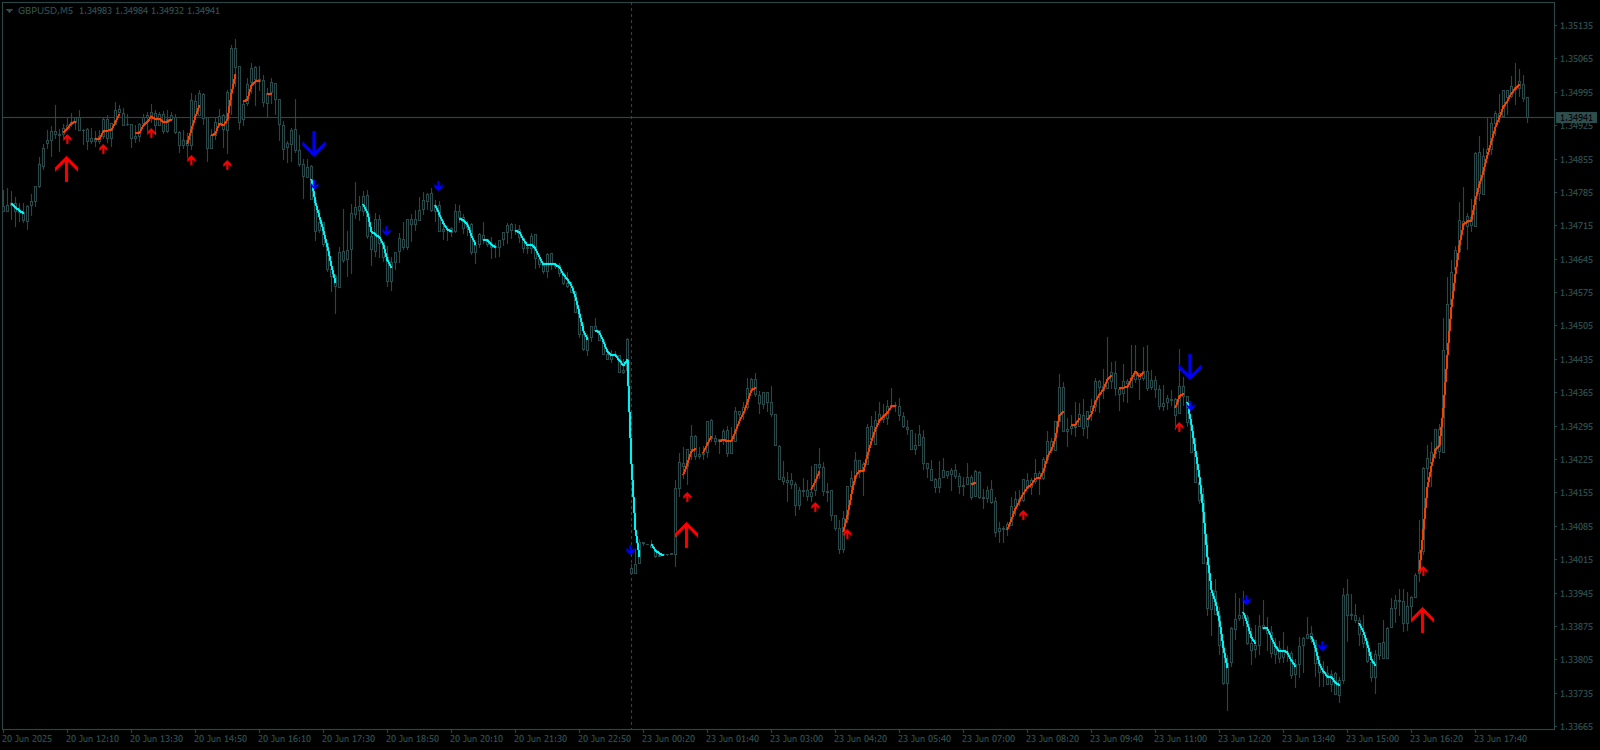
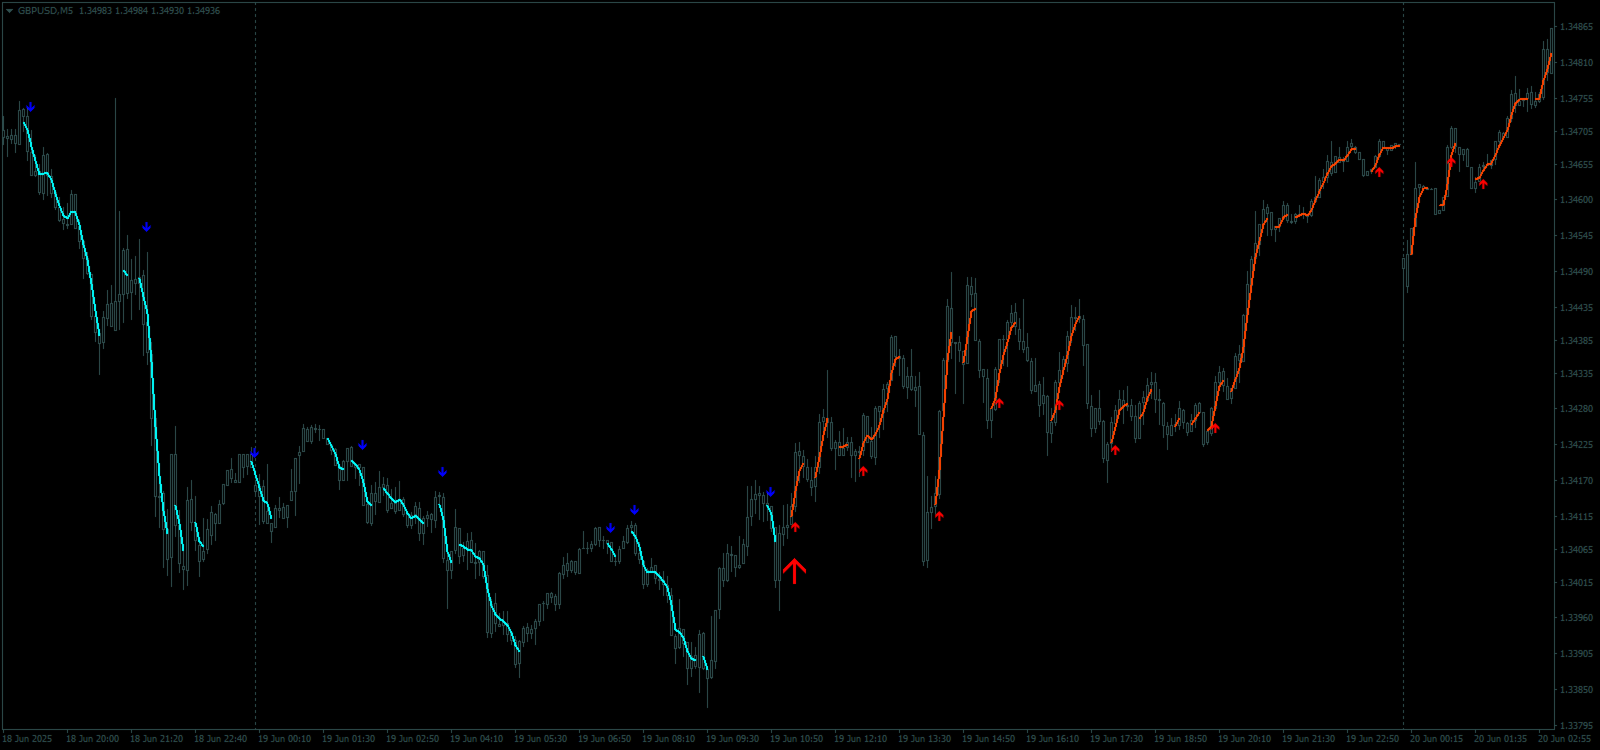
Göstergenin prensibi.
Büyük oklar trend yönünü belirler.
Küçük oklar şeklinde scalping için sinyaller üreten bir algoritma trend dalgaları içinde çalışır.
Kırmızı oklar yükseliş yönü, Mavi oklar düşüş yönü içindir.
Hassas fiyat hareketi çizgileri trend yönünde çizilir, küçük okların sinyalleriyle birlikte hareket ederler.
Sinyaller şu şekilde çalışır: çizgiler uygun anlarda göründüğünde, giriş sinyalleri oluşturulur, çizgiler varken açık pozisyonlar tutulur ve tamamlandığında işlemden çıkılır.
Çalışma için önerilen zaman dilimleri M1 - H4'tür.
Oklar mevcut mum üzerinde oluşturulur, bir sonraki mum açılmışsa, bir önceki mum üzerindeki ok yeniden çizilmez.
Giriş parametreleri
Trend Wave Period - Trend yönünün dönemi (büyük oklar), trend dalgalarının zaman aralığını değiştirir. Değer 1, yönün en uzun süresidir, parametrede bir artışla süre azalır.
Scalper Arrows Period - Sinyal oklarının hesaplama dönemi (küçük oklar), giriş için sinyallerin üretim sıklığını değiştirir. Değer 3, en sık üretimdir, parametrede bir artışla okların sıklığı azalır ve doğruluk artar.
Parametreler farklı zaman dilimleri ve işlem araçları için değiştirilebilir. Tüm sinyaller için uyarılar vardır.

Super indicator help more for enter , is simple and very strong , support is very nice and author is special person