MTF Non Repaint Arrow Five Moving Average RTD

[V 1.00] MTF NRPA 5 Hareketli Ortalama RTD yayınlandı!

Yeniden boyanmayan ok gerçek zamanlı pano.

En iyi hareketli ortalama göstergesini arıyorsanız, doğru sayfadasınız. Genellikle insanlar iki hareketli ortalama kuracaktır çünkü iki hareketli ortalamanın kesişimi (çaprazlama) bir sonraki fiyat eğiliminin yönünü belirleyecektir. Hızlı hareket eden ortalama, yavaş hareket eden ortalama ile kesişiyorsa ve hızlı> yavaş ise, trend yukarıdır. Tersine, hızlı hareket eden ortalama, yavaş hareket eden ortalama ve hızlı < yavaş ile kesişirse, trend aşağıdır. İki hareketli ortalamanın dezavantajı, uzun vadeli eğilimi görememenizdir. Bu ticaret aracını bu yüzden geliştirdim.

İşte nasıl açıklandığı:

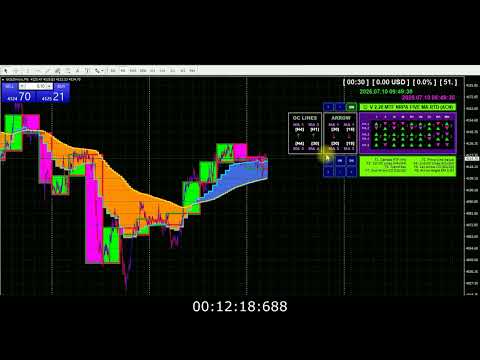
Bu ticaret aracında beş hareketli ortalama kullanıyorum. Evet, beş! Varsayılan olarak, MA 1 ve MA 2'yi H1 olan geniş bir zaman dilimine ayarlıyorum. MA 1 ve MA 2'nin kesişmesi, H1 zaman diliminde bir trend değişikliği olduğu anlamına gelir. Ardından MA 3 ve MA 4'ü geçerli zaman diliminde (küçük) ayarlıyorum, örneğin M5'teki grafiği açıyorsunuz. MA 3 ve MA 4'ün kesişmesi, mevcut zaman diliminde (M5) bir trend değişikliği olduğu anlamına gelir. Ardından trend hareketini doğrulamak için MA 5'i mevcut zaman dilimine ayarlıyorum.

Bu ticaret aracında birçok harika şey var:

Beş MA'nın zaman dilimlerini beğeninize göre değiştirebilirsiniz. Çizgi stilini değiştirebilir, renk stilini değiştirebilir, MA kesişme oku türünü değiştirebilir ve MA parametrelerini istediğiniz gibi değiştirebilirsiniz. Daha da iyisi, beş MA'nın gerçek zamanlı 9TF pano monitörüdür. Uygulanacak 10 pano renk şeması vardır. Tamam, şimdi kontrol panelinin içindeki sembolü açıklayayım. İki tür sembol vardır. Üçgen sembolü (yukarı ve aşağı) ve ok sembolü (yukarı ve aşağı). Kireç rengi üçgen sembolü, MA açısının pozitif olduğunu, yani trendin yukarı olduğunu gösterir. Kırmızı renkli üçgen sembolü ise MA açısının negatif olduğunu yani düşüş trendi olduğunu gösterir. Ayrıca MA 1'in MA 2'nin üstünde mi altında mı olduğunu, MA 3'ün MA 4'ün üstünde mi altında mı olduğunu gözlemleyebilirsiniz. Bu durum yukarıyı veya aşağıyı gösteren ok simgesinden de görülebilir. Ve dahası var. Düğme özelliği. Düğmeye tıklayarak, bu göstergeyi tek bir tıklama ile gizleyebilir veya gösterebilirsiniz!

Bu gerçekten sahip olmanız gereken bir ticaret aracıdır.

Fiyat yükselmeden önce bu ticaret aracını satın almak için acele edin!

Güvenli girişler yapın ve bir profesyonel gibi ticaret yapın.

Teşekkür ederim.

#hareketliortalama #hareketliortalamaticaretstratejisi #üstel #ticaretgöstergeleri #tradingforex #tradingipuçları #en iyigösterge
Önerilen ürünler
Indicator for binary options arrow is easy to use and does not require configuration works on all currency pairs, cryptocurrencies buy signal blue up arrow sell signal red down arrow tips do not trade during news and 15-30 minutes before their release, as the market is too volatile and there is a lot of noise it is worth entering trades one or two candles from the current period (recommended for 1 candle) timeframe up to m 15 recommended money management fixed lot or fixed percentage of the depo
Zig Zag Robot: A Comprehensive Reversal Trading System The Zig Zag Robot is a powerful tool designed to accurately identify key market reversals and filter out market "noise." It goes beyond a simple Zig Zag indicator by combining multiple tools and built-in logic to provide you with ready-to-use trading signals and help you make more informed decisions. How It Works The indicator uses a multi-level approach to market analysis, which allows it to find high-probability entry points: Signal Filter
The new update makes this indicator a complete tool for studying, analyzing and operating probabilistic patterns. It includes: On-chart Multi-asset percentage monitor. Configurable martingales. Twenty-one pre-configured patterns , including Mhi patterns and C3. An advanced pattern editor to store up to 5 custom patterns. Backtest mode to test results with loss reports. Trend filter. Hit operational filter. Martingale Cycles option. Various types of strategies and alerts. Confluence between patte
"Dinamik Scalping Osilatörü" - gelişmiş, özel bir Kripto-Forex göstergesi - MT4 için verimli bir işlem aracı! - Yeni nesil Osilatörler - nasıl kullanılacağını görmek için resimlere bakın. - Dinamik Scalping Osilatörü, uyarlanabilir Aşırı Satış/Aşırı Alım bölgelerine sahiptir. - Osilatör, dinamik Aşırı Satış/Aşırı Alım bölgelerinden kesin giriş noktalarını bulmak için yardımcı bir araçtır. - Aşırı Satış değerleri: Yeşil çizginin altında, Aşırı Alım değerleri: Turuncu çizginin üzerinde. - Bu gös
This indicator works on MT4 and is very easy to use. When you receive a signal from it, you wait for that candle with the signal to close and you enter your trade at the beginning of the next new candle . A red arrow means sell and a green arrow means buy. All arrows comes with Alert  like for easy identification of trade signal. Are you okay with that? 1 minute candle 1 minute expire
Dijital opsiyon ticaretinin dünyasında, kesin piyasa analizi ve stratejik karar verme önemli olduğundan, karlı fırsatları açığa çıkarabilen olağanüstü bir ticaret göstergesi arayışı hiç bitmez. İşte Secret Indicator (Gizli Gösterge) - sınıfının en iyi ve en güçlüsü olarak ün kazanmış etkileyici bir MT4 ikili opsiyon ticaret aracı. Secret Indicator, deneyimli tüccarlar ve uzman programcıların oluşturduğu bir ekip tarafından yıllar süren titiz araştırma, geliştirme ve testlerin sonucunda ortaya
Forex Gump
Andrey Kozak
2.4 (5)
Forex Gump is a fully finished semi-automatic trading system. In the form of arrows, signals are displayed on the screen for opening and closing deals. All you need is to follow the instructions of the indicator. When the indicator shows a blue arrow, you need to open a buy order. When the indicator shows a red arrow, you need to open a sell order. Close orders when the indicator draws a yellow cross. In order to get the most effective result, we recommend using the timeframes H1, H4, D1. There
**Binary Smart System: En İyi İşlem Yardımcınız** Binary Smart System sadece bir gösterge değil, piyasaların çeşitli alanlarında hassaslıkla işaretler üreten sofistike bir işlem aracıdır. Keskin algoritmaların ve geniş bir teknik gösterge koleksiyonunun birleşiminden oluşan bu sistem, işlem başarınızı en üst düzeye çıkarmak için tasarlanmıştır. **Gösterge Bileşenleri:** 1. **Hareketli Ortalama Yüzdesi (HAY):** Bu bileşen, birden fazla hareketli ortalamanın ağırlıklı ortalamasını hesaplar ve
Advanced Stochastic Scalper - is a professional indicator based on the popular Stochastic Oscillator. Advanced Stochastic Scalper is an oscillator with dynamic overbought and oversold levels, while in the standard Stochastic Oscillator, these levels are static and do not change. This allows Advanced Stochastic Scalper to adapt to the ever-changing market. When a buy or a sell signal appears, an arrow is drawn on the chart and an alert is triggered allowing you to open a position in a timely mann
Market Session Pro MT4
Kambiz Shahriarynasab
5 (1)
The  Market Sessions Indicator for MT5 helps you  predict market turnarounds  by detecting major supply and demand areas. These pivot points tend to occur after a new session has started and the previous one is still open. It is also used to gauge how many points or pips the market moves on average during a session. This helps us to place better our take profits and stop losses. The indicator works on all forex pairs, gold, silver, commodities, stocks, indices and any other instrument that your
EARLY REMINDER: The Starting price is 65 price will rise soon up to 365$ and then 750$ after first 10 copies of sales. Grab this offer now! Introduction Hello, traders! Welcome to the demonstration of the Forex Beast Indicator , a comprehensive tool designed to assist aspiring traders in navigating the complexities of the forex market. This indicator incorporates seven essential components to provide a well-rounded trading experience: Moving Averages Colored Zones Support and Resistance Levels
Two Candles to Glory
Ellan Dirgantara Tholkhah
This is a Binary Options signal indicator. Extremely powerful for the 1 min chart. The signals are based on my personal tweak (based on real trial and error & backtested) of the RSI, ADX and Ichimoku and my observation on how price moves. It turns out, 2 candles expiry is the most consistent with this set up. How to use: 1. Wait for arrow signal to show. 2. Place a 2 candle expiry right after the close of the signal candle. So if you are trading a 1 min chart, place an expiry for 2 mins... if yo
The Binary Profit Maker,  This indicator works on MT4 and is very easy to use. When you receive a signal from it, you wait for that candle with the signal to close and you enter your trade at the beginning of the next new candle . A Up Purple arrow means Buy and a Down Purple arrow means Sell. All arrows comes with Alert  like for easy identification of trade signal. Are you okay with that? How To Enter Trade? 1 minute candle 1 minute expire
Max Volume
Maksim Slovakov
Подкрашивает аномально большие тиковые объёмы в красный цвет. Имеет следующие настройки: "Процент" по умолчанию "70"  (Процент на который аномальный объём должен быть больше предыдущего) "Уровень" по умолчанию "500" (Количество тиков, больше которого будем брать во внимание аномальный объём) Внимание! Данный индикатор был разработан для мелких таймфреймов M1,M5,M15. Идея в том, что на таких Таймфреймах увеличение количества тиков говорит об увеличении количество сделок, увеличения интереса к цен
Night ghost
Dmitriy Kashevich
Night Ghost - İkili opsiyonlar için ok göstergesi. Bu, gelecekte sizin için güvenilir bir yardımcıdır! - Grafikte yeniden çizim yok -Tüm döviz çiftlerinde harika çalışıyor! -%90'a varan gösterge doğruluğu (Özellikle geceleri) -Uzun süre kurulum yapmaya gerek yok (İkili Opsiyonlar için mükemmel kurulum) - Geç olmayan sinyaller - Mevcut mum üzerinde bir sinyalin görünümü -M1 dönemi için mükemmel (Artık Yok!) - Göz dostu mum rengi (Kırmızı ve Mavi) -Yüklü Uyarı Onunla çalışmak: - Mavi
SuperTrend Alerts adds alerts to the widely popular SuperTrend indicator. As the name suggests, SuperTrend is a trending indicator which works best in trendy (not choppy) markets. SuperTrend is extremely popular for intraday and daily trading, and can be used on any timeframe. Place a call when the price closes above the SuperTrend line, and place a put when the price closes below the SuperTrend line. These crossovers are highlighted by non-repainting up/down arrows. Alerts Email, message and s
PRO Renko Sistemi, RENKO grafikleri ticareti için özel olarak tasarlanmış son derece hassas bir ticaret sistemidir. Bu, çeşitli ticaret araçlarına uygulanabilen evrensel bir sistemdir. Sistemi etkin piyasa sana doğru ters sinyallerine erişim hakkı denilen ses nötralize eder. Göstergenin kullanımı çok kolaydır ve sinyal üretiminden sorumlu tek bir parametreye sahiptir. Aracı, seçtiğiniz herhangi bir ticaret aracına ve renko çubuğunun boyutuna kolayca uyarlayabilirsiniz. Yazılımımla karlı bir
Adx open calculed
Teresinha Moraes Correia
Custom ADX Indicator Based on Open Price Only The standard ADX indicator is usually calculated using the High, Low, and Close prices. This produces a smooth and visually appealing line that represents price action. However, ️ it lacks precision — as the candle moves, the ADX, +DI, and -DI values also change suddenly, potentially triggering false signals based on the candle’s initial plotting. A curious observation: even when the input is modified to use the Open price in the indicator se
Binary Options Support Resistance Indicator This indicator is designed for binary options trading and effectively shows retracements from support and resistance levels. Signals appear on the current candle. A red arrow pointing downwards indicates a potential selling opportunity, while a blue arrow pointing upwards suggests buying opportunities. All that needs adjustment is the color of the signal arrows. It is recommended to use it on the M1-M5 timeframes as signals are frequent on these timef
TrendWavePattern  an another way to trade with a harmonic pattern, a maestro classic pattern . I made some improvements and combinations with my own strategy. Trend direction, buy-sell signal ,hi-low area and pivot line. These will be helpful for trader to read the current market condition. So it is not blindly following the pattern itself but also following other informations from the market. Readable chart appearance . Designed to be user friendly even you are a new trader. BUY-SELL zone, Tak
PipTick VSA MT4
Michal Jurnik
1 (2)
The   Volume Spread Analysis indicator   is based on the original Volume Spread Analysis method. It was designed for quick and easy recognition of VSA patterns. Even though this indicator looks very simple, it is the most sophisticated tool we've ever made. It is a really powerful analytical tool that generates very reliable trading signals. Because it is very user-friendly and understandable, it is suitable for every type of trader, regardless of his experience. What is VSA? VSA - Volume Spre
Discover the Power of Trend Strength Pro Unlock a new level of clarity in your trading with Trend Strength Pro , the ultimate tool for visualizing market momentum. Stop guessing and start seeing the true strength of a trend with a single glance. Our elegant and intuitive indicator helps you make smarter, more confident trading decisions. Key Advantages & Features Instantly See Trend Strength : Our color-coded histogram tells you whether the trend is getting stronger or weaker. Green means moment
FREE
Quantum Balance
Adolfina Denysenko
Quantum Balance is a modern arrow indicator that identifies key price reversal points in the market with high accuracy. It is based on a combination of WPR (Williams %R) and RSI (Relative Strength Index), which allows you to identify overbought/oversold moments and enter trades at points of maximum potential. The indicator analyzes price dynamics and market conditions, generating signals only when several confirming factors coincide. This reduces the number of false signals and increases tradin
MT4 için Crypto_Forex Göstergesi "FRAKTALLAR KANALI". - Bu gösterge, Fraktalların Yüksek/Düşük değerlerine dayalı gerçek yerel Trend çizgilerini gösterir. - Grafik Analiz kullanan yatırımcılar için idealdir. - Direnç yerel trend çizgileri - Kırmızı renk. - Destek yerel trend çizgileri - Mavi renk. - Fraktal sayısı, trend çizgisi renkleri ve genişliğinden sorumlu birkaç parametresi vardır. - Gösterge, mevcut piyasa koşullarını tespit etmek için idealdir: - Boğa piyasası durumu - her iki çizgi d
Giriş: İkili opsiyonlar ve forex ticaretinin hızlı tempolu dünyasında, doğru araçlara ve stratejilere sahip olmak başarı ile başarısızlık arasındaki fark yaratabilir. Bu tür bir araç, BBB Black Blue Binary Option Indicator System'dir (BBB Siyah Mavi İkili Opsiyon Göstergesi Sistemi), ticarete yeni bir yaklaşım sunan ve grafik modelleri, hareketli ortalamalar ve işlem hacmini kullanarak yatırımcıların bilinçli kararlar vermesine yardımcı olan bir sistemdir. Bu kapsamlı kılavuzda, BBB sisteminin i
We present you the indicator "Candle closing counter", which will become your indispensable assistant in the world of trading. That’s why knowing when the candle will close can help: If you like to trade using candle patterns, you will know when the candle will be closed. This indicator will allow you to check if a known pattern has formed and if there is a possibility of trading. The indicator will help you to prepare for market opening and market closure. You can set a timer to create a pre
Binary Options Assistant (BOA) ICE Signals Indicator provides signals based on gkNextLevel Binary Options Strategy.  Indicators: 2 Bollinger Bands & Stochastic Stop missing trades, stop jumping from chart to chart looking for trade set-ups and get all the signals on 1 chart! U se any of the BOA Signals Indicator with the  Binary Options Assistant (BOA) Multi Currency Dashboard .   All BOA Signal Indicator settings are adjustable to give you more strategy combinations. The signals can be seen
FREE
Magic M2
Tuan Anh Dao
4.5 (8)
------ GOOD LUCK   -----   (Telegram: @MagicBinary) The indicator allows you to trade binary options. T his indicator give high winning ratio with over 20 years of backtesting  The recommended time frame is М1 and the expiration time is 3, 5 minutes. The indicator suitable for Auto and Manual trading. A possible signal is specified as a arrows above/under a candle. You can entry current candle /intrabar or can wait until candle close Arrows are not re-painted Trade sessions: Any/ Rec
The Super Arrow Indicator provides non-repainting buy and sell signals with exceptional accuracy. Key Features No repainting – confirmed signals remain fixed Clear visual arrows: green for buy, red for sell Real-time alerts via pop-up, sound, and optional email Clean chart view with no unnecessary clutter Works on all markets: Forex, gold, oil, indices, crypto Adjustable Parameters TimeFrame Default: "current time frame" Function: Sets the time frame for indicator calculation Options: Can be set
Arrow Signal System
Alex Amuyunzu Raymond
MV Arrow Signal System  Indicator Overview The MV Arrow Signal System is a comprehensive multi-indicator trading system for MetaTrader 4 that identifies potential buy and sell signals based on swing point detection combined with multiple technical confirmation filters. Core Concept The system scans price charts to identify swing highs and swing lows, then applies a scoring system based on multiple technical indicators to validate these potential reversal points. Only high-probability signals tha
Bu ürünün alıcıları ayrıca şunları da satın alıyor
Şu anda %20 İNDİRİMLİ! Herhangi bir Acemi veya Uzman Tüccar için En İyi Çözüm! Bu gösterge paneli yazılımı 28 döviz çifti üzerinde çalışıyor. Ana göstergelerimizden 2'sine (Gelişmiş Para Birimi Gücü 28 ve Gelişmiş Para Birimi Dürtüsü) dayanmaktadır. Tüm Forex piyasasına harika bir genel bakış sağlar. Gelişmiş Para Birimi Gücü değerlerini, para birimi hareket hızını ve tüm (9) zaman dilimlerinde 28 Forex çifti için sinyalleri gösterir. Trendleri ve / veya scalping fırsatlarını belirlemek için
F-16 Uçak Göstergesini tanıtıyoruz, ticaret deneyiminizi devrimleştirmek için tasarlanmış son teknoloji bir MT4 aracı. F-16 savaş uçağının eşsiz hızı ve hassasiyetinden ilham alan bu gösterge, finansal piyasalarda eşi benzeri olmayan performans sunmak için ileri algoritmalar ve son teknoloji teknolojileri bir araya getirir. F-16 Uçak Göstergesi ile gerçek zamanlı analiz sunarak yüksek doğruluklu ticaret sinyalleri üretirken rekabetin üzerine çıkacaksınız. Dinamik özellikleri, farklı varlık sınıf
Dynamic Forex28 Navigator
Bernhard Schweigert
4.43 (7)
Dynamic Forex28 Navigator - Yeni Nesil Forex Ticaret Aracı. ŞU ANDA %49 İNDİRİM. Dynamic Forex28 Navigator, uzun zamandır popüler olan göstergelerimizin evrimidir ve üçünün gücünü tek bir göstergede birleştirir: Gelişmiş Döviz Gücü28 Göstergesi (695 inceleme) + Gelişmiş Döviz İMPULS ve UYARI (520 inceleme) + CS28 Kombo Sinyalleri (Bonus). Gösterge hakkında ayrıntılar https://www.mql5.com/en/blogs/post/758844 Yeni Nesil Güç Göstergesi Ne Sunuyor?  Orijinallerde sevdiğiniz her şey, şimdi yeni
Meravith
Ivan Stefanov
5 (1)
Gösterge, her noktadan hacmi analiz eder ve bu hacim için piyasa tükenme seviyelerini hesaplar. Üç çizgiden oluşur: Boğa hacmi tükenme çizgisi Ayı hacmi tükenme çizgisi Piyasa trendini gösteren bir çizgi. Bu çizgi, piyasanın boğa mı yoksa ayı mı olduğunu yansıtacak şekilde rengini değiştirir. Piyasayı istediğiniz herhangi bir başlangıç noktasından analiz edebilirsiniz. Bir hacim tükenme çizgisine ulaşıldığında, bir sonraki analize başlamak için yeni bir nokta belirleyin. Herhangi bir şeyi analiz
Supply and Demand Dashboard PRO
Bernhard Schweigert
4.8 (20)
Şu anda %20 İNDİRİMLİ! Bu gösterge paneli, birden fazla sembol ve 9 zaman dilimine kadar çalışan çok güçlü bir yazılım parçasıdır. Ana göstergemize dayanmaktadır (En iyi yorumlar: Advanced Supply Demand ).     Gösterge paneli harika bir genel bakış sağlar. Gösterir:    Bölge mukavemet derecesi dahil filtrelenmiş Arz ve Talep değerleri, Bölgelere/ve bölgeler içindeki pip mesafeleri, İç içe geçmiş bölgeleri vurgular, Tüm (9) zaman dilimlerinde seçilen semboller için 4 çeşit uyarı verir. Kişisel
BinaryIndicator is a highly accurate indicator for trading binary options. It shows excellent results in scalping. This indicator is based in multifactor analysis of trend indicators, as well as confirmation oscillators, which in the end gives an increased accuracy of signals. Advantages of the indicator Increased accuracy of signals. Excellent results when trading binary options with a short expiration time from M30 to M1 . It works on any timeframes. Works with any trade symbols. Parameters
Bu gösterge, pratik ticaret için mükemmel olan otomatik dalga analizine yönelik bir göstergedir! Dava... Not:   Dalga sınıflandırması için Batılı isimleri kullanmaya alışkın değilim. Tang Lun'un (Tang Zhong Shuo Zen) adlandırma kuralının etkisiyle, temel dalgayı   kalem   , ikincil dalga bandını ise   segment   olarak adlandırdım. aynı zamanda segmentin trend yönü vardır. Adlandırma   esas olarak trend segmentidir   (bu adlandırma yöntemi gelecekteki notlarda kullanılacaktır, öncelikle söyleyey
SHOGUN Trade [Concept: Command the Market Structure] To win a war, one must see the entire battlefield, not just the skirmishes. SHOGUN Trade elevates your perspective from a reactive foot soldier to a strategic "Commander." By synchronizing analysis across 7 timeframes and identifying the maturity of trends, it allows you to govern your trades with the authority and patience of a "Shogun," entering the market only when the structural advantage is undeniable. 5 Strategic Benefits of Installi
Başlık: BBMA Yapı Rehberi - BBMA Yapı Rehberi Açıklama: BBMA Yapı Rehberi, BBMA yapısının evrimini daha kolay ve verimli anlamak için tasarlanmış özel bir MQL4 göstergesidir. BBMA veya "Bollinger Bands Moving Average", "Bir Adım Önde" sloganıyla bilinir ve piyasa yapısını derinlemesine anlamanın önemini vurgular. BBMA Yapı Rehberi ile fiyat dalgalanmalarını tetikleyen temel piyasa yapı desenlerini hızlı bir şekilde tanımlayabilirsiniz. Bu, daha bilinçli ve etkili ticaret kararları almanıza ya
Looking for a powerful yet lightweight swing detector that accurately identifies market structure turning points? Want clear, reliable buy and sell signals that work across any timeframe and any instrument? Buy Sell Arrow MT Swing is built exactly for that — precision swing detection made simple and effective. This indicator identifies Higher Highs (HH) , Higher Lows (HL) , Lower Highs (LH) , and Lower Lows (LL) with remarkable clarity. It is designed to help traders easily visualize market str
Golden Gendut
Anthonius Soruh
5 (1)
Gendel Gendut is Binary Option Indicator From @realTatino Trade with expaired time Pairs : All Forex Pair Time Frame : M5 only Trade Time All Time Alert : Alert Message, Alert Email, Alerts Push Buffer : 4 Buffer (0,2 (Buy) || 1,3 (Sell) Broker Suitable : All Broker Binary With Forex Pair Auto Trade : Yes Repaint : NO Delay : NO Other Binary Indicator : https://www.mql5.com/en/market/product/70915 https://www.mql5.com/en/market/product/71054 https://www.mql5.com/en/market/product/57755 etc IND
Presenting one-of-a-kind Gann Indicator for XAUUSD IQ Gold Gann Levels is a non-repainting, precision tool designed exclusively for XAUUSD/Gold intraday trading. It uses W.D. Gann’s square root method to plot real-time support and resistance levels, helping traders spot high-probability entries with confidence and clarity. William Delbert Gann (W.D. Gann) was an exceptional market analyst whose trading technique was based on a complex blend of mathematics, geometry, astrology, and ancient calcul
POWR Rise Coming
Trade Indicators LLC
This indicator is SO SIMPLE… when the green Rise Coming arrow appears, a price drop may be on the way! Plain and easy profits! As you receive more than one 'Rise Coming' text signal in a downtrend, it means momentum is building larger for a bull run. HOW TO USE 1. When the green "Rise Coming" text appears, a price jump may be on the way! This indicator Never Repaints! To get the best setting it's a matter of tweaking the indicator until it gives you the best results. Our recommendation, and what
Introduction to Fractal Pattern Scanner Fractal Indicator refers to the technical indicator that makes use of the fractal geometry found in the financial market. Fractal Pattern Scanner is the advanced Fractal Indicator that brings the latest trading technology after the extensive research and development work in the fractal geometry in the financial market. The most important feature in Fractal Pattern Scanner is the ability to measure the turning point probability as well as the trend probabi
" Dynamic Scalper System " göstergesi, trend dalgaları içinde işlem yapmak için scalping yöntemi için tasarlanmıştır. Başlıca döviz çiftleri ve altın üzerinde test edilmiştir, diğer işlem araçlarıyla uyumluluğu mümkündür. Ek fiyat hareketi desteğiyle trend boyunca pozisyonların kısa vadeli açılması için sinyaller sağlar. Göstergenin prensibi. Büyük oklar trend yönünü belirler. Küçük oklar şeklinde scalping için sinyaller üreten bir algoritma trend dalgaları içinde çalışır. Kırmızı oklar yüksel
Supreme Commander
Ramon Sobrevals Arce
4.13 (8)
The indicator of the indicators. The Most Powerful Technique to Determine Forex Trend Strength in 2023. We have perfected Supreme Commander that it calculates an average of the selected indicators (up to 16) and the selected timeframe (all) with the result of a single trend that indicates the potential of buying and selling.  It includes the following indicators: Accelerator/Decelerator oscillator Average Directional Movement Index Awesome oscillator; Bulls and Bears  Commodity Channel Index; De
RelicusRoad Pro
Relicus LLC
4.63 (106)
Ne kadar harika geriye dönük testler, canlı hesap performans kanıtları ve her yerde fantastik istatistikler sunan bir alım satım göstergesi aldınız, ancak onu kullandıktan sonra hesabınızı **patlatmakla mı sonuçlandınız?** Bir sinyale tek başına güvenmemelisiniz, öncelikle neden ortaya çıktığını bilmeniz gerekir ve RelicusRoad Pro bunu en iyi şekilde yapar! Kullanım Kılavuzu + Stratejiler + Eğitim Videoları + VIP Erişimli Özel Grup + Mobil Sürüm Mevcut Piyasaya Bakmanın Yeni Bir Yolu RelicusR
NAM Order Blocks
NAM TECH GROUP, CORP.
3.67 (3)
MT4 Multi-timeframe Order Blocks detection indicator. Features - Fully customizable on chart control panel, provides complete interaction. - Hide and show control panel wherever you want. - Detect OBs on multiple timeframes. - Select OBs quantity to display. - Different OBs user interface. - Different filters on OBs. - OB proximity alert. - ADR High and Low lines. - Notification service (Screen alerts | Push notifications). Summary Order block is a market behavior that indicates order collection
What indicator do you look at most on your MT4 charts? Is it the Moving Average? I d o not believe that the default grid lines on MT4 charts—which you likely see hundreds or thousands of times—are designed with the intent of helping the user win. This is why MT4 users apply various indicators and go through trial and error. Because it is a chart you look at every day, it must present reliable information that we humans can recognize intuitively. This indicator was born from a single core concep
OrderFlow Absorption – MT4 için Profesyonel Delta ve Absorpsiyon Sinyal Göstergesi OrderFlow Absorption ile gerçek emir akışı analizinin gücünü keşfedin – MetaTrader 4 için nihai delta histogramı ve absorpsiyon sinyal göstergesi. Fiyat hareketlerinin arkasında gerçekte neler olduğunu görmek isteyen traderlar için tasarlanan bu araç, piyasayı hareket ettiren gizli alım/satım baskısını ve absorpsiyon olaylarını ortaya çıkarır. Özellikler Delta Histogramı Görselleştirme:   Alım ve satım baskısını a
BB Reversal Arrows Teknik Ticaret Sistemi, perakende kararları almak için ters noktaları tahmin etmek için geliştirilmiştir. Mevcut pazar durumu gösterge ile analiz edilir ve çeşitli kriterler için yapılandırılır: ters anlar beklentisi, potansiyel dönüm noktaları, satın alma ve satış sinyalleri. Gösterge fazla bilgi içermez, tüccarların makul kararlar vermesine izin veren görsel anlaşılabilir bir arayüze sahiptir. Tüm oklar mumu kapatıyor gibi görünüyor, yeniden çizim yapmadan, birkaç uyarı tür
Öncelikle, bu Ticaret Aracının Non-Repainting, Non-Redrawing ve Non-Lagging Gösterge olduğunu vurgulamakta fayda var, bu da onu profesyonel ticaret için ideal hale getiriyor. Çevrimiçi kurs, kullanıcı kılavuzu ve demo. Akıllı Fiyat Hareketi Kavramları Göstergesi, hem yeni hem de deneyimli tüccarlar için çok güçlü bir araçtır. İleri ticaret fikirlerini, Inner Circle Trader Analizi ve Smart Money Concepts Ticaret Stratejileri gibi 20'den fazla kullanışlı göstergeyi bir araya getirerek bir araya g
Introducing the Delta Volume Profile Indicator - Unleash the Power of Institutional Precision!  Technical Indicator: Are you ready to trade like the pros? The Delta Volume Profile Indicator is no ordinary tool. It’s a high-precision, cutting-edge indicator that puts the power of institutional-grade trading in your hands. This unique indicator analyses delta volume distribution in real-time, revealing the market's hidden buy/sell imbalances that the biggest financial institutions rely on to antic
Elliott Wave Trend was designed for the scientific wave counting. This tool focuses to get rid of the vagueness of the classic Elliott Wave Counting using the guideline from the template and pattern approach. In doing so, firstly Elliott Wave Trend offers the template for your wave counting. Secondly, it offers Wave Structural Score to assist to identify accurate wave formation. It offers both impulse wave Structural Score and corrective wave Structure Score. Structural Score is the rating to sh
WeSpread
Anchor Trading S.R.L.S.
The We-Spread mt4 indicator is a spread trading tools and it is suitable for those who want to study the markets with a different approach to the contents that are normally available in online trading bookstores. I think the Spread Trading strategy is one of the best I've ever used in the last few years. This is a unique indicator for spread trading because allow you to study till 3 spreads in one time. What is Spread Trading on forex The Spread Trading is the study of the strength of 2 currency
"Dragon's Tail" is an integrated trading system, not just an indicator. This system analyzes each candle on a minute-by-minute basis, which is particularly effective in high market volatility conditions. The "Dragon's Tail" system identifies key market moments referred to as "bull and bear battles". Based on these "battles", the system gives trade direction recommendations. In the case of an arrow appearing on the chart, this signals the possibility of opening two trades in the indicated directi
The Nihilist 5.0 Indicator includes Forexalien and Nihilist Easy Trend trading strategies and systems. It is composed of an MTF Dashboard where you can analyze the different input possibilities of each strategy at a glance. It has an alert system with different types of configurable filters. You can also configure which TF you want to be notified on your Metatrader 4 platform and Mobile application The indicator has the option to view how could be a TP and SL by using ATR or fixed points, even w
First time on MetaTrader, introducing IQ Star Lines - an original Vedic Astrology based indicator. "Millionaires don't use astrology, billionaires do" . - J.P. Morgan, Legendary American financier and banker. IQ Star Lines, an unique astrological indicator purely based on   Vedic astrology   calculations, published for the   first time on Metatrader.  This unique tool plots dynamic planetary grid lines based on real-time stars, constellations, and celestial movements, which allows you to plot t
「New Release Special Offer」 [Concept: Return to the Truth] Many traders get lost in a forest of complex algorithms and forget the fundamental truth: Price is King. The Authentic Price Action Dashboard was developed to end the "Search for the Holy Grail" and bring traders back to the universal principles of Dow Theory and Candlestick Analysis. It is not just a tool, but a discipline enforcer that creates an environment where you only trade when the "Truth" of the market aligns. Special Launch Off
Key level wedge pro
Presley Annais Tatenda Meck
5 (1)
We have combined all of our beloved indicators the likes of: Key level order block , Key level supply and demand , Key level liquidity grab and Key level wedge into one single indicator and dashboard. Whats new Dashboard : There is an easy access dashboard for all your needs. Multi-timeframe button : There is now a multi-timeframe option for Order Blocks and Supply and demand zones, making it easy to see higher timeframe zones easily on the current timeframe by just clicking the desired timefra
Yazarın diğer ürünleri
Bir döviz çiftinin birden fazla zaman dilimini tek bir pencerede analiz etmek kafanızı karıştırabilir. Birden çok zaman dilimini analiz etmek için güvenilir göstergelere ihtiyacınız vardır. Bunlardan biri 9TF STOCH RSI kullanıyor. Basit ama güvenilir ve dokuz zaman dilimini tek bir göstergede kapsayan bir kod oluşturmak için gece gündüz çalışıyorum. Bu göstergenin bazı avantajlarına bakalım: Renkli histogram. Her zaman dilimindeki eğrinin rengi birbirinden farklıdır. STOCHASTIC ana hat ve
Analyzing multiple time frames of a currency pair in one window can make you confused. To analyze multiple time frames, you need reliable indicators. One of them is using 9TF RSI MA . I've been working day and night to create code that is simple but reliable and covers all nine time frames in just one indicator .  Let's look at some of the advantages of this indicator: Colorful histogram . The color of the curve in each timeframe is different from one another.  Arrows indicating the crossing of
Bir döviz çiftinin birden fazla zaman dilimini tek bir pencerede analiz etmek kafanızı karıştırabilir. Birden çok zaman dilimini analiz etmek için güvenilir göstergelere ihtiyacınız vardır. Bunlardan biri 9TF Double RSI Double MA kullanıyor. Basit ama güvenilir ve dokuz zaman dilimini tek bir göstergede kapsayan bir kod oluşturmak için gece gündüz çalışıyorum. Bu göstergenin bazı avantajlarına bakalım: Çift RSI, yani RSI daha hızlı ve RSI daha yavaş. Çift MA, yani MA daha hızlı ve MA daha
Bir döviz çiftinin birden fazla zaman dilimini tek bir pencerede analiz etmek kafanızı karıştırabilir. Birden çok zaman dilimini analiz etmek için güvenilir göstergelere ihtiyacınız vardır. Bunlardan biri 9TF Double CCI Double MA kullanıyor. Basit ama güvenilir ve dokuz zaman dilimini tek bir göstergede kapsayan bir kod oluşturmak için gece gündüz çalışıyorum. Bu göstergenin bazı avantajlarına bakalım: Çift CCI, yani CCI daha hızlı ve CCI daha yavaş. Çift MA, yani MA daha hızlı ve MA daha
Doğru bir CCI göstergesi mevcuttur. Pano Trend Çubuğu Smart Level 9TF Double CCI. Çift CCI, yani Hızlı CCI ve Yavaş CCI Neden ikinci CCİ'ye ihtiyacınız var? Ek göstergeler kullanmak, canlı ticarette bizi daha fazla ikna edecektir. 9TF Hızlı CCI eğrisi 9TF Yavaş CCI eğrisi 9TF gerçek zamanlı CCI açısı 9TF gerçek zamanlı CCI değeri 9TF gerçek zamanlı CCI yönü/fazı 9TF Eğilim Çubuğu Trend çubuğunun hesaplanmasında yeni algoritma Açma/Kapama Düğmesi. Tek bir tıklamayla göstergeyi göstermek/gizleme
Doğru bir RSI göstergesi mevcuttur. Pano Trend Çubuğu Akıllı Seviye 9TF Çift RSI. Çift RSI, yani Hızlı RSI ve Yavaş RSI Neden ikinci RSI'ya ihtiyacınız var? Ek göstergeler kullanmak, canlı ticarette bizi daha fazla ikna edecektir. 9TF Hızlı RSI eğrisi 9TF Yavaş RSI eğrisi 9TF gerçek zamanlı RSI açısı 9TF gerçek zamanlı RSI değeri 9TF gerçek zamanlı RSI yönü/fazı 9TF Eğilim Çubuğu Trend çubuğunun hesaplanmasında yeni algoritma Açma/Kapama Düğmesi. Tek bir tıklamayla göstergeyi göstermek/gizleme
Doğru bir MACD göstergesi mevcuttur. Gösterge Tablosu Trend Çubuğu Akıllı Seviye 9TF Çift MACD. Çift MACD, yani Hızlı (MACD 1) ve Yavaş (MACD 2) Neden ikinci MACD'ye ihtiyacınız var? Ek göstergeler kullanmak, canlı ticarette bizi daha fazla ikna edecektir. 9TF Hızlı MACD 1 eğrisi 9TF Yavaş MACD 2 eğrisi 9TF gerçek zamanlı MACD açısı 9TF gerçek zamanlı MACD değeri 9TF gerçek zamanlı MACD yönüDoğru bir MACD göstergesi mevcuttur. Gösterge Tablosu Trend Çubuğu Akıllı Seviye 9TF Çift MACD. Çift MA
Doğru bir Stokastik gösterge mevcuttur. Pano Trend Çubuğu Smart Level 9TF Dual Stokastik. İkili Stokastik, yani Hızlı Stokastik ve Yavaş Stokastik Neden ikinci Stokastik'e ihtiyacınız var? Ek göstergeler kullanmak, canlı ticarette bizi daha fazla ikna edecektir. 9TF Hızlı Stokastik eğri 9TF Yavaş Stokastik eğri 9TF gerçek zamanlı Stokastik açı 9TF gerçek zamanlı Stokastik değer 9TF gerçek zamanlı Stokastik yön/faz 9TF Eğilim Çubuğu Trend çubuğunun hesaplanmasında yeni algoritma Açma/Kapama Düğ
Yalnızca tek bir gösterge kullandığınız için sık sık işlem kaybediyorsanız bu işlem aracını deneyin. Bu ticaret aracı birden fazla gösterge kullanır. Yalnızca RSI göstergesini kullanan tüccarları sıklıkla gözlemliyorum. Çoğu zaman piyasa aşırı satıştadır ancak hala aşağıdadır veya piyasa aşırı alımdadır ancak hala yüksektir. Bu nedenle birden fazla gösterge kullanmanız gerekir. Yeni sürüm V 3.40 MTF PPAAF ile tanışın: Çoklu Zaman Çerçevesi Hassas Fiyat Eylem Oku Filtrelendi. Bu ticaret aracı, p
[V 1.00] MTF NRPA 5 RSI RTD yayınlandı! Yeniden boyanmayan ok gerçek zamanlı pano. Çeşitli RSI göstergelerini kullanmaktan sıkıldıysanız ancak bunların hatalı olduğunu düşünüyorsanız, bu aracı deneyin. Genellikle insanlar bir zaman diliminde OBOS seviyesini belirlemek için yalnızca 1 RSI kurarlar. Kötü haber şu ki, aynı anda çeşitli zaman dilimlerinde OBOS seviyelerini ve trendlerini göremiyorsunuz. Bu ticaret aracını bu yüzden geliştirdim. İşte nasıl açıklandığı: Bu ticaret aracında beş RS
Introducing the advanced trading tools of 2023. MTF PPAAF Model S. This is sub window version of my best trading tool : MTF Precise Price Action Arrow Filtered.  Click here to learn more about MTF PPAAF . This trading tool is equipped with various powerful features : MTF = Multi Time Frame = Time Frame can be changed. On/off button. Non Repaint Arrows.  Customizable parameter, color etc.  Can show all time frame (ATF) crossover arrows of fast stochastic main line & fast stochastic signal line (
If you are curious about the position of the stochastic, RSI, CCI curve, whether it is at the OBOS level or not, then this trading tool is for you. Introducing the advanced trading tools of 2024. ATF Trend Following Trend Bar OBOS. This indicator is similar to MTF PPAAF Model S but have two layers.  Click here to learn more about MTF PPAAFS . This trading tool is equipped with various powerful features : MTF = Multi Time Frame = Time Frame can be changed. On/off button. Customizable parameter,
Merhaba tüccarlar. En iyi ticaret aracımla tanışın. MTF PPAAF Modeli T. Çoklu Zaman Çerçevesi Hassas fiyat eylem oku filtreli Model T.  Bu ticaret aracı, yıllar boyunca çeşitli ticaret araçları yaptıktan sonra yaptığım en iyi çalışmadır. Bu ticaret aracı neden en iyi ve güvenilirdir?  1. Bu araç 6 gösterge kullanır:  Çift CCI = hızlı CCI x yavaş CCI İkili Stokastik = hızlı Stokastik (hızlı Stokastik ana hat x hızlı Stokastik sinyal hattı) ve yavaş Stokastik (yavaş Stokastik ana hat
Bu işlem aracıyla aynı anda 15 piyasayı tarayabilirsiniz. Karşınızda yeni ticaret göstergesi 2024: ️ Kontrol Paneli Çoklu Para Birimi Çoklu Zaman Çerçevesi Stokastik. Bu ticaret aracını oluşturmamın en az iki nedeni var: Öncelikle tek piyasayı gözlemlemekten sıkıldım. İkincisi, başka bir pazara giriş anını kaybetmek istemiyorum. Bu yüzden aynı zamanda diğer piyasa koşullarını da bilmek istiyorum. Bu nedenle birden fazla piyasanın koşullarını aynı anda tarayabilecek bir tarayıcıya ihtiyac
Bu işlem aracıyla aynı anda 15 piyasayı tarayabilirsiniz. Karşınızda yeni ticaret göstergesi 2024: ️ Dashboard Çoklu Para Birimi Çoklu Zaman Çerçevesi Çift CCI. Bu ticaret aracını oluşturmamın en az iki nedeni var: Öncelikle tek piyasayı gözlemlemekten sıkıldım. İkincisi, başka bir pazara giriş anını kaybetmek istemiyorum. Bu yüzden aynı zamanda diğer piyasa koşullarını da bilmek istiyorum. Bu nedenle birden fazla piyasanın koşullarını aynı anda tarayabilecek bir tarayıcıya ihtiyacım var
Bu işlem aracıyla aynı anda 15 piyasayı tarayabilirsiniz. Karşınızda yeni ticaret göstergesi 2024: ️ Kontrol Paneli Çoklu Para Birimi Çoklu Zaman Çerçevesi Çift RSI. Bu ticaret aracını oluşturmamın en az iki nedeni var: Öncelikle tek piyasayı gözlemlemekten sıkıldım. İkincisi, başka bir pazara giriş anını kaybetmek istemiyorum. Bu yüzden aynı zamanda diğer piyasa koşullarını da bilmek istiyorum. Bu nedenle birden fazla piyasanın koşullarını aynı anda tarayabilecek bir tarayıcıya ihtiyacı
Looking for a trading tool based on the CCI indicator that can display crossovers arrows on all time frames? Introducing trading indicator : All Time Frame Double CCI Model T ready to help you achieve daily profits. This tool is created using the intersection of two CCI (Double CCI) indicator lines: the main CCI and the signal CCI. Using this tool makes it easier to observe the real-time dashboard and intersections of multiple timeframes simultaneously. Viewing both higher and lower timeframes
Looking for a trading tool based on the CCI indicator that can display crossovers arrows on all time frames? Introducing trading indicator : All Time Frame Double CCI Model S ready to help you achieve daily profits. This tool is created using the intersection of two CCI (Double CCI) indicator lines: the main CCI and the signal CCI. Using this tool makes it easier to observe the real-time dashboard and intersections of multiple timeframes simultaneously. Viewing both higher and lower timeframes
Looking for a trading tool based on the MACD indicator that can display crossovers arrows on all time frames? Introducing trading indicator : All Time Frame MACD Model T ready to help you achieve daily profits. This tool is created using the intersection of two indicator lines of MACD : the main MACD and the signal MACD. Using this tool makes it easier to observe the real-time dashboard and intersections of multiple timeframes simultaneously. Viewing both higher and lower timeframes simultaneou
Looking for a trading tool based on the MACD indicator that can display crossovers arrows on all time frames? Introducing trading indicator : All Time Frame MACD Model S ready to help you achieve daily profits. This tool is created using the intersection of two indicator lines of MACD : the main MACD and the signal MACD. Using this tool makes it easier to observe the real-time dashboard and intersections of multiple timeframes simultaneously. Viewing both higher and lower timeframes simultaneou
Looking for a trading tool based on the Stochastic indicator that can display crossovers arrows on all time frames? Introducing trading indicator : All Time Frame Stochastic Model T ready to help you achieve daily profits. This tool is created using the intersection of two indicator lines of Stochastic  : the main Stochastic  and the signal Stochastic . Using this tool makes it easier to observe the real-time dashboard and intersections of multiple timeframes simultaneously. Viewing both higher
Looking for a trading tool based on the Stochastic indicator that can display crossovers arrows on all time frames? Introducing trading indicator : All Time Frame Stochastic Model S ready to help you achieve daily profits. This tool is created using the intersection of two indicator lines of Stochastic  : the main Stochastic and the signal Stochastic . Using this tool makes it easier to observe the real-time dashboard and intersections of multiple timeframes simultaneously. Viewing both higher
Looking for a trading tool based on the RSI indicator that can display crossovers arrows on all time frames? Introducing trading indicator : All Time Frame Double RSI Model T ready to help you achieve daily profits. This tool is created using the intersection of two RSI (Double RSI) indicator lines: the main RSI and the signal RSI. Using this tool makes it easier to observe the real-time dashboard and intersections of multiple timeframes simultaneously. Viewing both higher and lower timeframes
Looking for a trading tool based on the RSI indicator that can display crossovers arrows on all time frames? Introducing trading indicator : All Time Frame Double RSI Model S ready to help you achieve daily profits. This tool is created using the intersection of two RSI (Double RSI) indicator lines: the main RSI and the signal RSI. Using this tool makes it easier to observe the real-time dashboard and intersections of multiple timeframes simultaneously. Viewing both higher and lower timeframes
Looking for a trading tool based on the moving average indicator that can display crossovers arrows on all time frames? Introducing trading indicator : All Time Frame Two MA Model T ready to help you achieve daily profits. This tool is created using the intersection of two moving average  indicator lines: the main MA1 and the signal MA2. Using this tool makes it easier to observe the real-time dashboard and intersections of multiple timeframes simultaneously. Viewing both higher and lower timef
Looking for a trading tool based on the moving average indicator that can display crossovers arrows on all time frames? Introducing trading indicator : All Time Frame Two MA Model S ready to help you achieve daily profits. This tool is created using the intersection of two moving average indicator lines: the main MA1 and the signal MA2. Using this tool makes it easier to observe the real-time dashboard and intersections of multiple timeframes simultaneously. Viewing both higher and lower timefr
Filtrele:
İnceleme yok
İncelemeye yanıt