Dashboard 9TF Double CCI Double MA Angle Button
- Göstergeler
- Sürüm: 1.0
- Etkinleştirmeler: 15

Bir döviz çiftinin birden fazla zaman dilimini tek bir pencerede analiz etmek kafanızı karıştırabilir.
Birden çok zaman dilimini analiz etmek için güvenilir göstergelere ihtiyacınız vardır.
Bunlardan biri 9TF Double CCI Double MA kullanıyor.
Basit ama güvenilir ve dokuz zaman dilimini tek bir göstergede kapsayan bir kod oluşturmak için gece gündüz çalışıyorum.
Bu göstergenin bazı avantajlarına bakalım:
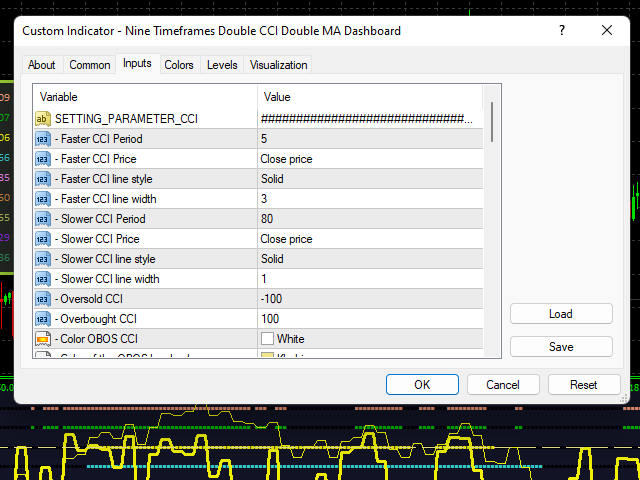
Çift CCI, yani CCI daha hızlı ve CCI daha yavaş.
Çift MA, yani MA daha hızlı ve MA daha yavaş.
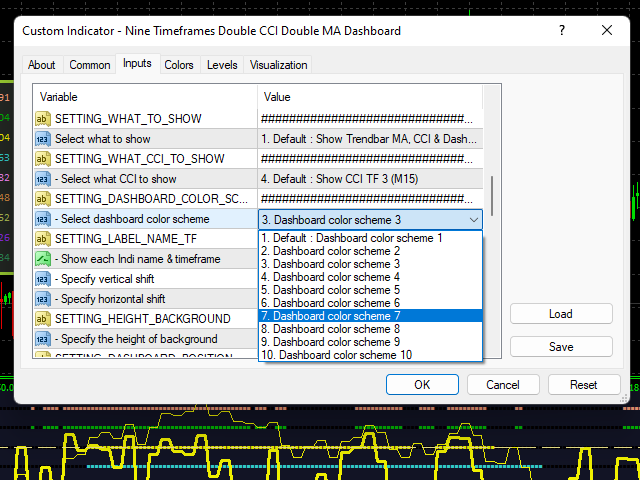
10 Renk Şeması.
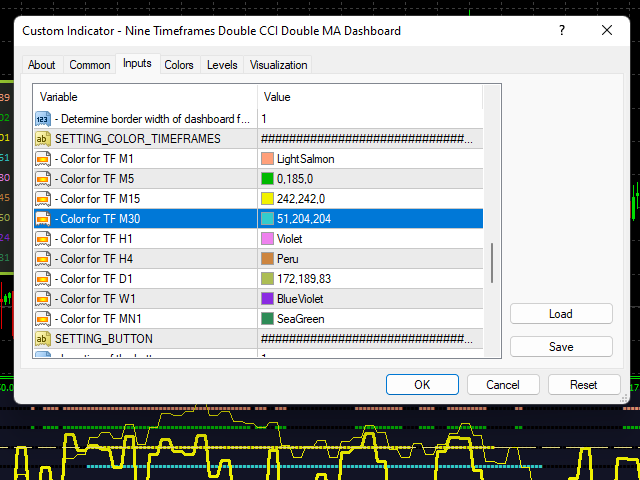
Her zaman dilimindeki eğrinin rengi birbirinden farklıdır.
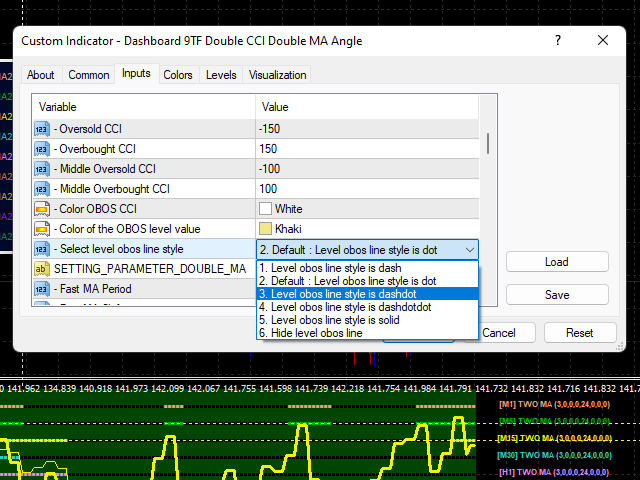
CCİ'nin OBOS seviyesi çizgisi.
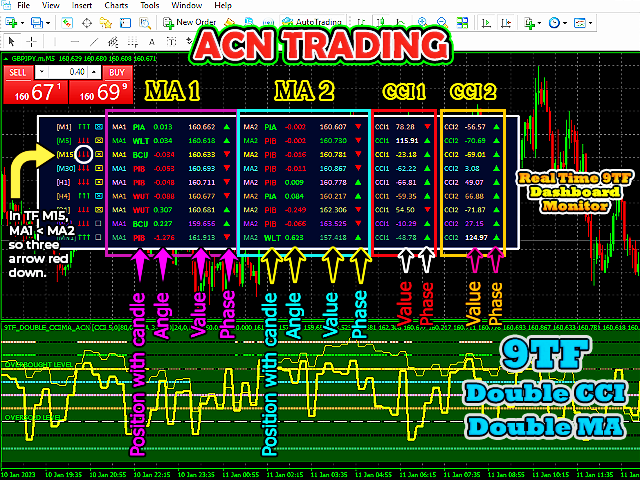
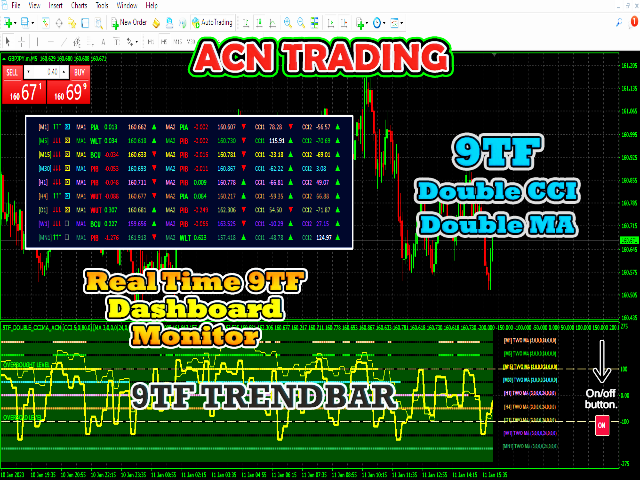
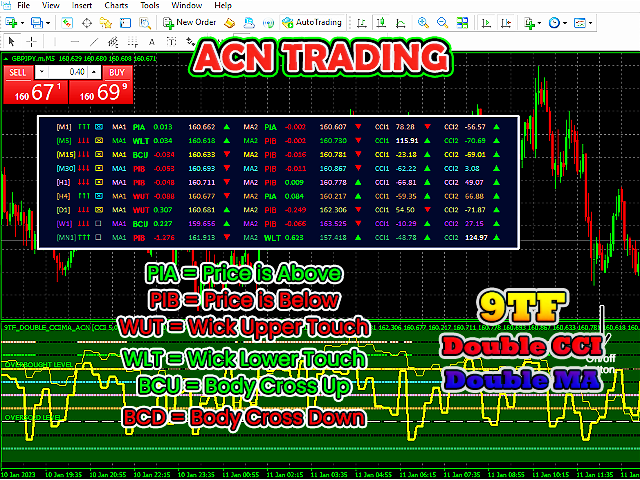
Gerçek zamanlı 9TF pano monitörü.
9TF kontrol paneli izleme hesaplamaları, bir zaman çerçevesinden diğerine geçseniz bile çok doğrudur.
Hangi CCI eğrisinin aşırı alım seviyesinin üzerinde ve hangisinin aşırı satış seviyesinin altında olduğunu izleme.
MA hızlı hattının MA yavaş hattının üzerinde olup olmadığı veya tersinin olup olmadığı eğrinin izlenmesi.
MA hızlı hattı ile MA yavaş hattı arasında bir geçiş olup olmadığı eğrisinin izlenmesi.
Bir önceki sinyal ile mevcut sinyalin hareketinin izlenmesi. Yükselişte veya inişte. (Not: Bu, scalping için çok önemli bir özelliktir!)
Uzun vadeli trendi tespit etmek için çok önemli bir trend çubuğu özelliği.
Renk değiştirme yeteneği.
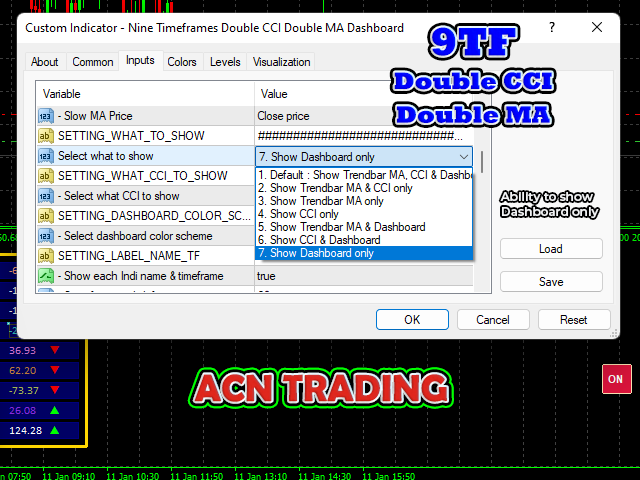
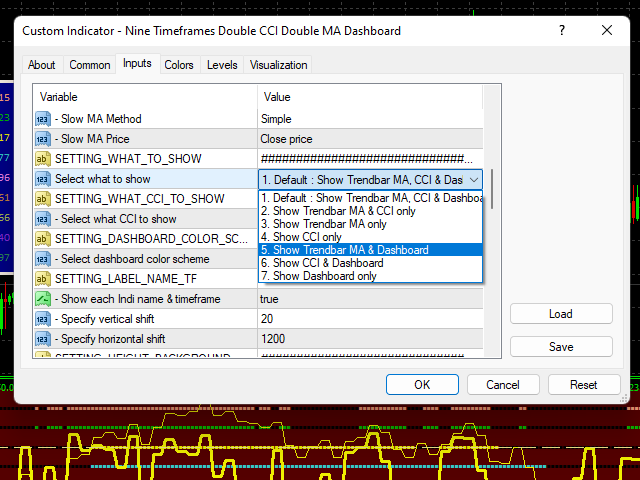
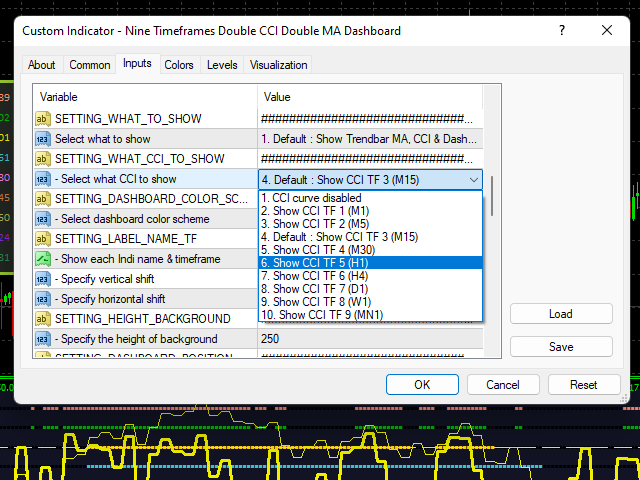
Hangi eğrinin gösterileceğini seçme yeteneği.
Yalnızca CCI, yalnızca MA, yalnızca Dashboard vb. gösterebilme
9TF pano monitörünü istediğiniz yere yerleştirme yeteneği.
Göstergeyi tek bir tıklama düğmesiyle gösterme veya gizleme yeteneği.
Fiyat hareket hareketini daha yüksek zaman diliminden küçük zaman dilimine kadar izleme yeteneği.
Forex, endeksler, metal/enerji, hisse senetleri ve kripto para birimini analiz etmek için kullanılabilir.
S1. Mevcut CCI satırının önceki CCI satırından daha büyük olup olmadığını ve tersi nasıl anlaşılır?
A1. CCI aşamasına bir göz atın (üçgen şeklinde ifade edilir). Mevcut CCI çizgisi > önceki CCI çizgisi ise, faz yukarı bakan üçgen şeklinde ve kireç rengindedir. Tersi aşağı doğru bir üçgendir ve kırmızıdır.
S2. Geçerli MA satırının önceki MA satırından daha büyük olup olmadığını ve tersi nasıl anlaşılır?
A2. MA aşamasına bir göz atın (üçgen şeklinde ifade edilir). Mevcut MA çizgisi > önceki MA çizgisi ise, faz yukarı bakan üçgen şeklinde ve kireç rengindedir. Tersi aşağı doğru bir üçgendir ve kırmızıdır.
S3. Mevcut MA daha hızlı hattının mevcut MA daha yavaş hattından daha büyük olup olmadığını veya tersinin olup olmadığını nasıl bilebilirim?
A3. Üç oka bir göz atın. Mevcut MA daha hızlı çizgisi > mevcut MA daha yavaş çizgisi ise, üç ok yukarı bakar ve kireç rengindedir. Tersi aşağı bakıyor ve kırmızı.
Tamamını YouTube kanalımdan izleyebilirsiniz. Saklanacak bir şey yok.
Bu göstergeyi yapmaktaki amacım, kazancınızı ve karınızı artırmaktır.
En iyi Double CCI Double MA ticaret göstergesi ile güvenli girişler yapın.
Şimdi alın ve bir profesyonel gibi ticaret yapın.
Teşekkür ederim.