Market Reversal Alerts MT5
- Göstergeler
- Sürüm: 5.0
- Güncellendi: 5 Ağustos 2021
- Etkinleştirmeler: 10

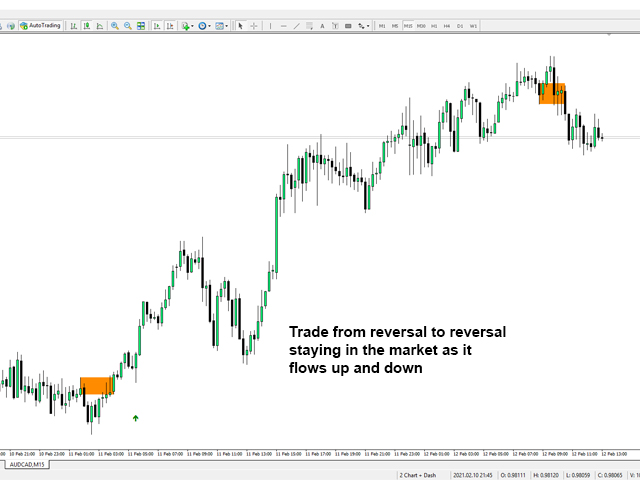
Fiyat tersine döndükçe ve geri çekildikçe piyasa yapısından elde edilen kâr değişir.
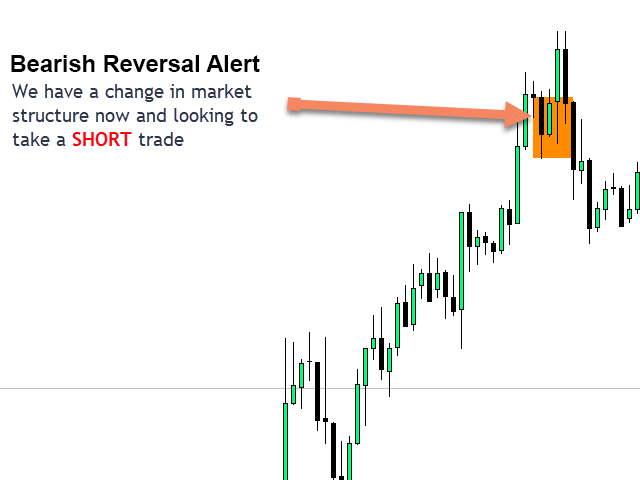
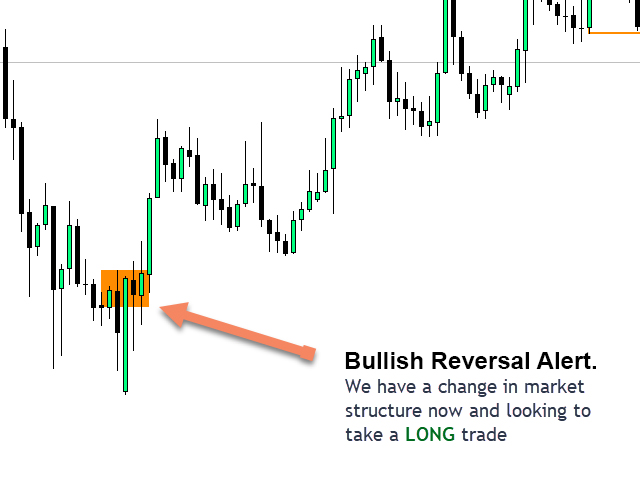
Piyasa yapısını tersine çevirme uyarısı göstergesi, bir trendin veya fiyat hareketinin ne zaman tükenmeye yaklaştığını ve tersine dönmeye hazır olduğunu tanımlar. Genellikle bir geri dönüş veya büyük bir geri çekilme meydana gelmek üzereyken meydana gelen piyasa yapısındaki değişiklikler konusunda sizi uyarır.
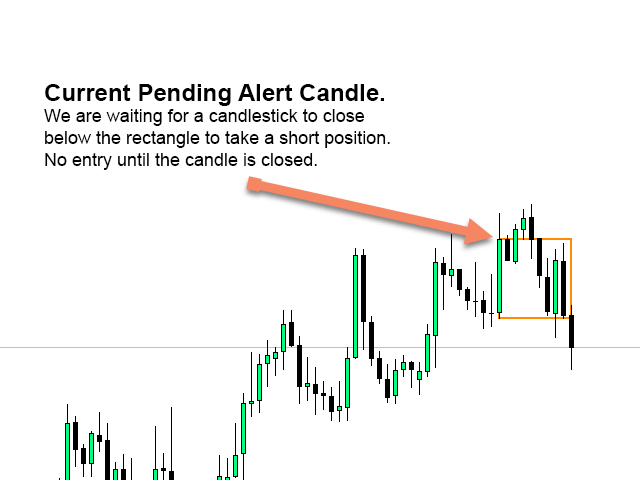
Gösterge, olası bir tükenme noktasının yakınında her yeni yüksek veya düşük oluştuğunda, başlangıçta kırılmaları ve fiyat momentumunu tanımlar. Gösterge, son zıt renkli mum üzerinde bir dikdörtgen çizer. Ardından, mevcut kısa vadeli trendinde hareket etmeye devam ederken fiyatla birlikte dikdörtgeni takip edecektir. Fiyat, dikdörtgenin üstünde veya altında kapanacak kadar zayıfladığında, bu, piyasa yapısında potansiyel bir değişimin meydana geldiğini gösterir. Gösterge daha sonra sizi yönde olası bir kayma ve trendde olası bir geri dönüşün veya büyük bir geri çekilmenin başlangıcı konusunda uyarır.
Nasıl çalıştığını görmek için aşağıdaki eylemdeki göstergeye bakın!
Burada bulunan tüm çiftleri ve ana zaman dilimlerini izlemek için gösterge tablosu: https://www.mql5.com/en/market/product/65828
MT4 Sürümü Burada Mevcuttur: https://www.mql5.com/en/market/product/46295/
Özellikler
Önemli tükenme noktalarında pazar yapısındaki olası değişiklikler konusunda sizi uyarır
Fiyat tükenme seviyelerine yaklaştıkça kısa vadeli piyasa yapısını otomatik olarak çeker
En sıkı girişleri bulmak için mevcut trend yönünde hareket ederken uyarı dikdörtgenlerini fiyatın arkasında izler
Piyasa yapısındaki olası geri dönüşlerin nerede gerçekleştiğini göstermek için uyarılarda rengi düz bir blok dikdörtgene değiştirir
Tüm semboller ve zaman dilimlerinde çalışır
Dahili açılır pencere, push ve e-posta uyarıları
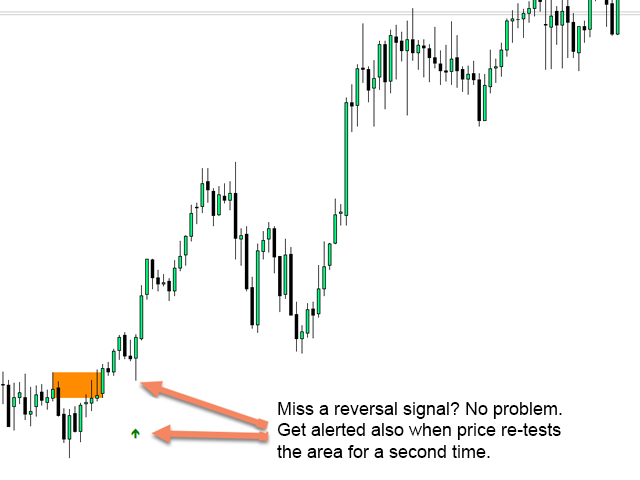
Girişin daha olası olduğunu onaylayan bir geri dönüş uyarısının yeniden test edilmesi durumunda uyarılar
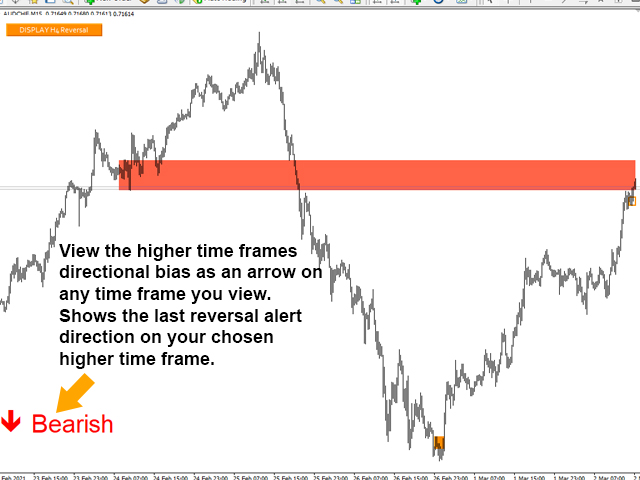
Daha düşük işlem zaman diliminizde daha yüksek zaman çerçevesi ters dikdörtgenlerini görüntülemenizi sağlar. Trend tüccarları ve daha yüksek zaman çerçevesi trend yönünü belirlemek için harika
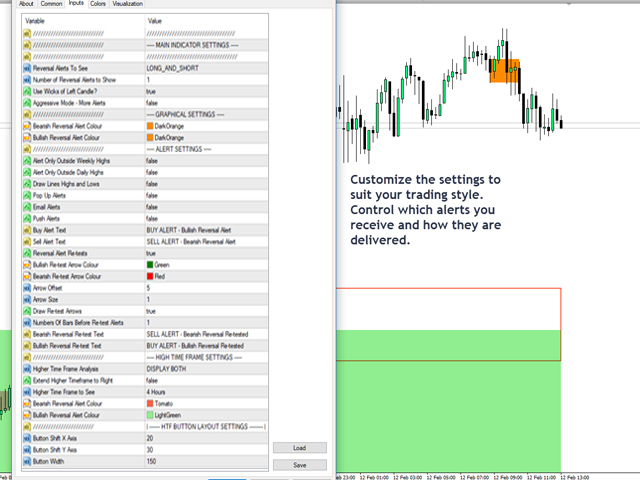
Tüm ters uyarıları veya sadece uzun veya kısa uyarıları seçin, her çiftin mevcut trend yönüne göre istediğiniz yön uyarılarını seçin
Daha düşük zaman çerçevesi grafiğinizde daha yüksek zaman çerçevesi yönlü sapma okunu görüntüleyin.
Strateji ve Piyasa Yapısını Tersine Çevirme Göstergesi ile Nasıl İşlem Yapılır
Bir geri dönüş uyarısı oluştuğunda:
Sola bak! Döndüğümüz bir arz/talep veya destek/direnç seviyesi var mı? Piyasa yapısı kaymaları (tersine dönüşler), genellikle fiyat eski bir seviyeyi yeniden test ederken veya bu destek veya direnç seviyesinin üzerinde bir durdurma avı gerçekleştiğinde meydana gelir.
Dönmekte olduğumuz bir destek/direnç alanı olup olmadığını görmek için daha yüksek bir zaman dilimine danışın. Yukarıdaki gibi, piyasa yapısındaki değişiklikler, daha yüksek bir zaman diliminde büyük seviyelerdeyken, genellikle daha düşük zaman dilimlerinde gerçekleşecektir.
Yukarıdaki koşullar karşılanırsa, sadece geri dönüş yönünde bir ticaret yapın.
Doğrulama olarak ek göstergeler ekleyebilir veya mevcut göstergelerinize veya stratejinize daha fazla doğrulama eklemek için bu göstergeyi kullanabilirsiniz!
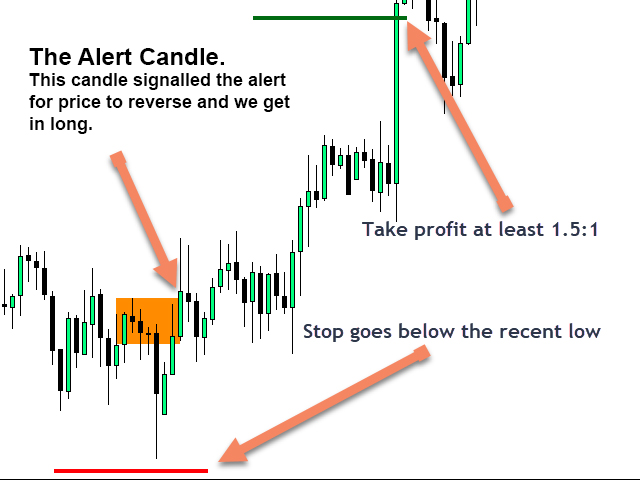
Zararı Durdurun ve Kar Alın
Durmanız her zaman en son en yüksek seviyenin hemen üstüne veya en son en düşük seviyenin altına gitmelidir. Tersine dönüş, piyasa yapısındaki bir kaymayı doğru bir şekilde tanımlıyorsa, fiyat nadiren en son zirvenin üstüne/altına geri hareket edecektir. Durağınızın boyutu, son zirveyi oluşturmak için yaptığınız son hamlenin ne kadar agresif olduğuna bağlı olacaktır.
Kâr almak kişiye bağlıdır, ancak ödüllendirmek için 1,5:1 veya 2:1 risk kullanmak kolayca başarılabilir. Grafikte çizilen yeni dikdörtgenlerin hemen üstünde/altında fiyatla birlikte 2 işlem girmek ve bir iz bırakmak 5:1 ve daha yüksek risk ödülü elde edebilir.
Strateji test cihazında kullanmak için ücretsiz demoyu indirin ve nasıl çalıştığını görün.
Geri dönüş uyarıları tetiklendikten sonra bazı hareketlerin ne kadar büyük olduğunu görün!


I don't think you can complain for this price. A good indicator in general, with a bit of brainpower you can trade well with it.