ZigZag Lines MTF for MT5
- Indikatoren
- Version: 6.5
- Aktualisiert: 19 Juli 2026
- Aktivierungen: 10

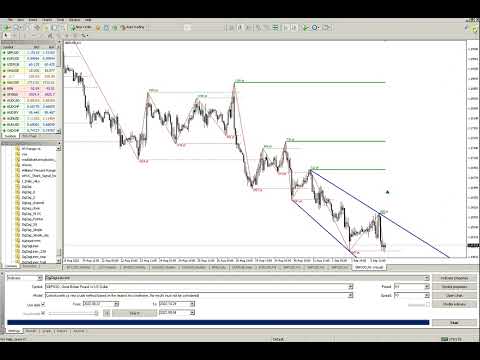
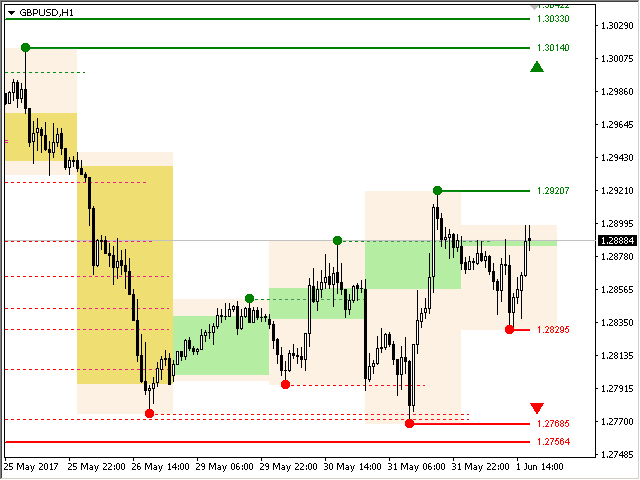
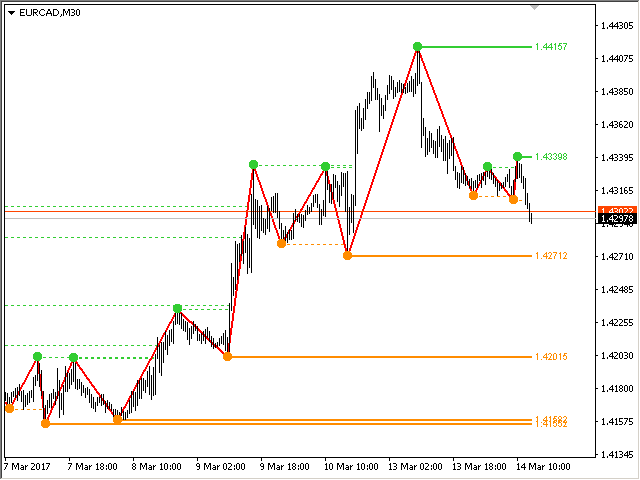
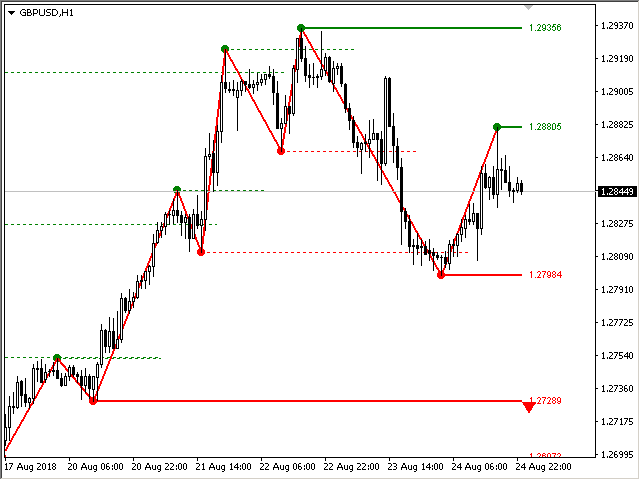
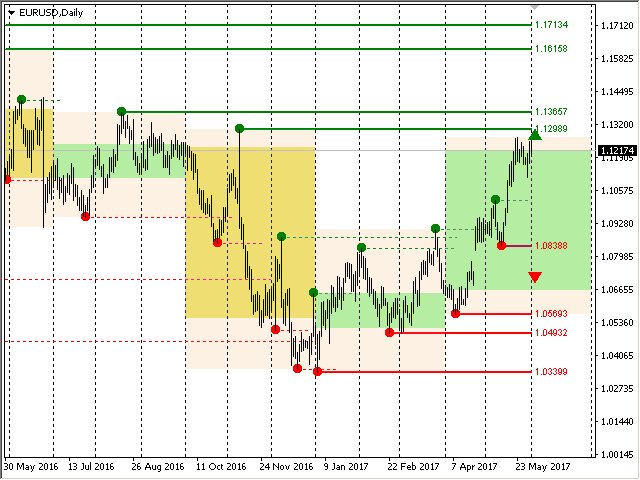
ZigZag-Indikator für mehrere Zeitrahmen. Er zeigt die horizontalen Unterstützungs- und Widerstandslinien sowie deren Durchbrüche an und zeichnet die aktuellen Kursziele des Marktes ein. Außerdem kann er Linien des Fractals-Indikators und Kerzen aus anderen Zeiträumen (bis hin zum Quartalszeitraum) anzeigen. So können Sie die Angebots- und Nachfragestufen tatsächlich erkennen. Der Indikator verbindet wichtige Tief- und Hochpunkte, um Trendlinien darzustellen.
Sie können ihn auch als Indikator für den „Break of Structure“ (BOS) und den „Market Structure Shift“ (MSS) verwenden.
Der Indikator zeichnet den letzten (aktuellen) Punkt neu und kann in einigen Fällen die letzten 2–3 Punkte ändern.
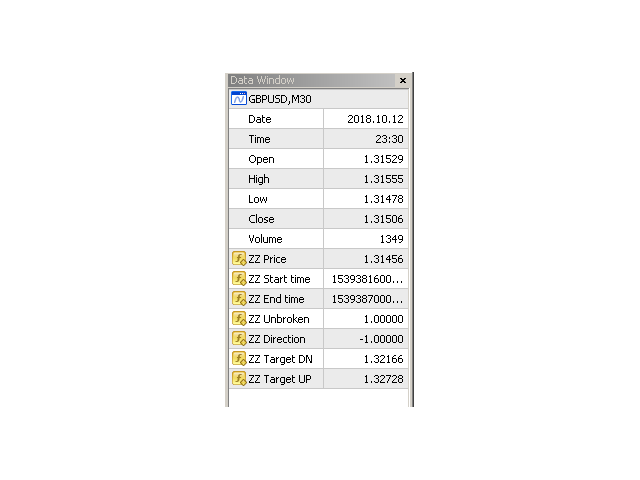
Alle Linien werden als Objekte gezeichnet (nicht als Indikator-Puffer, es besteht jedoch die Möglichkeit, die Daten für den EA zu erhalten).
Bei Verwendung in einem Expert Advisor können Sie die ZigZag-Punkte mithilfe von iCustom
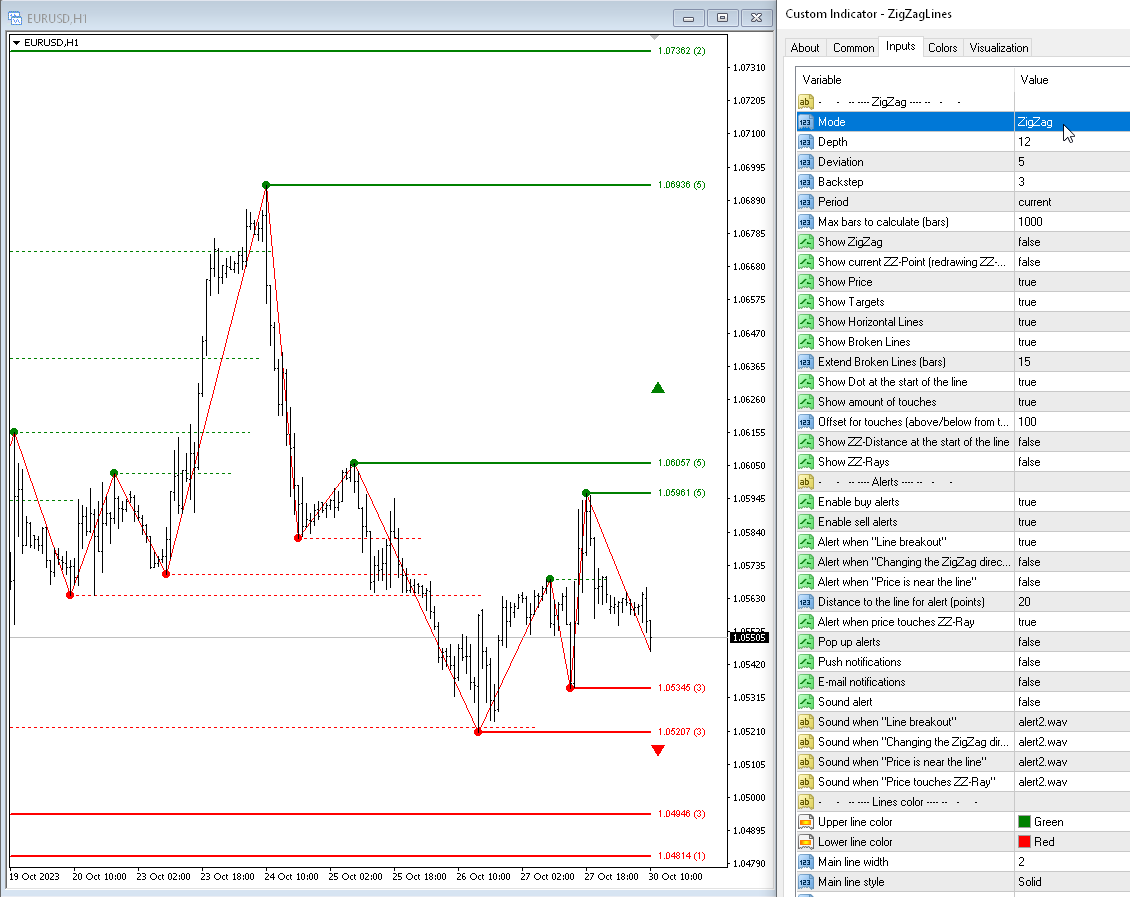
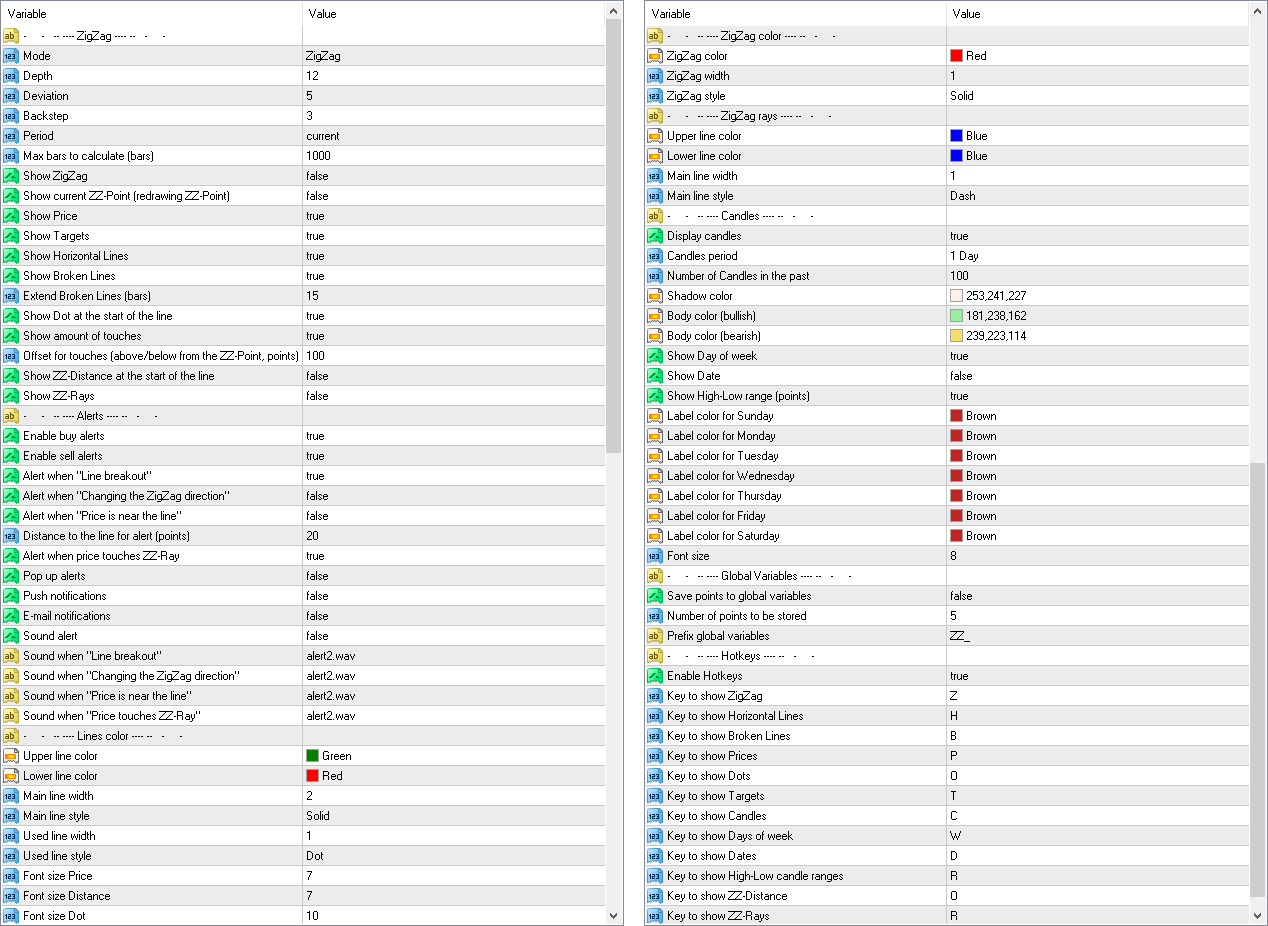
Einstellungen
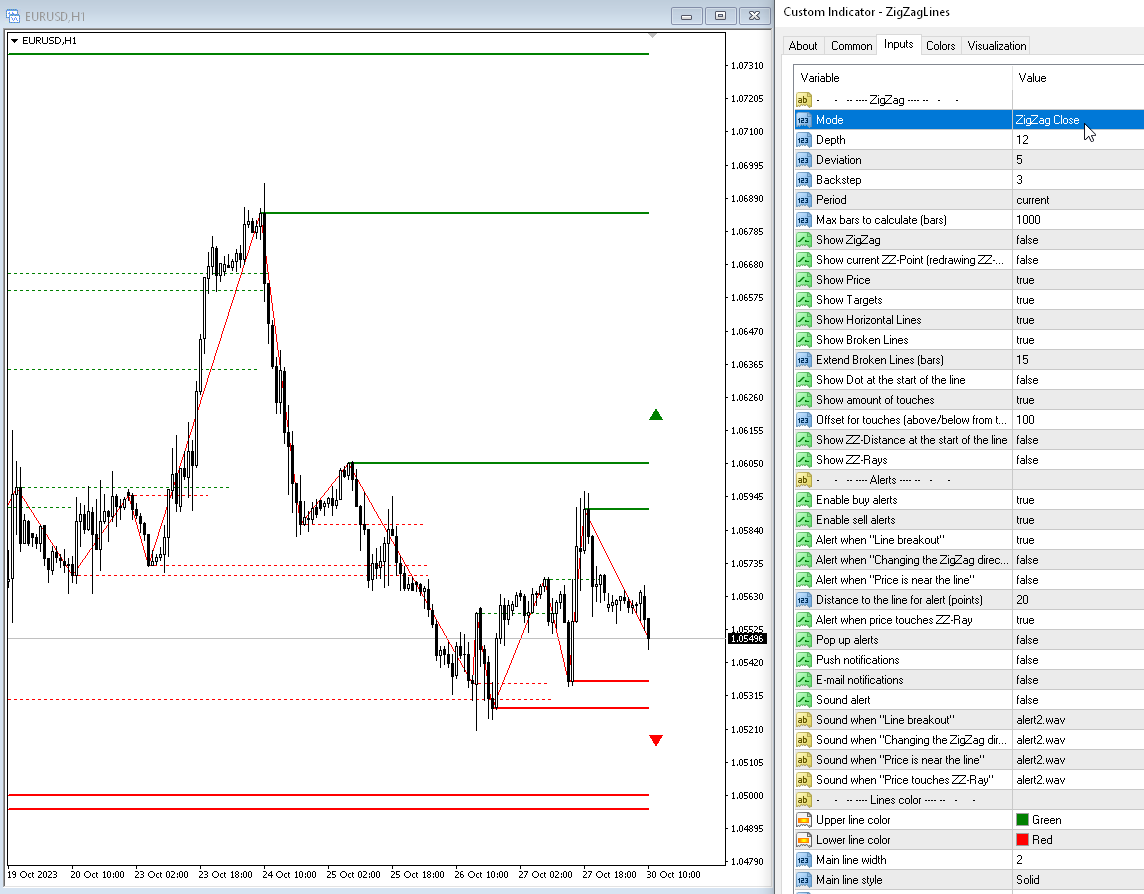
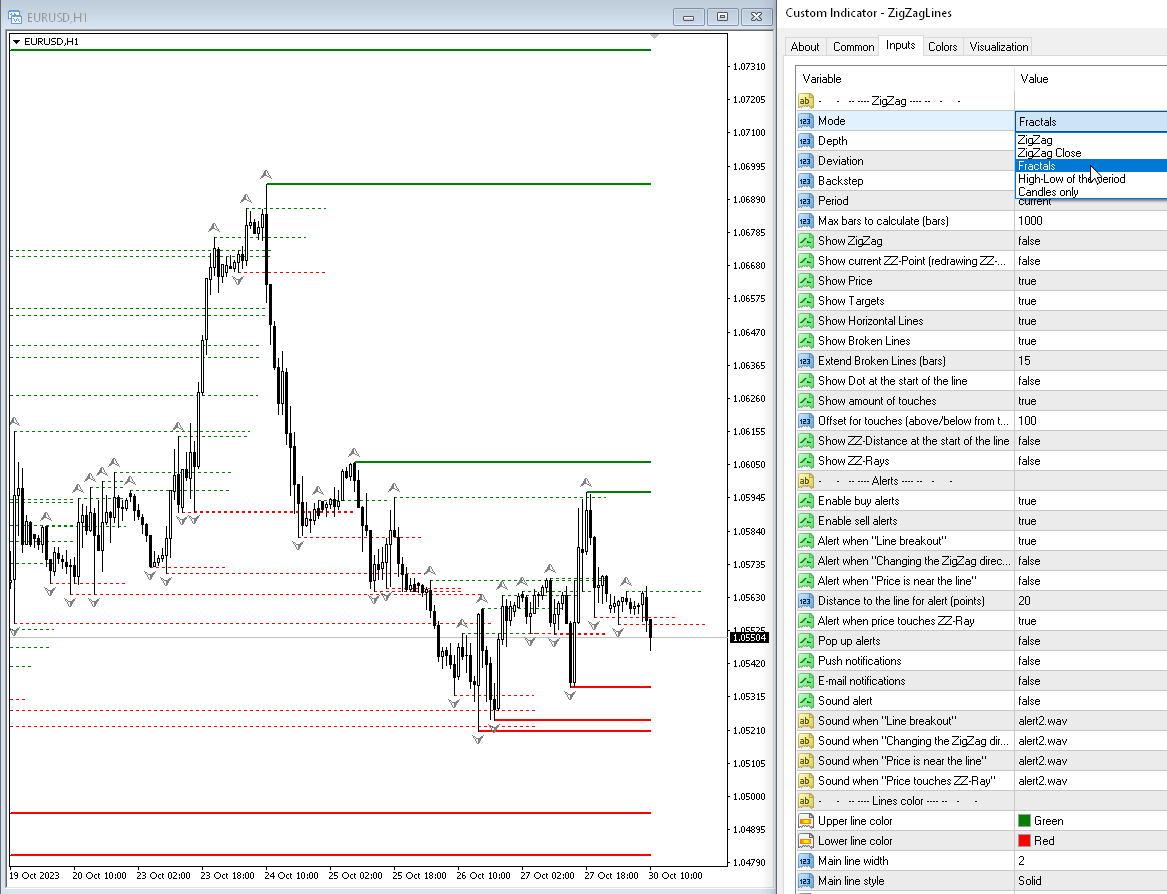
Modus – Berechnung von Unterstützungs- und Widerstandsniveaus basierend auf:
— Zig Zag — dem ZigZag-Indikator;— ZigZag Close – dem ZigZag-Close-Indikator;— Fractals — dem Fractals-Indikator;— Hoch-Tief des Zeitraums — Erstellung eines Indikators anhand der Hoch-Tief-Werte. Der Zeitrahmen wird im Parameter „Period“ festgelegt;— Nur Kerzen — Zeichnet nur Kerzen;
„Depth“ — die Mindestanzahl an Kerzen, bei der ZigZag kein zweites Hoch (bzw. Tief) zeichnet, wenn das letzte um die „Deviation“ kleiner (bzw. größer) als das vorherige ist;„
“ Abweichung — die Mindestanzahl an Punkten zwischen den Höchst- und Tiefstständen zweier benachbarter Kerzen, damit der Zigzag einen lokalen Höchst- bzw. Tiefststand bildet;
Rücksprung — die Mindestanzahl an Kerzen zwischen den lokalen Höchst- und Tiefstständen;
Periode — Zeitraum für die Berechnung von ZigZag oder Fraktalen;
Maximale Anzahl der zu berechnenden Balken (Balken) – die maximale Anzahl der Balken für die Berechnung. Diese Begrenzung dient der Beschleunigung der Berechnungen;
Auf dem Chart anzeigen
ZigZag anzeigen — den ZigZag anzeigen;
Aktuellen ZZ-Punkt anzeigen (Neuzeichnungs-Punkt) — den aktuellen (letzten) Punkt anzeigen;
Preis anzeigen — den Preis der Niveaus anzeigen;
Ziele anzeigen — die aktuellen Ziele anzeigen (wohin sich der Markt bewegt);
Durchbrochene Linien anzeigen — die durchbrochenen Niveaus anzeigen;
Punkt am Anfang der Linie anzeigen — zeigt Punkte an den Wendepunkten des Indikators an;
Anzahl der Berührungen anzeigen — zeigt die Anzahl der Berührungen in der Nähe des Linienkurses an;
Versatz für Berührungen (oberhalb/unterhalb des ZZ-Punkts, Punkte) — der Bereich, in dem der ZZ-Punkt als Berührung des Niveaus gewertet wird.
Aktuellen ZZ-Punkt anzeigen (Neuzeichnungs-Punkt) — den aktuellen (letzten) Punkt anzeigen;
Preis anzeigen — den Preis der Niveaus anzeigen;
Ziele anzeigen — die aktuellen Ziele anzeigen (wohin sich der Markt bewegt);
Durchbrochene Linien anzeigen — die durchbrochenen Niveaus anzeigen;
Überprüfen Sie den Durchbruch der Linien anhand des Kurses:
- Hoch-Tief (aktueller Balken)
- Hoch-Tief (vorheriger Balken)
- Schlusskurs (vorheriger Balken)
- Eröffnungskurs (aktuelle Kerze)
Punkt am Anfang der Linie anzeigen — zeigt Punkte an den Wendepunkten des Indikators an;
Anzahl der Berührungen anzeigen — zeigt die Anzahl der Berührungen in der Nähe des Linienkurses an;
Versatz für Berührungen (oberhalb/unterhalb des ZZ-Punkts, Punkte) — der Bereich, in dem der ZZ-Punkt als Berührung des Niveaus gewertet wird.
Benachrichtigungen
Popup-Benachrichtigungen — Popup-Benachrichtigung bei Berührung eines Niveaus;
Push-Benachrichtigungen — Push-Benachrichtigung;
E-Mail-Benachrichtigungen — Benachrichtigung per E-Mail;
Akustischer Alarm — akustischer Alarm bei Berührung eines Niveaus;
Benachrichtigung bei „Linienausbruch“ — Benachrichtigung, wenn das ZigZag-Niveau durchbrochen wird;
Alarm bei „Änderung der ZigZag-Richtung“ — Alarm bei Richtungsänderung des ZigZags;
Alarm bei „Kurs befindet sich in der Nähe der Linie“ — Alarm, wenn sich der Kurs in der Nähe des Niveaus befindet (einmal pro Balken, der aktuelle Punkt des ZigZags wird nicht überprüft);
Abstand zur Linie für die Warnmeldung (Punkte) – Abstand für die Warnmeldung (in Punkten);
Farben
Farbe der oberen Linie — Farbe der oberen Linien;
Farbe der unteren Linie — Farbe der unteren Linien;
Breite der Hauptlinie — Breite der Hauptlinie;
Stil der Hauptlinie — Stil der Hauptlinie;
Breite der verwendeten Linie — Breite der verwendeten Linie;
Stil der verwendeten Linie — Stil der verwendeten Linie;
Schriftgröße „Preise“ — Schriftgröße für die Preise;
Schriftgröße „Punkte“ — Schriftgröße für die Punkte;
Farbe „Zickzack“ — Farbe des Zickzacks;
Breite „Zickzack“ — Breite der Zickzacklinien;
Stil „Zickzack“ — Stil der Zickzacklinien;
Kerzen
Kerzen anzeigen — Aktiviert die Anzeige von Kerzen aus anderen Zeiträumen;
Kerzenzeitraum — Zeitraum für die Kerzen, alle Standardzeiträume sowie vierteljährlich;
Anzahl der Kerzen in der Vergangenheit — Anzahl der Kerzen im Chart;
Schattenfarbe — Farbe der Kerzenschwänze;
Körperfarbe (bullisch) — Körperfarbe einer bullischen Kerze;
Körperfarbe (bärisch) — Körperfarbe einer bärischen Kerze;
Punkte in globalen Variablen speichern — Punkte in den globalen Variablen des Terminals speichern;
Anzahl der zu speichernden Punkte — Anzahl der zu speichernden Punkte (aktueller Wert ist Null);
Präfix für globale Variablen — Präfix für die Namen der globalen Variablen.


Самый лучший индикатор который рисует структуру которую я видел, мультитаимфреймный анализ вообще идеальный. Спасибо)))