ZigZag Lines MTF for MT5
- Indicadores
- Versão: 6.5
- Atualizado: 19 julho 2026
- Ativações: 10

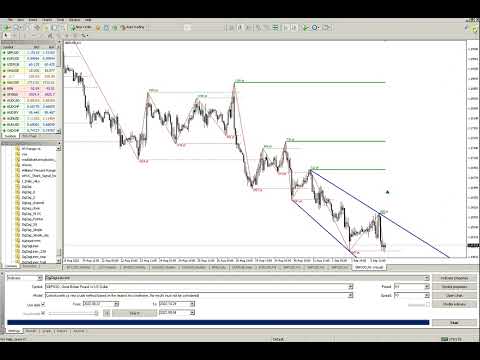
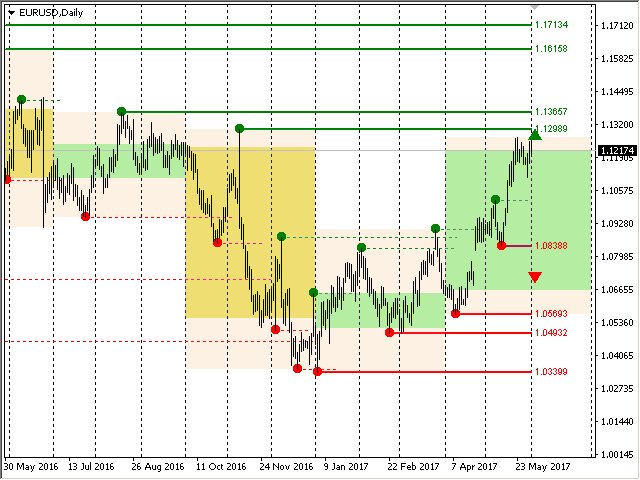
Indicador ZigZag de vários períodos de tempo. Ele exibe as linhas horizontais de suporte/resistência e seus rompimentos, bem como desenha as metas atuais do mercado. Também pode exibir linhas do indicador Fractais e velas de outros períodos (até Trimestral). Indicador – conecta máximas e mínimas importantes para mostrar linhas de tendência.
O indicador redesenha o último ponto (atual) e, em alguns casos, pode alterar os últimos 2-3 pontos.
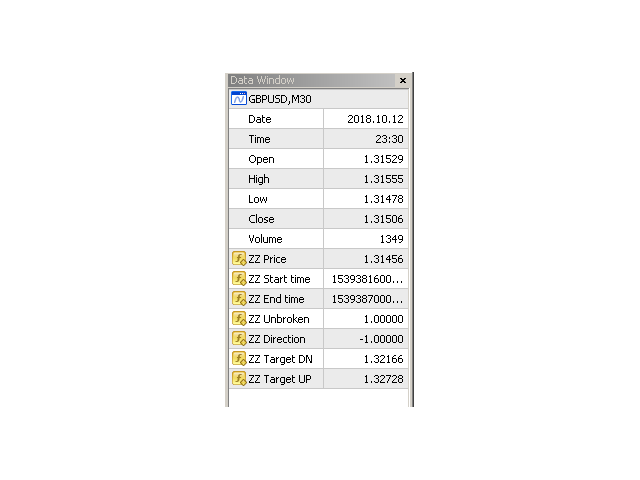
Todas as linhas são desenhadas como objetos (não buffers de indicadores, mas existe a possibilidade de receber os dados para o EA)
Quando usado em um Expert Advisor, você pode ler pontos ZigZag usando iCustom
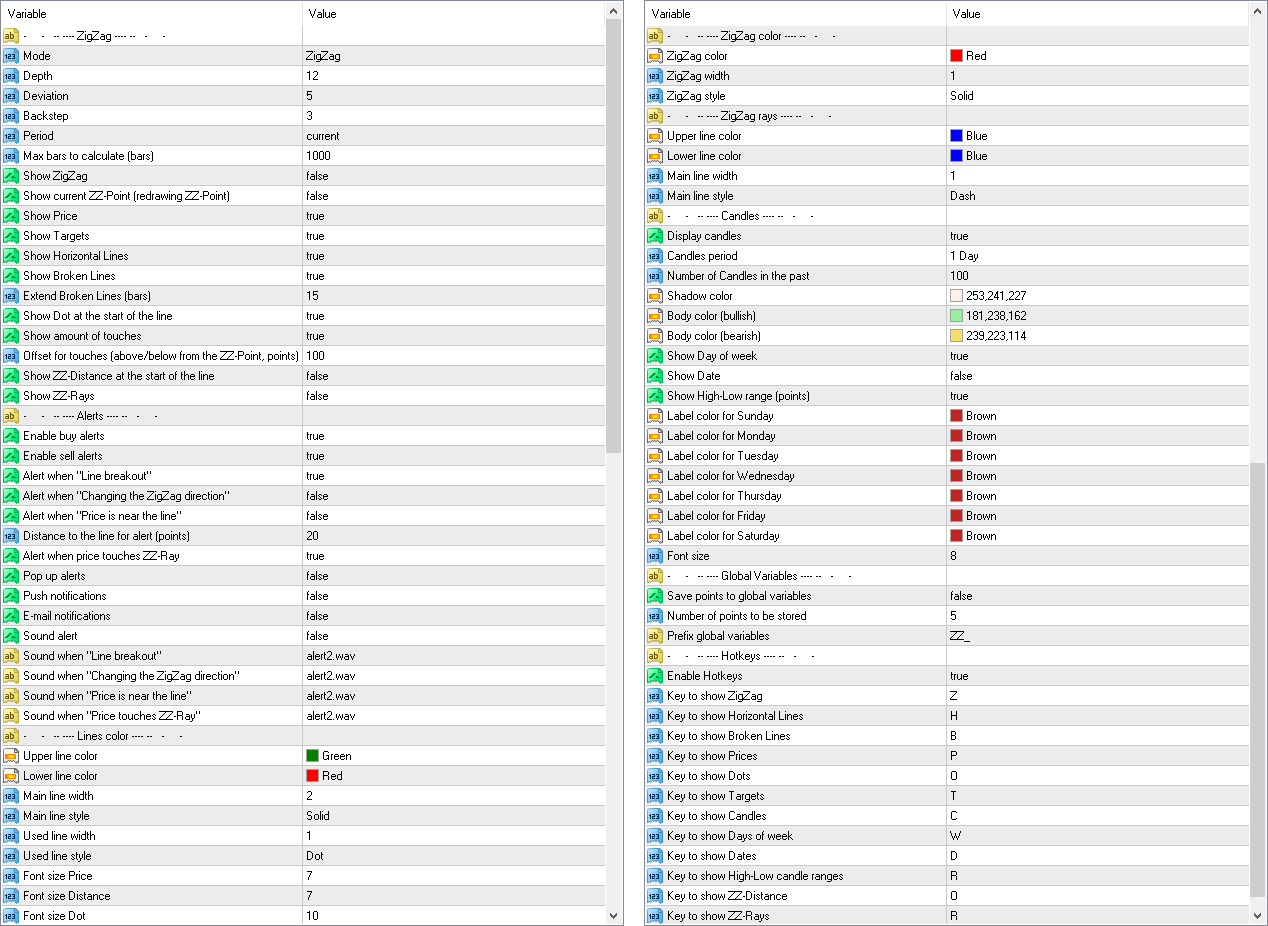
Configurações
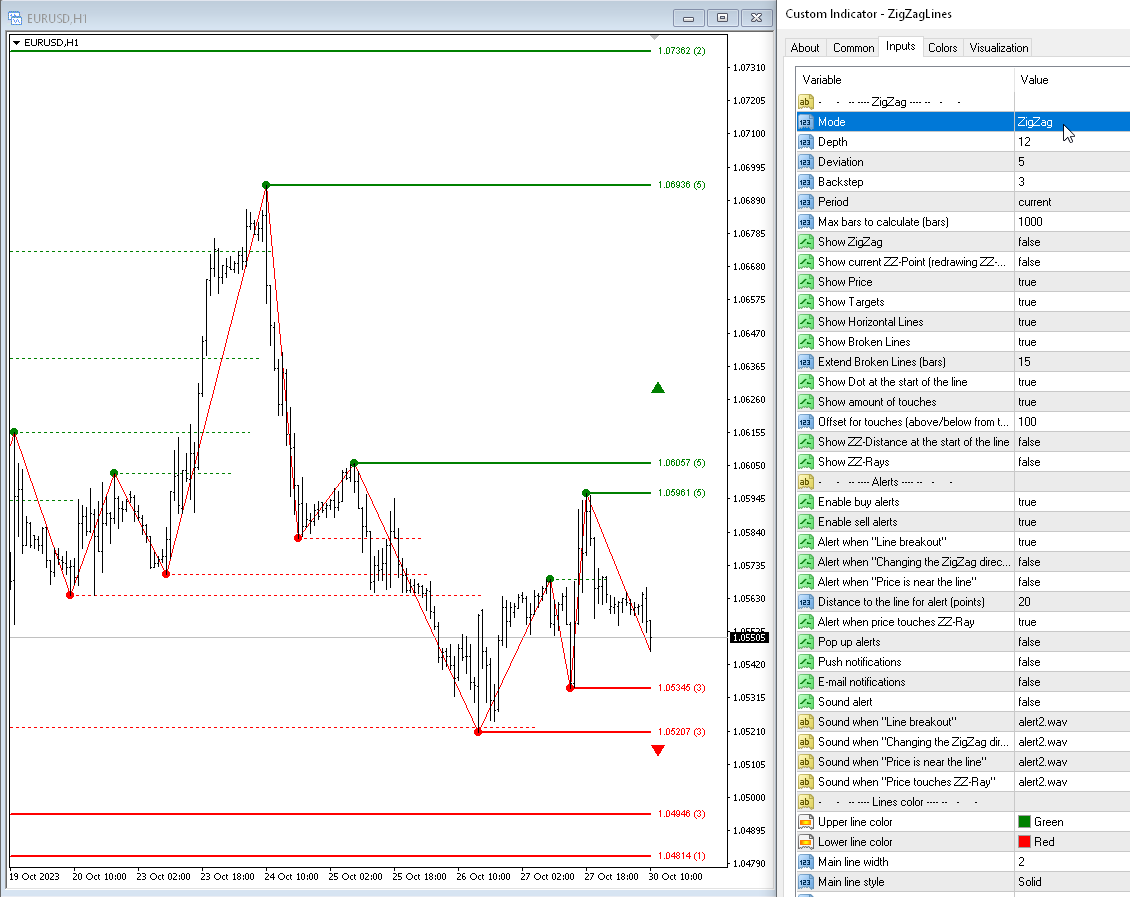
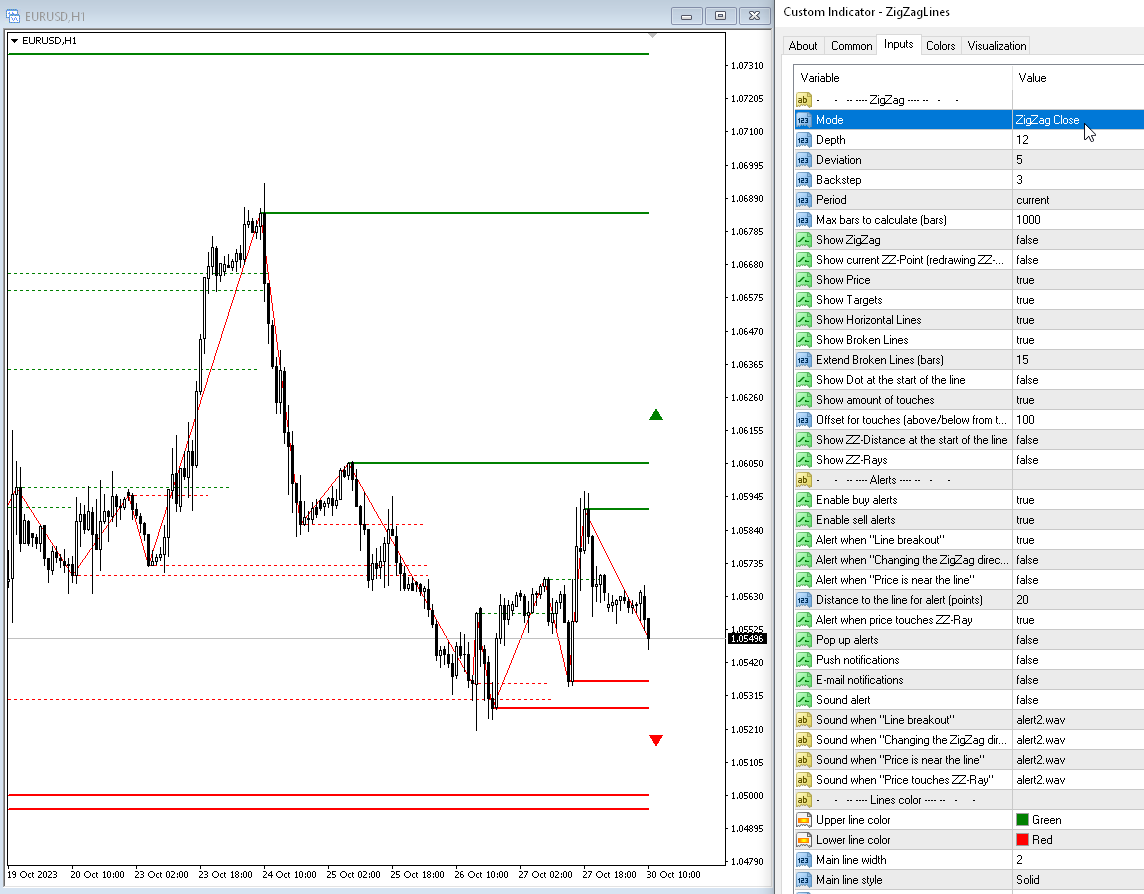
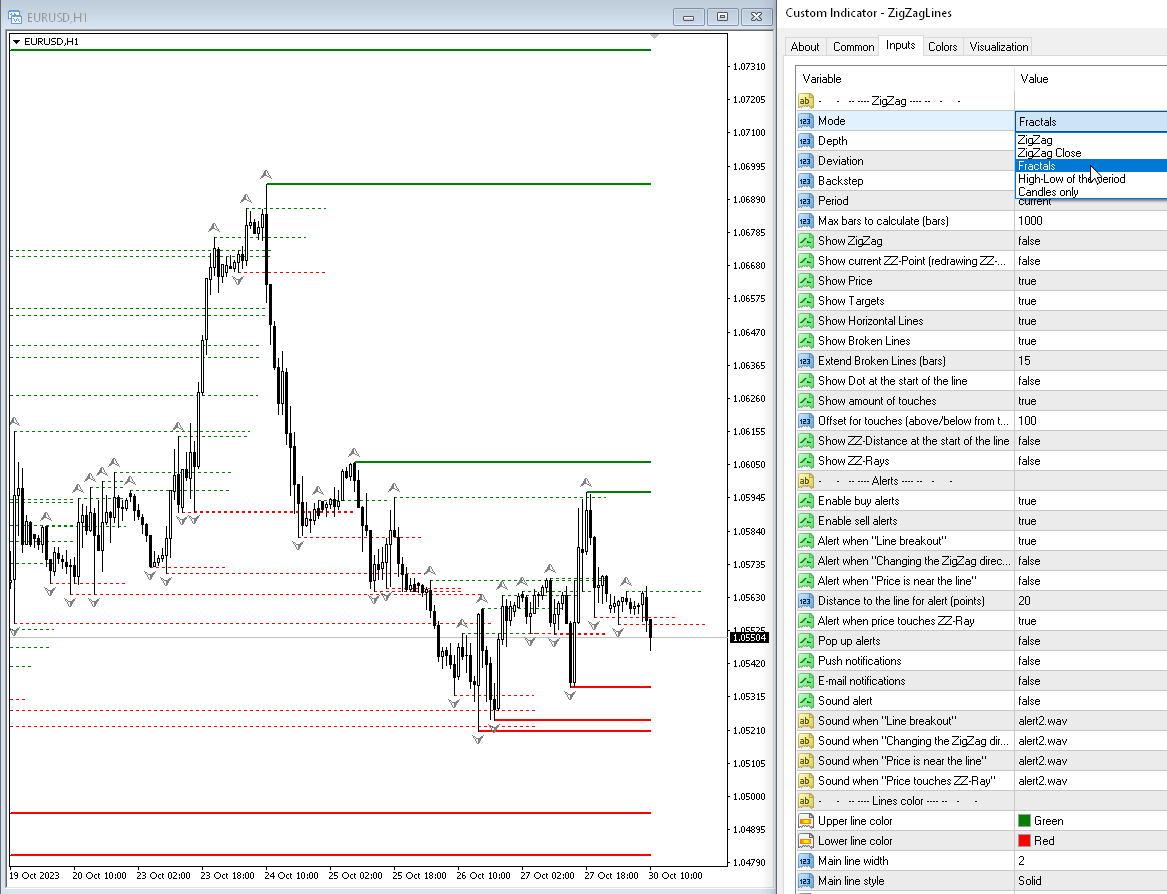
Mode — calcular níveis de suporte e resistência com base em:
— Zig Zag — o indicador ZigZag;— ZigZag Close — o indicador ZigZag Close;— Fractals — o indicador Fractais;— High-Low of the period — construção de um indicador por níveis high-low. O prazo é especificado no parâmetro Período;— Candles only — desenhe apenas velas;
Depth — número mínimo de velas, para as quais o Zigzag não sorteará o segundo máximo (ou mínimo), se o último for Desvio menor (ou maior) que o anterior;
Deviation — o número mínimo de pontos entre os Máximos/Mínimos de duas velas adjacentes para que o Ziguezague forme um topo/fundo local;
Backstep — o número mínimo de velas entre os máximos/mínimos locais;
Period — período para cálculo do ZigZag de Fractais;
Max bars to calculate (bars) — o número máximo de barras para cálculo. Esta limitação é introduzida para agilizar os cálculos;
Exibir no gráfico
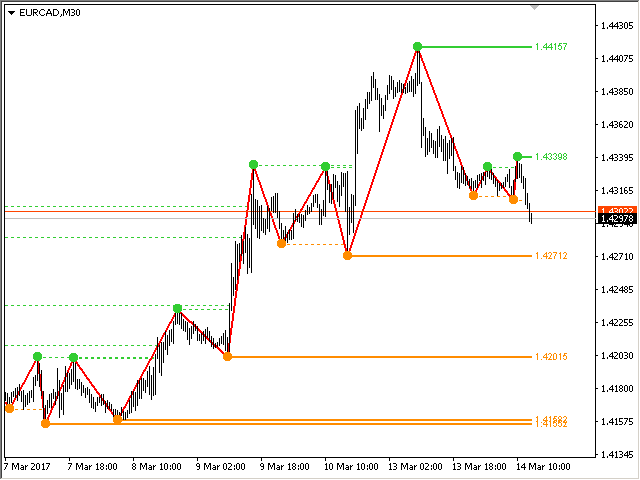
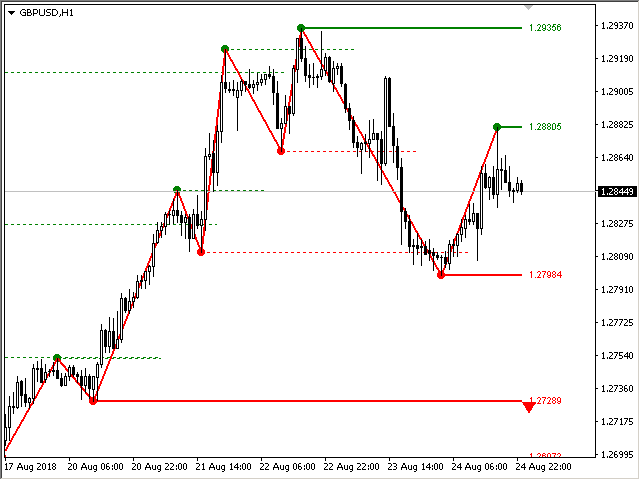
Show Zigzag — mostra o Ziguezague;
Show current ZZ-point (redrawing point) — mostrar ponto atual (último);
Show Price — mostra o preço dos níveis;
Show Targets — mostra as metas atuais (para onde o mercado está indo);
Show broken lines) — mostra os níveis quebrados;
Check the breakout of the Lines by price — Confira o desdobramento das Linhas por preço:
- High-Low (current bar) — Alto-Baixo (barra atual)
- High-Low (previous bar) — Alto-baixo (barra anterior)
- Close (previous bar) — Fechar (barra anterior)
- Open (current bar) — Aberto (barra atual)
Extend broken lines (bars) — estende as linhas quebradas para a direita pelo número especificado de barras;
Show Dot at the start of the line — exibe pontos nos pontos de viragem do indicador;
Show amount of touches — mostra a quantidade de toques próximo ao preço da linha;
Offset for touches (above/below from the ZZ-point, points) — a faixa na qual o ponto ZZ será considerado como tocando o nível.
Alertas
Pop up alerts — alerta pop-up ao tocar em um nível;
Push notifications — Notificação push;
E-mail notifications — notificação por e-mail;
Sound alert — alerta sonoro ao tocar em um nível;
Alert when "Line breakout" — alerta quando o nível do ZigZag for rompido;
Alert when "Changing the ZigZag direction" — alerta ao mudar a direção do ZigZag;
Alert when "Price is near the line" — alerta se o preço estiver próximo do nível (uma vez na barra, o ponto atual do ZigZag não é verificado);
Distance to the line for alert (points) — distância para alerta (em pontos);
Cores
Upper line color — cor das linhas superiores;
Lower line color — cor das linhas inferiores;
Main line width — largura da linha principal;
Main line style — estilo da linha principal;
Used line width — largura da linha usada;
Used line style — estilo da linha usada;
Font size price — tamanho da fonte dos Preços;
Font size dot — tamanho da fonte dos pontos;
ZigZag color — cor do ZigZagа;
ZigZag width — largura das linhas ZigZag;
ZigZag style — estilo das linhas ZigZag;
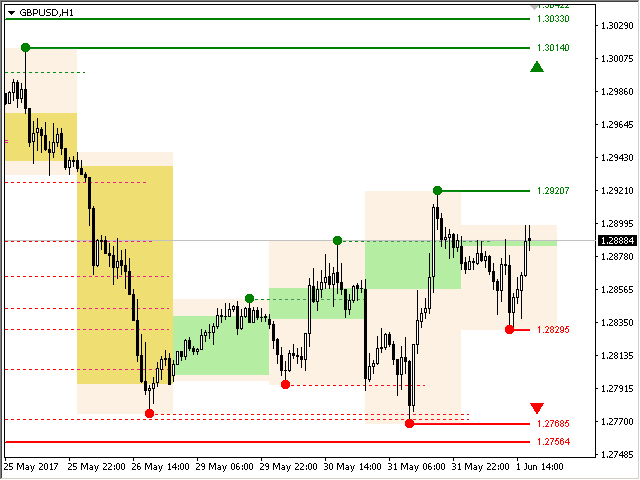
Velas
Display candles — habilita a exibição de velas de outros períodos;
Candles period — período das velas, todas padrão mais Trimestral;
Number of Candles in the past — o número de velas no gráfico;
Shadow color — vela dos pavios da vela;
Body color (bullish) — vela do corpo de uma vela de alta;
Body color (bearish) — cor do corpo de uma vela de baixa;
Save points to global variables — armazena pontos nas Variáveis Globais do terminal;
Number of points to be stored — número de pontos a serem armazenados (o ponto atual é zero);
Prefix global variables — prefixo para nomes de variáveis globais.


Самый лучший индикатор который рисует структуру которую я видел, мультитаимфреймный анализ вообще идеальный. Спасибо)))