Orynth
- Göstergeler
- Sürüm: 1.4
- Etkinleştirmeler: 5

Orynth P&F Chart Overlay – Clean Trend Visualizer
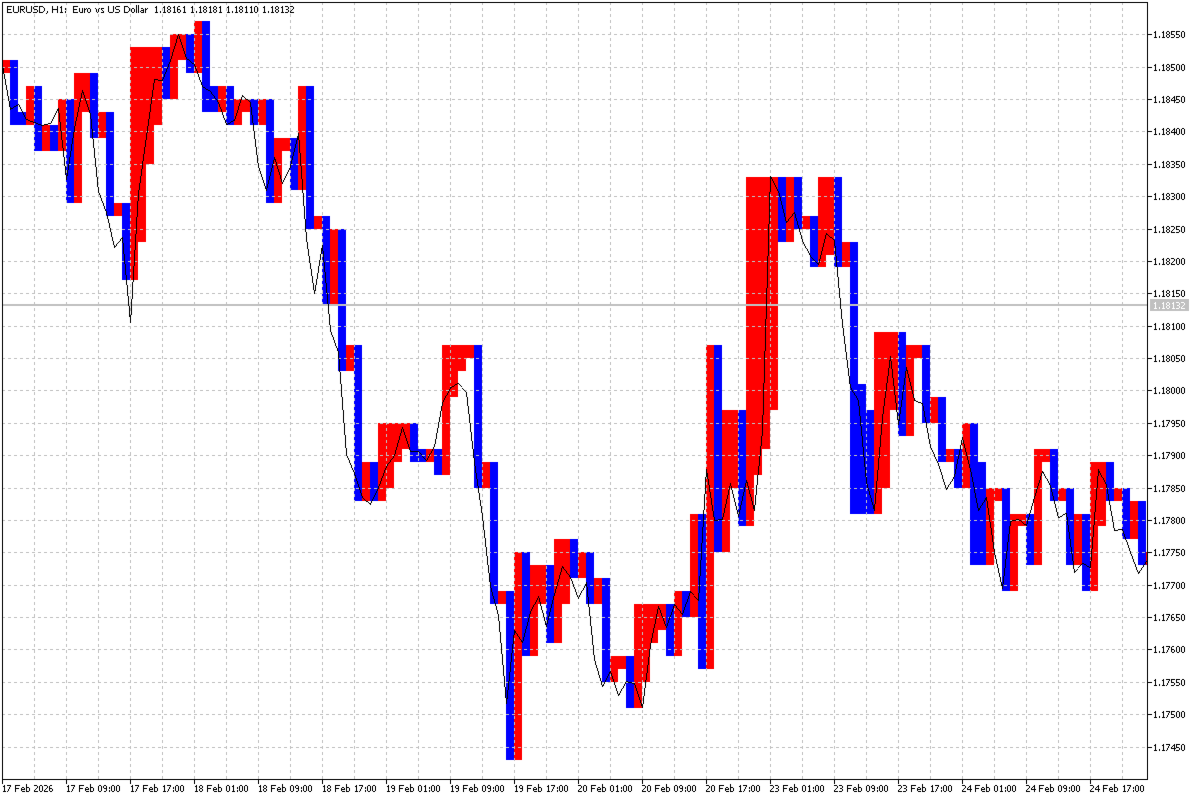
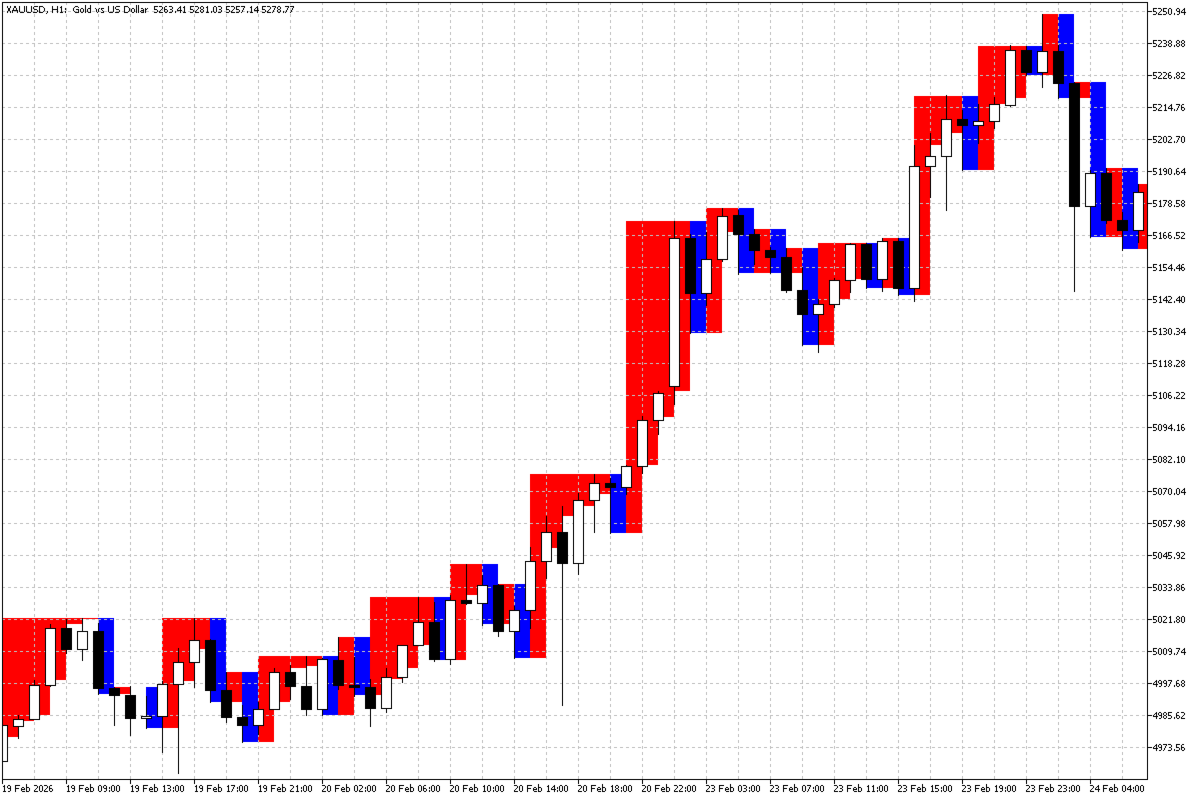
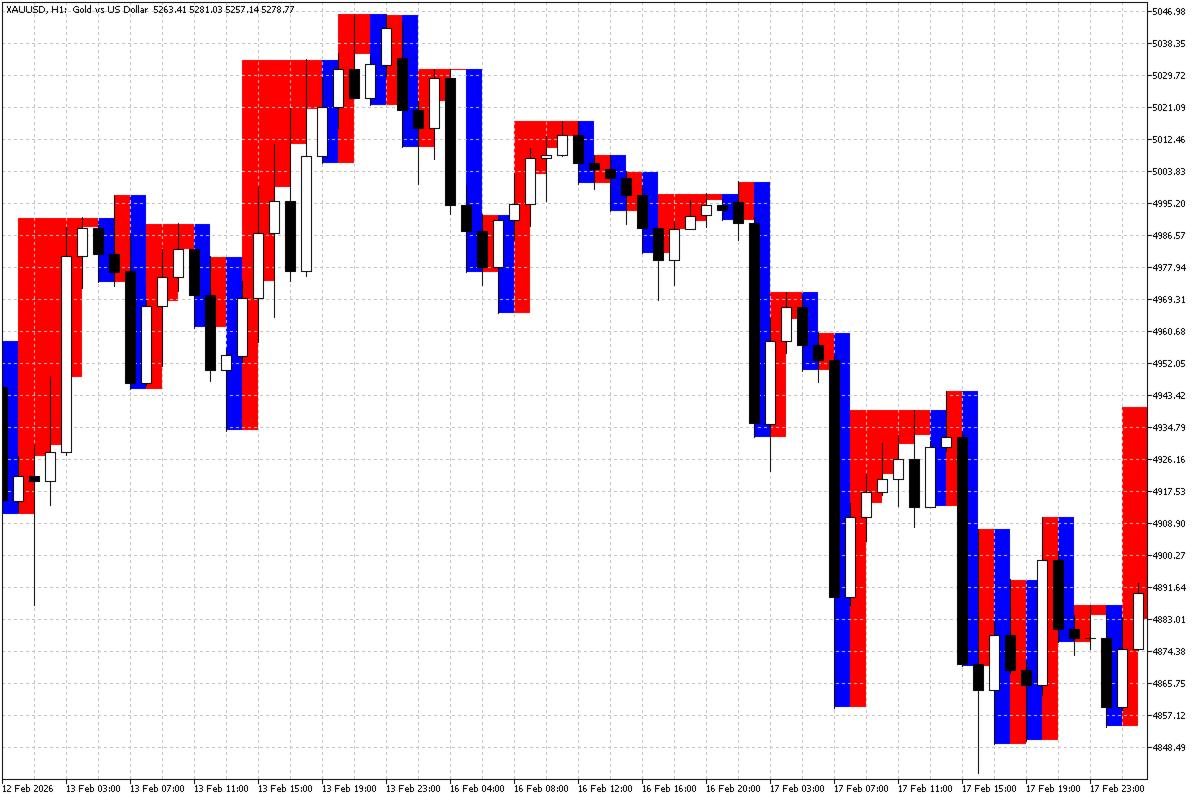
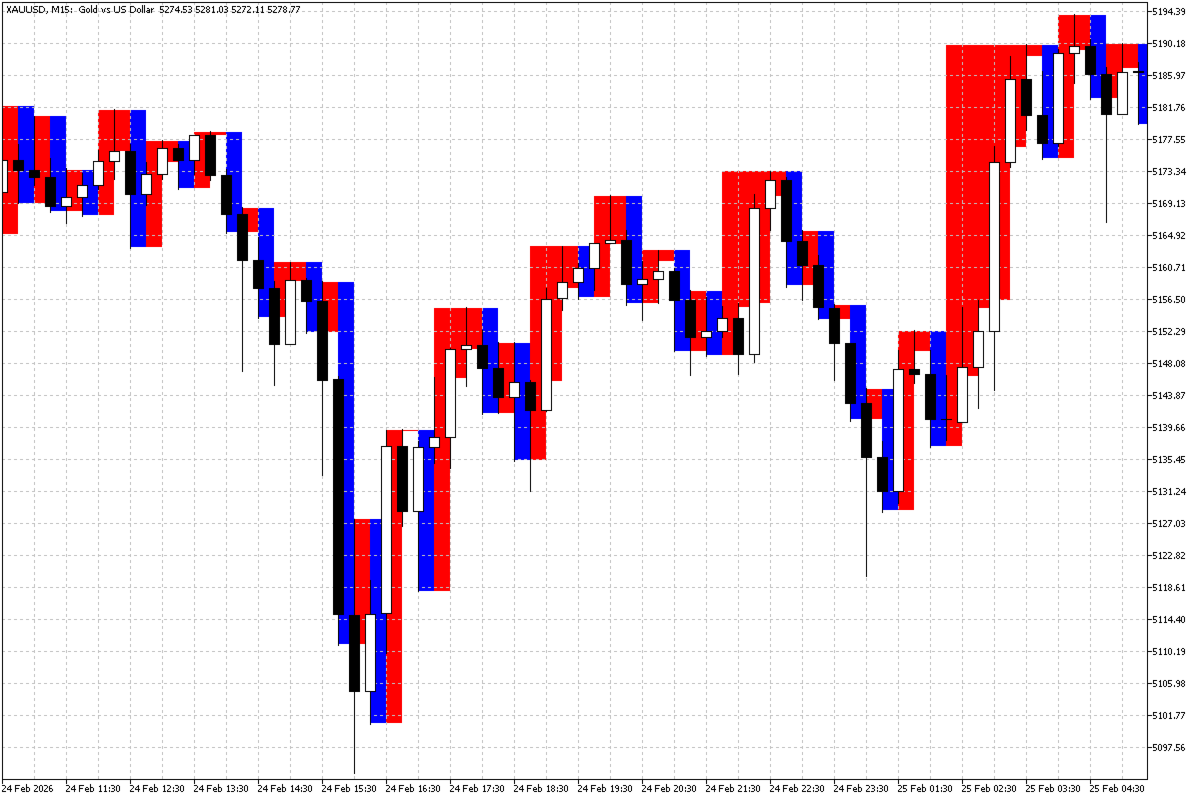
Orynth is a professional technical analysis tool that brings the power of Point and Figure (P&F) charting directly onto your standard candlestick chart. It filters out market noise by focusing solely on meaningful price movement, allowing traders to identify clear trends and reversals without the distraction of minor fluctuations.
Unlike traditional P&F charts that open in a separate window, Orynth overlays price "boxes" directly on your main chart, helping you synchronize classic price action with structured box-based trend logic.
🔹 Key Features
-
Noise Reduction – Only price movements that exceed your specified threshold (Box Size) are displayed.
-
Clear Trend Identification – Bullish and bearish sequences are visualized using customizable color blocks.
-
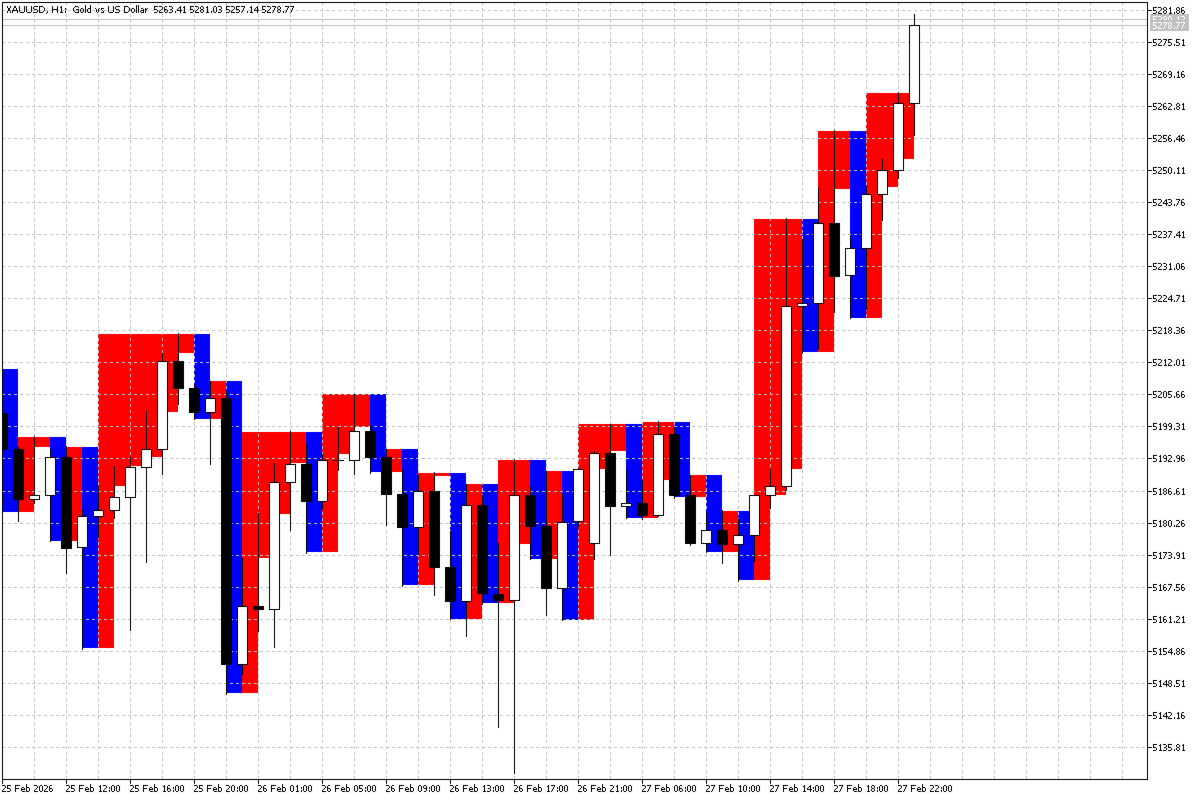
Hybrid Analysis – Combine the timing precision of Japanese Candlesticks with the structural clarity of Point and Figure logic.
-
Dual Platform Support – Fully optimized for both MetaTrader 4 and MetaTrader 5.
-
High Performance – Efficient code ensures smooth operation even when processing large historical datasets.
⚙ Input Parameters
-
Max Bars – Number of historical bars used for calculations (controls performance).
-
TicTacToe (Box Size) – Minimum price movement (in points) required to draw a new block.
-
BackOrLine – Toggle between background fill or foreground outlines for the boxes.
-
UpColor / DownColor – Fully customizable colors for bullish and bearish trends.
📊 How to Use
-
Attach the indicator to any symbol and timeframe.
-
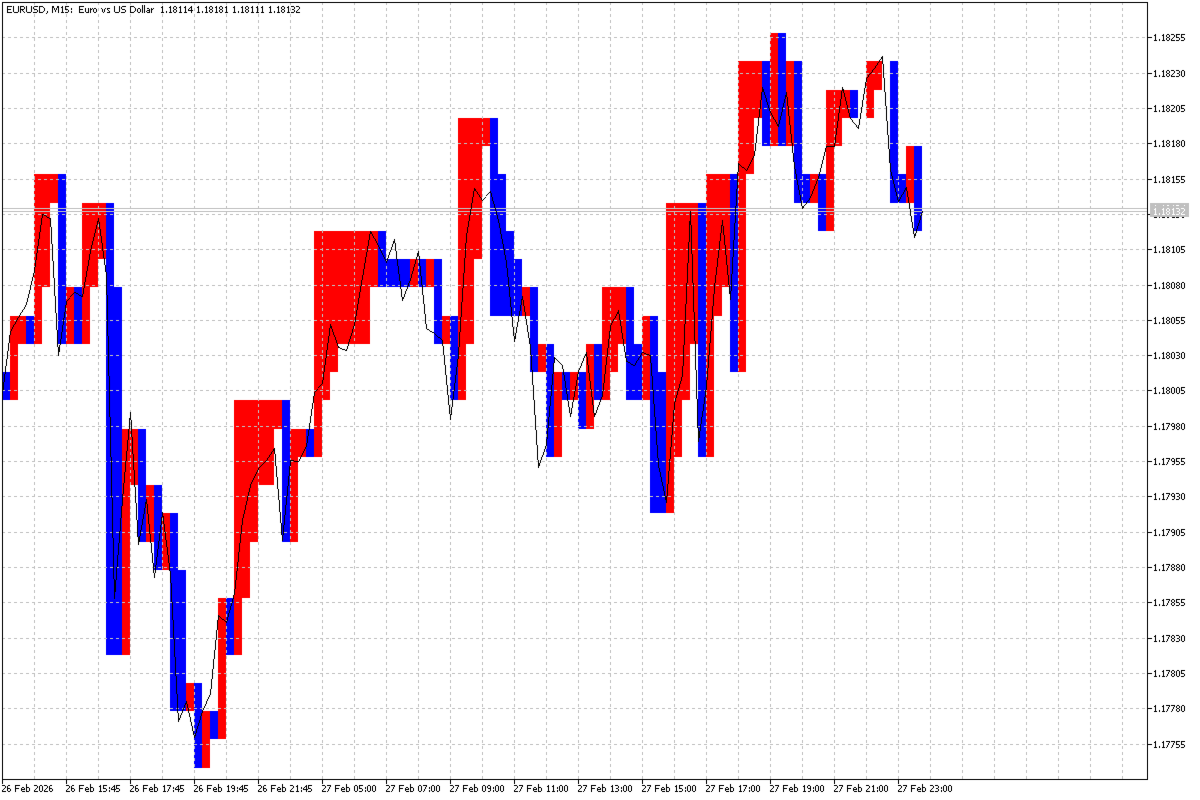
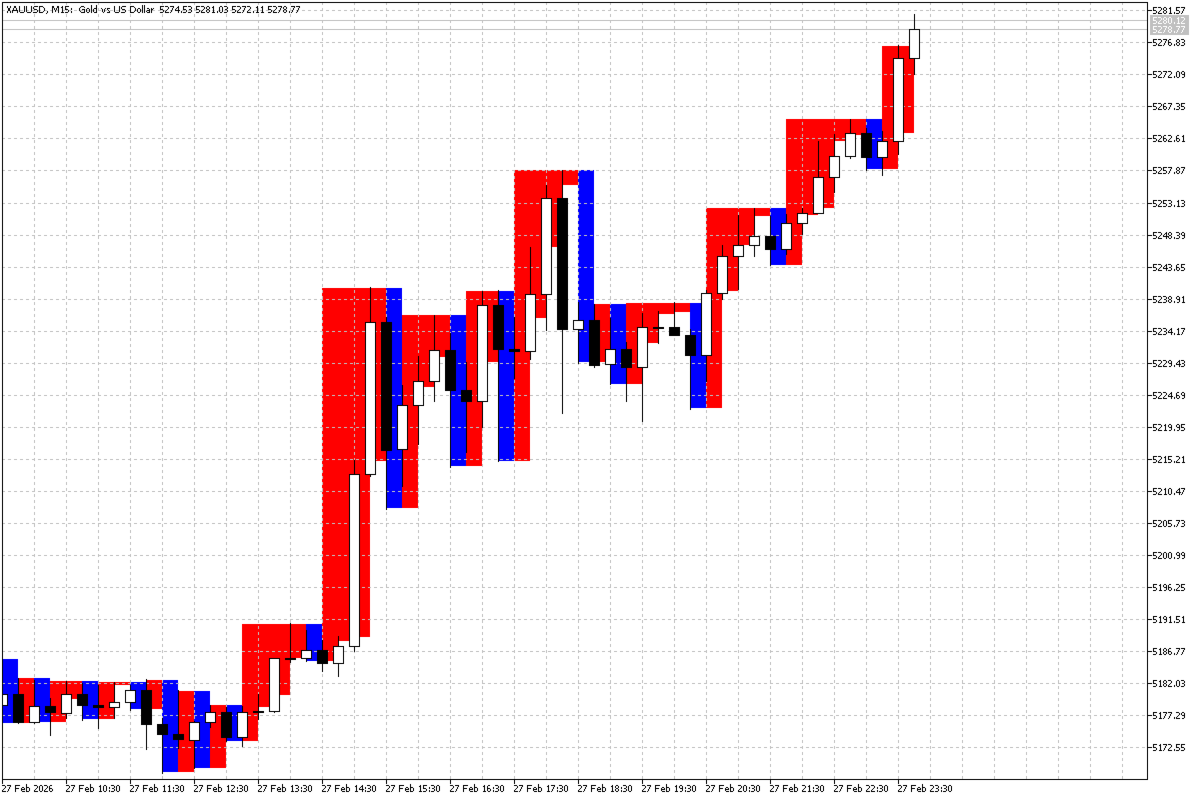
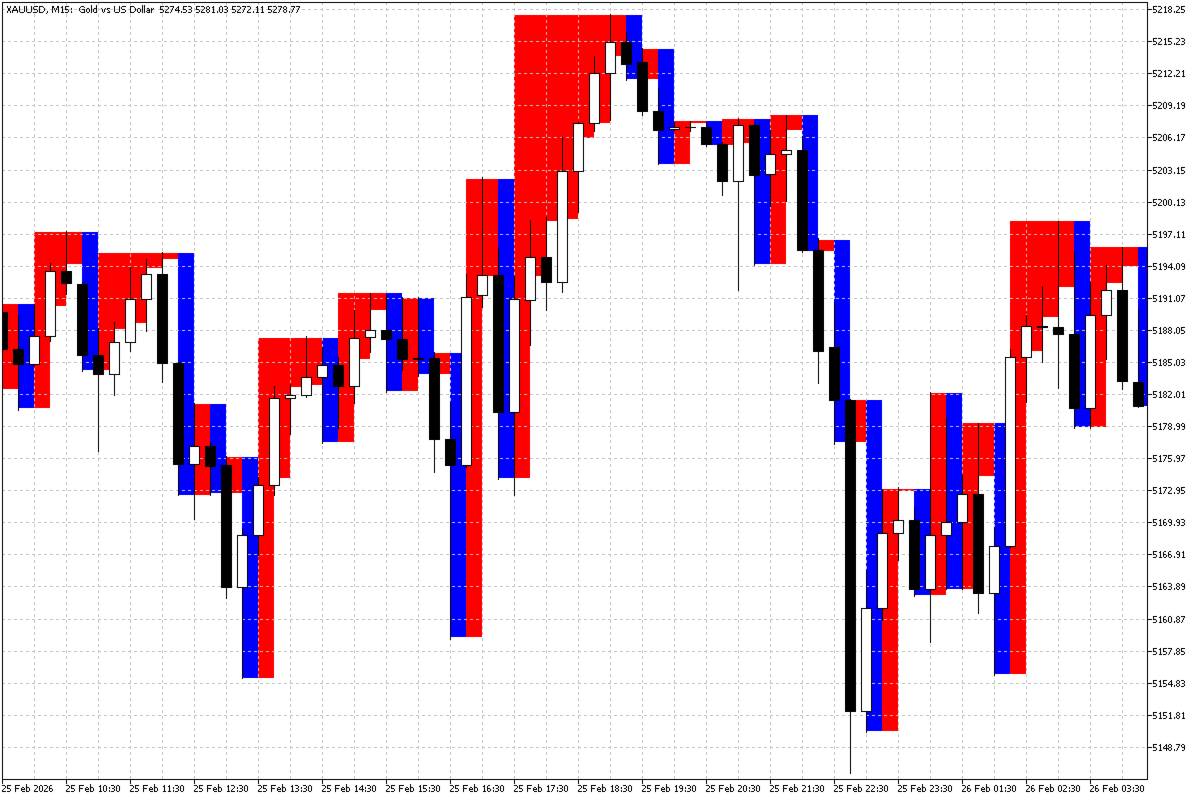
Adjust the TicTacToe parameter according to the asset’s volatility:
-
Higher values for H4 / D1
-
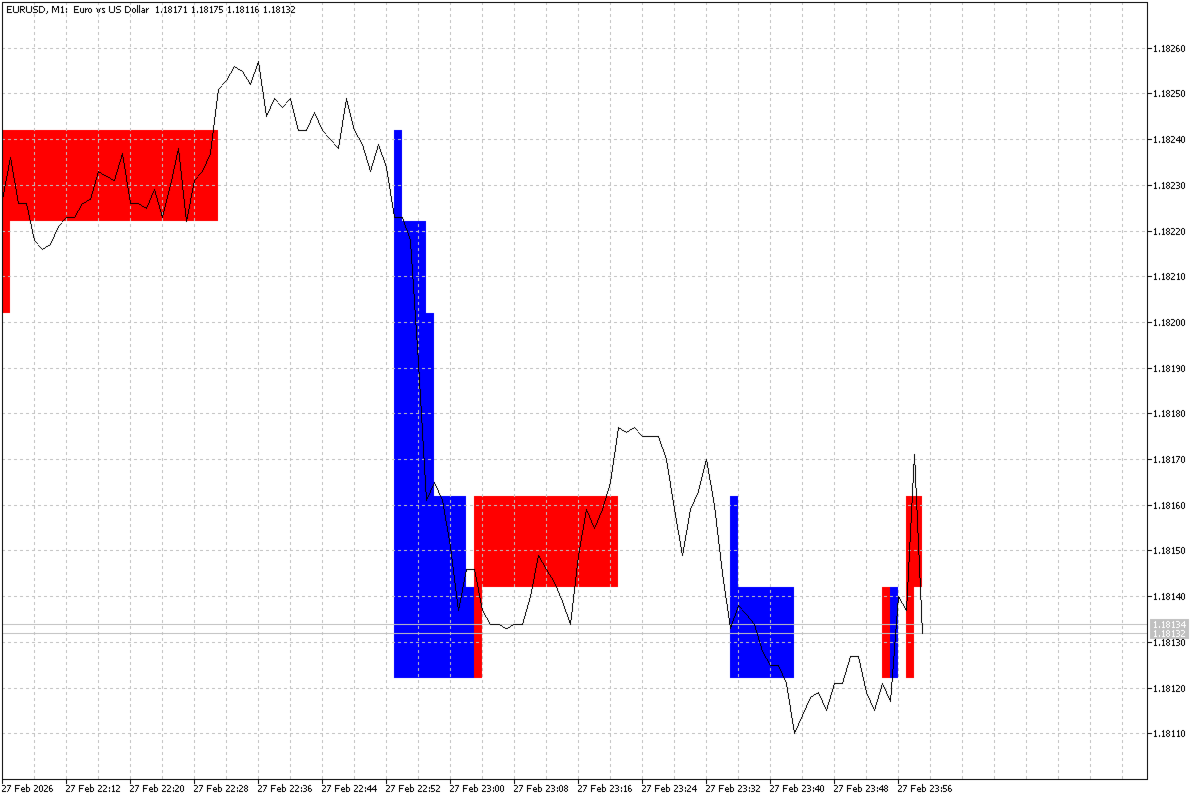
Lower values for M15 or scalping
-
-
Use the generated blocks to identify support/resistance levels and potential trend exhaustion zones.