Smart Depth Of Market
- Göstergeler
- Sürüm: 3.6
- Güncellendi: 9 Kasım 2024

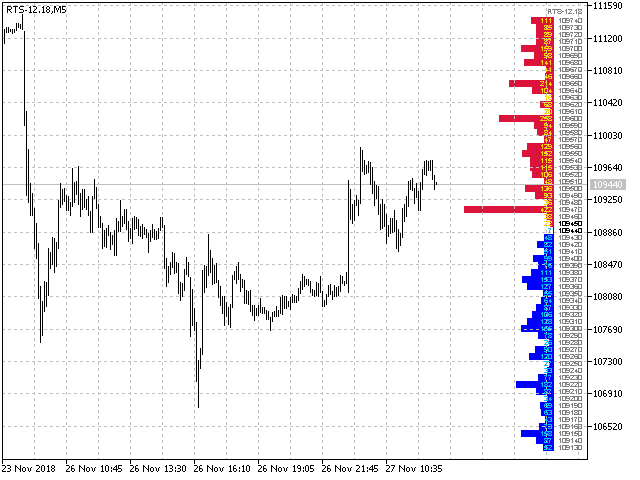
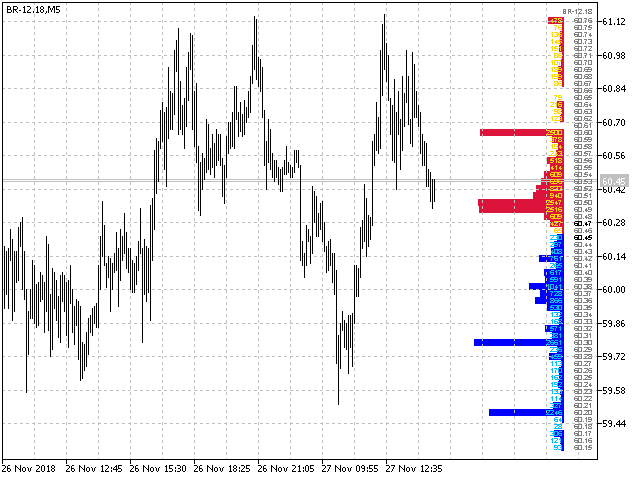
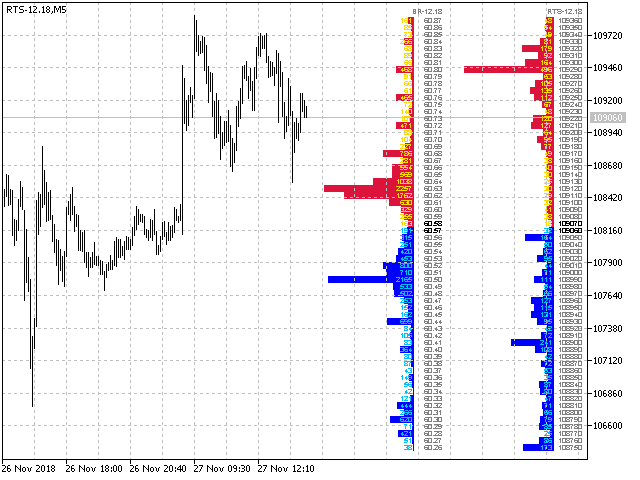
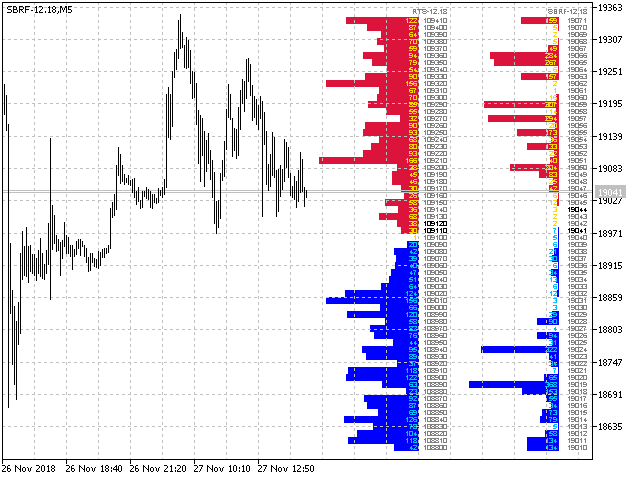
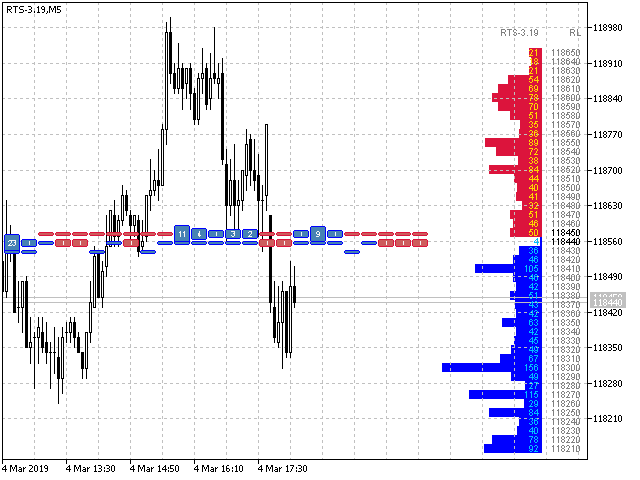
The indicator displays the orders book, as well as increases its depth, remembering the location of orders that have gone beyond the current "window" view.
Indicator capability
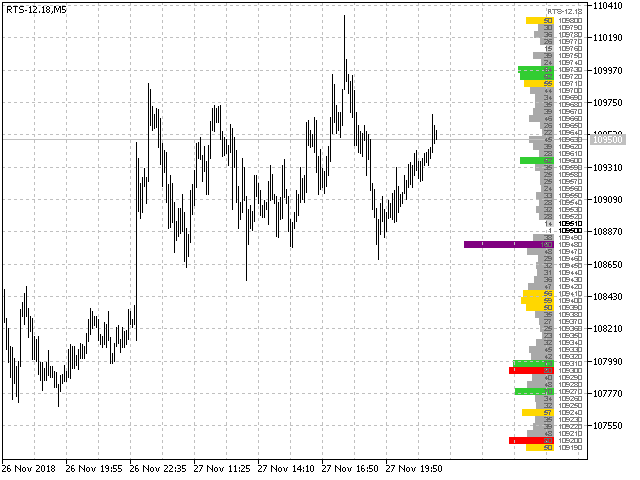
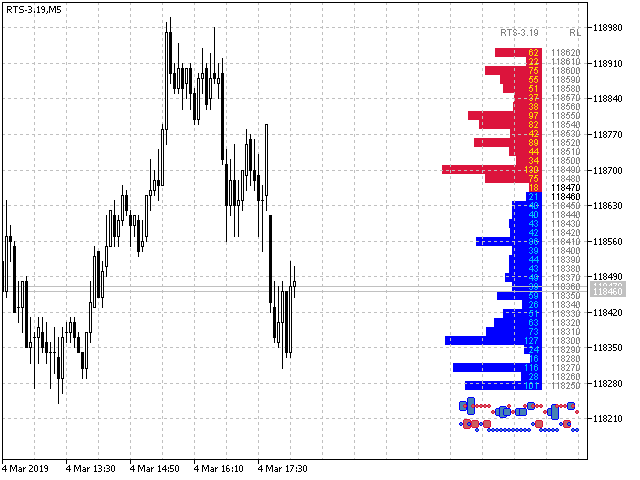
- Display the levels of open positions.
- Simulation of placing/cancelling/editing pending orders directly in the displayed orders book.
Indicator features
The orders book display works only on those trading symbols for which it is broadcast by the broker.
To reset the information about the rows that were recorded in the Smart mode, switch the indicator to the Fixation mode and double-click on the orders book title.
For currency pairs, as a rule, the deals tape is not broadcast, so the input variable ProfileCalculation must be switched to the Interpretation state. In addition, it is desirable to use the input variable RowsUnite, which groups the rows by a specified number of points (for example, ten).
Input variables
A description of the input variables is attached on the "Comments" tab in post 55 of 26.11.2021.

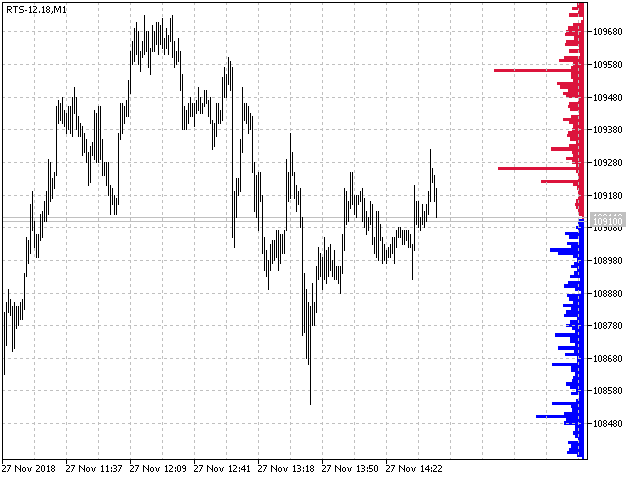
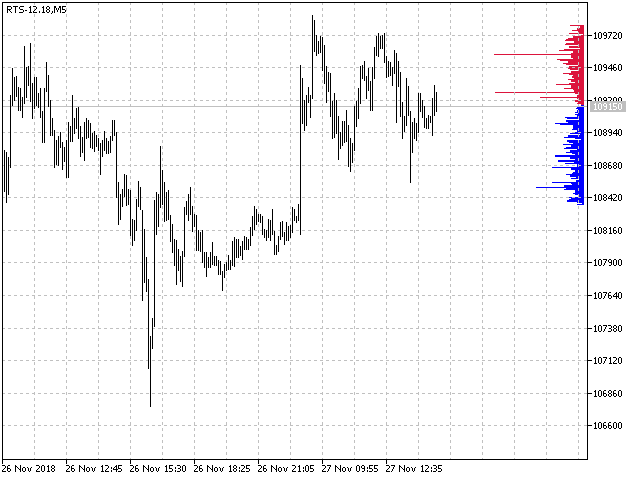


As author already mentioned first, the volume appears and is accumulated, and only then the price moves. It is all said.