 MetaTrader 5
 Uzmanlar
 Göstergeler
 Kütüphaneler
 Yardımcı programlar
 Widget'lar
 Kurallar
YouTube'dan Mağaza ile ilgili öğretici videoları izleyin
Bir alım-satım robotu veya gösterge nasıl satın alınır?
Uzman Danışmanınızı
sanal sunucuda çalıştırın
sanal sunucuda çalıştırın
Satın almadan önce göstergeyi/alım-satım robotunu test edin
Mağazada kazanç sağlamak ister misiniz?
Satış için bir ürün nasıl sunulur?
MetaTrader 5 için Teknik Göstergeler - 84
 Teknik göstergelerden gelen sinyaller, borsa ve Forex piyasalarında işlemler açılması ve kapatılmasında çok önemli bir rol oynar. Göstergeler, fiyat değişikliklerini tahmin etmeyi amaçlayan, finansal sembol fiyatının matematiksel dönüşümüdür.
Piyasa davranışını daha iyi tahmin etmek ve bundan kar elde etmek için teknik göstergeleri test edin.
RTS5PatternBTCPrice is an analytical tool for MetaTrader 5 that systematically searches for historical similarities in price action and evaluates how the market behaved after similar situations.
The indicator provides both visual and statistical information that can be used to support trading decisions. It compares the current price pattern, defined by a selected number of candles, with historical data.
The similarity results are displayed using a histogram with three categories: Good Match –
FREE

Session & Spread HUD A lightweight display utility that places a real-time information panel in the top-right corner of any chart. No trading logic, no alerts — just clean, always-visible data while you trade. What It Shows The HUD displays four pieces of information, updated on every tick: Session — The currently active trading session based on your broker's server time. Automatically identifies Asia, London, New York, and the London/NY overlap. Displays "Closed" outside all sessions. Spread —
FREE

ATR Candles (Average True Range as OHLC candles) ATR Candles visualizes Average True Range (ATR) in a separate subwindow using candlestick-style OHLC bars . Each candle represents the change in ATR from the previous bar, making it easy to see volatility expansion and contraction over time. Key features: ATR shown as OHLC candles (open = previous ATR, close = current ATR) Input: ATR period Two color modes : Match price candle direction (bull/bear) Independent: green/red based on current ATR close
FREE

TPB – Trend Geri Çekilme Davranışı Fiyat: $0 Platform: MetaTrader 5 Tür: Piyasa koşulu göstergesi (otomatik olmayan) Genel Bakış Bu gösterge, piyasa yapısını ve işlem ortamlarını incelemek için tasarlanmış analitik araçlardan oluşan GomerAI Market Research Framework’ün bir parçasıdır. Her gösterge, yatırımcıların ve otomatik işlem sistemlerinin mevcut piyasa koşullarını daha iyi anlamasına yardımcı olmak için piyasa davranışının belirli bir yönüne odaklanır. TPB (Trend Pullback Behavior), fiyatı
FREE

If you are Looking Best indicators in Mql5 Market. Check these out!
SSS Scalping Smart Signals MT5 Indicator
Scalping Winning Signals Pro SWS
LTL Long Trend Locator
The Ultimate FXIFY Challenge Protection Dashboard for MetaTrader 5 Trade with Confidence. Stay Within the Rules. Pass Your FXIFY Challenge. Passing an FXIFY challenge requires more than profitable trading—it requires strict compliance with the firm's risk management rules. Many traders lose their funded opportunity not because o
FREE
Your swiss army knife to ancipate price reversals
This indicator anticipates price reversals analyzing bullish and bearish pressure in the market. The buying pressure is the sum of all the accumulation bars over a certain number of days, multiplied by the volume. The selling pressure is the sum of all of the distribution over the same number of bars, multiplied by the volume. It gives you a measure of the buying pressure as a percentage of the total activity, which value should fluctuate from 0
FREE

If you like this product, please give it a 5 star rating as a token of appreciation.
This indicator draws vertical lines marking key Forex trading sessions (Asian, London, New York) for a configurable number of past days. These “Silver Bullet” lines help traders quickly visualize session start and end times on the chart.
DaysToDisplay: How many previous days’ session lines to show. Session colors: Customizable line colors for each session. Session start hours: Local server hours for each sessi
FREE

NeuraVault Pro v1.0 - Professional RSI Reversal Trading System Overview NeuraVault Pro is a professional automated trading system based on RSI (Relative Strength Index) reversals. It is designed to capture reversal opportunities in overbought and oversold zones, equipped with advanced filters and comprehensive risk management features. Trading Logic Core Strategy: RSI Reversal The EA captures reversal opportunities when the market reaches overbought or oversold zones: BUY Signal: RSI value drops
FREE

The Candle Smoother is an indicator for MetaTrader 5 that helps you see price movements more calmly and clearly. It removes unnecessary "market noise" and displays the true trend more effectively.
What does the "Candle Smoother Indicator" do?
It smooths the classic candlestick data (Open, High, Low, Close). This filters out chaotic, hectic candles. Additionally, an EMA line (Exponential Moving Average) is calculated based on the smoothed prices. This helps you better recognize where the market
FREE

Idea The idea is — it seems to me that exactly at 10:00 EURUSD always goes up. How can this be verified? This indicator analyzes historical data at the same hour of the day over the past N days and shows: ProbUp — the probability that after a given number of bars ( HorizonBars ) the price will be higher; ZEdge — the “strength” of the signal = average move / dispersion. This allows you to understand: “In 70% of cases, after 3 bars during this hour the market moved up.” “The signal is
FREE

Executive Summary Total Profit Buy/Sell Indicator is a comprehensive real-time dashboard that displays all your trading statistics in one organized panel. Perfect for traders who want instant visibility of their positions, profits, and market conditions without switching between multiple windows. Key Features Complete Position Overview Profit by Direction : Separate tracking of Buy vs Sell profits Lot Size Monitoring : Total volume in both directions Position Count : Number of ac
FREE

Dynamic Range Pro — MetaTrader 5 indicator Dynamic Range Pro is a free MetaTrader 5 indicator that plots a price channel from the highest high and the lowest low over a set number of bars, with a midline halfway between them. It works on any symbol and timeframe. What it shows Upper and lower channel lines that act as dynamic resistance and support A midline that marks the middle of the recent range Possible breakouts when price closes outside the channel Input PeriodPR: number of bars used to c
FREE

TerminalBridge Account Analytics is an on-chart account statistics indicator for MetaTrader 5.
It organizes closed trading activity into day, week, month, quarter and year views. Account-wide records include all symbols by default.
Main features
- Live floating profit or loss - Recorded daily maximum floating loss - Floating-loss percentage, occurrence time and data status - Today, All, Last 1 Month, Last 3 Months and Custom history ranges - Built-in calendar for custom date selection - Filt
FREE
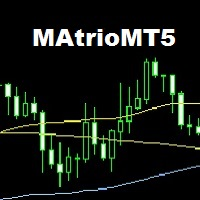
The MAtrio indicator displays three moving averages on any timeframe at once with a period of 50-day, 100-day, 200-day. After attaching to the chart, it immediately displays three moving averages with the parameters of simple (SMA) moving average MAmethod50 , simple (SMA) moving average MAmethod100 , simple (SMA) moving average MAmethod200 . Accordingly, with the price type MAPrice50 , MAPrice100 , MAPrice200 , by default, the price is Close price everywhere. All parameters (MA calc
FREE
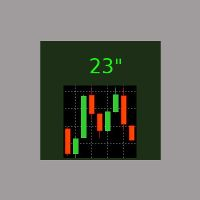
It is the simplest indicator in existence. It has only one function: report the seconds elapsed since the last minute end in a very convenient way, with a label that can be moved in the chart, so that the trader does not have to take his eye off the forming candle. It is used on M1, but also on larger intervals, for those interested in opening/closing positions at the best time. Sometimes an intense movement in the last 10" of the minute gives indications of future trend, and can be used for sc
FREE

A ideia do indicador é mudar de cores assim que o candle viole a banda; Caso o candle viole a banda superior, pinta o candle de vermelho, Caso o candle viole a banda inferior , pinta o candle de verde, Se o candle passar em algum momento pela média, ele assume uma cor acinzentada; Os candles que não passem pela média, nem violem a banda, apresentarão cor verde fraca, se for de alta e cor vermelha fraca se for de baixa. Projeto concebido no canal Aprenda a programar, keltner cores.
FREE

TBC...#property copyright "Phoenix Trading Copyright 2026, MetaQuotes Ltd." #property link " https://www.phoenixautrading.com/ " #property version "1.0"// Current version of the Expert Advisor #property icon "Phoenix.ico" #property description "At Phoenix Trading, we specialize in the engineering of high-precision MQL5 Expert Advisors," #property description "designed to transform market volatility into consistent opportunities. Our EAs are built for the modern trader, comb
FREE
We have all seen a currency pair enter the overbought or oversold territory and stay there for long periods of time. What this indicator does is gives you the emphasis. So if you are looking for reversals then you may want to take notice when oversold territory is entered into with a bullish engulfing candle or if the trend is your thing then check for bearish engulfing candles while entering oversold. This indicator will show a downward arrow when it detects a bearish engulfing candle while cro
FREE

Индикатор Envelopes gaussian - это стандартный Envelopes с обработкой фильтром Гаусса. Преимущество данного индикатора в меньшем запаздывание от стандартного индикатора.
Входные параметры: Period - период индикатора по умолчанию 14 Deviation - ширина канала по умолчанию 0.1 Shift - смещение индикаторных линий от цены в барах. По умолчанию 0 Индикатор пригоден для использования в советниках
Буфер 0 — верхняя линия индикатора;
Буфер 1 — нижняя линия индикатора;
FREE

PFG Status Badge The PFG Status Badge is a free companion indicator for the PropFirmGuardian EA Suite . It displays a compact real-time status badge on your chart showing the current Guardian protection state at a glance. Features Compact status badge displayed on chart Shows current PropFirmGuardian protection state Color-coded: green for active, orange for warning, red for blocked Works on any symbol and timeframe Designed to run alongside the PropFirmGuardian EA Requirements This indicator is
FREE

Name: Dynamic Fibo Retracement Short Description: An intelligent tool that automates the plotting of Fibonacci Retracement levels to help you effortlessly identify key potential support and resistance zones. Full Description: Tired of manually drawing Fibonacci lines for every new market swing? The Dynamic Fibo Retracement indicator automates this crucial process for you. It intelligently scans a user-defined number of past bars to find the most recent significant high and low, then instantly pl
FREE

PFG Risk Meter The PFG Risk Meter is a free companion indicator for the PropFirmGuardian EA Suite . It displays real-time daily and total drawdown as visual gauge panels on your chart, giving you instant visual feedback on your prop firm rule status. Features Live daily drawdown gauge Live total drawdown gauge Color-coded warning and danger zones Works on any symbol and timeframe Designed to run alongside the PropFirmGuardian EA Requirements This indicator is part of the PropFirmGuardian EA Suit
FREE

PFG Lot Calculator The PFG Lot Calculator is a free companion indicator for the PropFirmGuardian EA Suite . It calculates and displays the correct lot size based on your account balance and risk percentage, directly on your chart. Features Real-time lot size calculation Based on account balance and risk percentage Displays recommended lot size on chart panel Works on any symbol and timeframe Designed to run alongside the PropFirmGuardian EA Requirements This indicator is part of the PropFirmGuar
FREE

This indicator will help you track performance of your trades, even scalping trades. You can use it with the Arab, and many other traders.
This indicator displays essential trading account information directly on your chart. It positions itself in one of the four corners of the screen and showcases details such as: Symbol: The symbol of the asset currently displayed on the chart. Profit/Loss: The total profit or loss in dollars for the current symbol. Pips: The total number of pips gained or
FREE

Indicator Description: Market Session Overlay The Market Session Overlay indicator for MT5 visually highlights the key global trading sessions — Asian, European, and American — directly on your chart.
It allows traders to clearly identify the time ranges of each session and their respective highs, lows, and opening levels, improving session-based analysis and strategy execution. Features: Draws colored rectangles for each session (Asian, European, American) on the chart.
Configurable se
FREE

The "Price change from zero" indicator is designed to display price changes over a selected period in points.
1. The basic idea The indicator calculates the difference between the closing price on the current bar and the opening price on the bar set back by the Candle Period. The result is displayed as a line in a separate window.
2. Interpretation Positive value: The price has increased over the period.
Negative value: The price decreased during the period.
Zero value: The price has retur
FREE

Fair Value Gap Scanner LITE identifies institutional imbalances directly on your chart — no manual scanning, no guesswork. A Fair Value Gap forms when price moves so aggressively that a candle's range is skipped entirely, leaving an unfilled imbalance in the market. Smart money consistently returns to these zones, making them high-probability areas for entries, targets, and stop placement. What the indicator does: Scans H4 and D1 timeframes automatically Draws bullish and bearish FVG zones direc
FREE

ENGLISH VERSION TrendMatrix HA SCORE v2.74 — Professional Click Priority Ecosystem TrendMatrix HA SCORE is a high-performance analytical hub for MetaTrader 5. It uses a unique Triple Logic engine to evaluate the market across 21 timeframes simultaneously, providing a normalized consensus on trend strength and direction. Triple Logic Scoring (Max 6 Points) Every timeframe button displays a real-time calculation: HA / WPR / ADX = TOTAL . Heiken Ashi (HA): Up to ±2 points (Trend quality and
FREE
The new version of MirrorSoftware 2021 has been completely rewriten and optimized.
This version requires to be loaded only on a single chart because it can detect all actions on every symbol and not only the actions of symbol where it is loaded.
Even the graphics and the configuration mode have been completely redesigned. The MirrorSoftware is composed of two components (all components are required to work): MirrorController (free indicator): This component must be loaded into the MASTER
FREE

This indicator provides common shapes as drawing object options. The shapes are rotatable, resizable, draggable, and will keep their proportions (according to their handle trendline) across different chart scales. Multiple drawings are supported.
Shapes: Square Rhombus
Triangle (quadrilateral & isosceles) Circle (grid, overlapped grid, flexi grid, rotatable grid, concentric circles) Features: rays (all object edges will be rays) show/hide each individual drawing type, or all delete last drawn ob
FREE

MTF TradeDeck is an all-in-one trading dashboard for MetaTrader 5 that combines multi-timeframe visualization, line-cross alerts, a lot-size calculator, symbol switcher, and Forex session boxes in a single indicator. Key Features Multi-Timeframe Candles (up to 5 TFs): Compact higher-timeframe candles render to the right of the last price on the current chart. Each TF group is scaled to the visible price range to preserve proportions. Choose which TFs (M1 → MN1) and how many candles per group.
FREE

Vyl Daily Sessions & Drawdown Tracker — Full Guide
Short Description (for the Market product card)
Vyl Daily Sessions & Drawdown Tracker is an all-in-one indicator for MetaTrader 5 that combines professional chart mapping with advanced trading-discipline control.
The tool automatically draws the key trading sessions and the previous day's liquidity levels, and adds a unique Discipline Dashboard that tracks your daily stats in real time and instantly warns you when you're approachin
FREE
ForexRubyEA is a fully automated trading system designed to simplify your trading. Using forexruby Custome Indicator.
It manages trades with smart logic, risk control, and built-in protection features — all without requiring constant monitoring. Download EA for this indicator: forexrubyaibot DM: https://www.mql5.com/en/users/forexruby/
Key Features Plug & Play – Easy setup, works out of the box. Automated Trading – Places, manages, and closes trades automatically. Risk Management –
FREE

Free version of https://www.mql5.com/en/market/product/44815 Simple indicator to calculate profit on fibonacci retracement levels with fixed lot size, or calculate lot size on fibonacci levels with fixed profit. Add to chart and move trend line to set the fibonacci retracement levels. Works similar as default fibonacci retracement line study in Metatrader. Inputs Fixed - select what value will be fix, lot or profit (available in full version, lot is set on free version) Fixed value - value tha
FREE

FJD Lot Calculator & Risk Manager Indicator MT5 FJD Lot Calculator & Risk Manager Indicator is an advanced, high-performance on-chart risk management tool built specifically for manual traders, prop firm challenge takers, and analytical traders in MetaTrader 5. Because it operates 100% as a Native Chart Indicator , it does NOT require AutoTrading / AlgoTrading to be enabled in MT5. It provides instant position size calculations and real-time account risk tracking directly on your chart canvas.
FREE
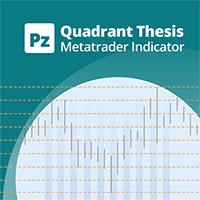
This is a general purpose indicator that displays colored lines at fixed and customizable price intervals, entered as parameters. It offers universal, constant, and familiar price ranges that allow quick and precise price analysis of a currency pair. With default parameters, this indicator implements The Quarters Theory , as described originally by Ilian Yotov . [ Installation Guide | Update Guide | Troubleshooting | FAQ | All Products | Get Help ] Easy to use No optimization needed Customiz
FREE

The indicator draws horizontal lines based on the RSI indicator's overbought and oversold levels. The closing prices of the bar are selected when it exits the overbought zone or when the RSI indicator first crosses the 50% line. For more information, you can enable the display of RSI values for the most recently closed bars in the upper left corner. It also displays information about whether the RSI indicators are in the overbought or oversold zone. All timeframes are available. Can be enable
FREE
This is a Price Projection for Current Candle from Time Frame M15 To Weekly, It's shows Market Trends Teji (Bullish) Or Mandi (Berries). It's Show Teji High & Low for Bullish Market and Mandi High & Low for Berries Market. We can Plan Our Trade in Well Advance for our Current Open Trade. It's Generate New Data for Every New Candle. You are requested to Please Test it with demo Ac before Use in Real Trade. Please Save it to your Mql\Indicator folder and attache to your chart. if any quay Please
FREE

Utility for show on charts the visual informations about:
- a vertical line at start of each bar of selected timeframe
- a vertical line at start of each day
- a vertical line at start of each week
- vertical lines at start / end of trading sessions selected
- bid / ask prices, spread, money value for each point (of 1 standard lot) and last tick time recived"
You can enable / disable each information and set the color for each line
FREE
Мультивалютный индикатор в отдельном окне отображает движение валютных пар в пунктах с расхождением от начала дня. Во время работы, динамически возможно включать и отключать различные пары прямо на графике. При первом запуске, возможно, потребуется продолжительное время, пока загрузиться история для основных валютных пар. Для валют CAD, CHF, JPY - график перевернут.
При повторном открытии, все настройки индикатора восстанавливаются автоматически.
FREE

Trade Sentiment or trade assistant is a MT5 Indicatior. That show buy or sell signal of different indicator to assist to take trades. That will help you to take right trades or to get confirmation for your trade. You don't need to have this indicators. Including indicators like RSI , STOCH , CCI. And the signals are Based on different Timeframes like 5M , 15H , 1H and 4H.
FREE
The Periodic ATR Indicator visually compares the ATR values of each bar to the average ATR values for the same time of day over previous days. By contrasting the current ATR value with the historical average, this tool allows traders to identify exceptionally strong or weak market movements. It also helps to contextualize each market movement within the broader framework of long-term market behavior. This versatile indicator is compatible with all timeframes, including higher ones such as 4-hou
FREE

Rojeryo ATR Scalper Widget is a lightweight MetaTrader 5 indicator that displays an ATR-based risk widget directly on the chart.
The indicator shows the current ATR value and calculates estimated Stop Loss and Take Profit distances using the selected ATR multiplier and Risk/Reward ratio.
It is designed for traders who want a simple on-chart risk reference without opening additional windows.
Main Features
- ATR value display - Configurable ATR timeframe - Configurable ATR period - Estimated
FREE

RXTL indicator Indicator is based on ATR to calculate trend and direction bias Works on all timeframes
Required for the other EA to work accordingly Download and ensure it is placed in the Indicator folder Do inbox me for any questions
installing instructions 1) Download RXTL indicator 2) If indicator does not appear, refresh indicator tab 3) Drag indicator to active chart 4) Use it alongside with other EA
FREE

Trader’s Cockpit is a simple non directional dashboard for MetaTrader 5 designed to give traders a quick, clear view of their trading environment directly on the chart. Creator: https://www.quant-atlas.com/ The indicator does not generate buy or sell signals, does not predict market direction, and does not perform any trading action. Its purpose is to make the trader’s daily workflow easier by centralizing useful account, symbol, spread, session, and broker condition information in one compact
FREE

RSI Scanner, Multiple Symbols and Timeframes, Graphical User Interface An indicator that scans multiple symbols added from the market watch and timeframes and displays result in a graphical panel. Features: Multi symbol Multi timeframe Alerts and Notifications Live Monitoring Sorting modes One click to change symbol and timeframe Inputs for RSI and scanner settings
FREE

SmartTrader Volatility Monitor shows two things that matter before you take a trade: is the spread reasonable right now, and is volatility behaving normally? What it shows Spread - current spread in points, color-coded Good / Elevated / Wide against thresholds you set Volatility - current ATR compared to its recent average, shown as a ratio (e.g. "1.8x") and a state: Low, Normal, or High Why "Low" volatility gets flagged too, not just "High" Most volatility tools only warn about high volatility.
FREE
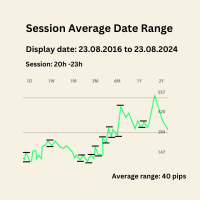
Session Average Date Range: Analyze and average the low - high of specific trading sessions within custom date ranges, offering insights into price movements and market behavior over selected periods. The "Session Average Date Range" tool is an advanced analytical utility designed to empower traders and analysts by allowing them to dissect and evaluate the high and low range of specific trading sessions within a user-defined date range. This tool provides a flexible and precise approach to analy
FREE

Maximize your trading performance with Dd-uP , a revolutionary indicator based on an Exponential Moving Average (EMA) smoothing. This indicator is represented by a distinct yellow line on your charts, making it easy to identify market trends and providing precise and reliable trading signals. Key Features: Advanced EMA Smoothing : Track market trends with an EMA smoothing that reacts quickly to price changes, offering precise and real-time analysis. Buy and Sell Signals : Receive clear signals w
FREE

LEGACY LANCELOT INDI — Adaptive Trend & Confluence Indicator
( MQL5 LEGACY CHANNEL ) A modern take on the classic SuperTrend. Instead of a fixed band, it adapts to market volatility and rates every signal by CONVICTION — combining trend strength and volume so you instantly see which moves are worth your attention. All wrapped in a clean on-chart HUD panel.
KEY FEATURES
Adaptive SuperTrend Engine
FREE

SPREAD TRAFFIC LIGHT — FREE ADAPTIVE SPREAD MONITOR FOR MT5
Turn raw spread data into a clear green, amber or red status before a manual entry.
MAIN FEATURES • Current spread in points • Rolling average and maximum spread • Current-to-average spread ratio • Adaptive green, amber and red classification • Configurable sample window and calibration samples • Optional absolute maximum-spread filter • Optional alert when status changes to red • Compact configurable panel for any MT5 symbol and time
FREE

Description The Institutional Cycle Filter (ICF) is a sophisticated trend-following tool that replaces standard moving averages with a "Signal Dot" system. It is designed to minimize lag while maintaining smoothness, making it highly effective for identifying trend reversals in volatile markets like Gold. How It Works (The Logic) Cosine Weighting: Unlike a Simple Moving Average (SMA) or Exponential Moving Average (EMA), this algorithm uses a Cosine function to calculate weights. This allows the
FREE

ATR Accelerator Indicator informs you about strong price movements based on the ATR Indicator. This Indicator works for all Timeframes and Symbols, the strength of movements can be configured.
Important: Get informed about new Products, join our MQL Channel: https://www.mql5.com/en/channels/etradro
Useage This Indicator works for all Timeframes and Symbols, the strength of movements can be configured. Features works on all timeframes and forex pairs or indices. Alert and Notify function inc
FREE

Gold Spread Traffic Light
Gold Spread Traffic Light is a real-time spread monitoring indicator developed for MetaTrader 5. It provides an immediate visual assessment of the current difference between Bid and Ask prices through a clear four-color panel.
The indicator is primarily configured for XAUUSD, where spread conditions can change considerably during news releases, market openings, rollover periods and phases of reduced liquidity. It can also be used with Forex pairs, silver, indices, oil
FREE
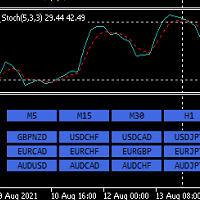
Hello,
This is an easy symbol change panel.
The free version only can change major pairs which are "AUDUSD, EURUSD, GBPUSD, USDCHF, USDCAD, USDJPY, NZDUSD"
The full version can add your symbols.
FULL version here:
https://www.mql5.com/en/market/product/71173?source=Site+Market+MT5+Indicator+New+Rating005#description
Also, can change the TimeFrame as well.
Symbols must be active on your Market Watch list.
Parameters:
ratio - change the size LineNumber - you can set that how many symbo
FREE

นี่คือคําอธิบาย Trend SAR Fusion PRO MT5 (เวอร์ชัน Stable) จากโค้ดที่คุณใช้
แนวคิดของอินดิเคเตอร์ อินดี้ตัวนี้ = รวม 3 อย่าง EMA10 (เร็ว) → จับโมเมนตัม EMA100 (ช้า) → จับเทรนหลัก SAR (จุดดอท) → ใช้เข้า/ออก สรุป: "ใช้ SAR เป็นตัวเข้า แต่ให้ EMA คัดกรองว่าเข้าเทรนจริงไหม" วิธีดูสัญญาณ (สำคัญสุด) เทรนขึ้น EMA10 > EMA100 จุด SAR อยู่ "ใต้ราคา" จะเห็น จุดเขียว
เข้า BUY ได้ เทรนลง EMA10 < EMA100 จุด SAR อยู่ "เหนือราคา" จะเห็น จุดแดง
เข้า SELL ได้ ช่วงเปลี่ยนเทรน ม
FREE

Course Crystal, yatırımcıların piyasadaki trendin yönünü belirlemelerine yardımcı olan bir göstergedir. Fiyat hareketlerini analiz etmek için benzersiz bir algoritma kullanır ve sonuçları grafik üzerinde renkli alanlar olarak görüntüler. Mavi bir alım fırsatını, kırmızı ise satış fırsatını gösterir. Kullanım talimatları - https://www.mql5.com/en/blogs/post/757800 Manuel ticaret sistemi:
Trend Belirleme: Course Crystal göstergesi, trendin genel yönünü belirlemek için mevcut ve geçmiş fiyat veri
FREE

LotPulse — Traded Lots Dashboard
LotPulse turns your account's trading volume into a clean, modern on-chart dashboard. It shows how many lots you traded today, this week, this month, last week and last month — all symbols combined, updated about once per second.
While the indicator is running, the price chart behind the panel is hidden completely, so you get a calm, distraction-free statistics screen. When you remove the indicator, your chart settings are restored automatically.
What it sh
FREE

Portfolio Риск Monitor-бу MetaTrader 5-да портфел таъсирини ва нақд пул қолдиғини кузатиш учун оддий ва кучли восита.
Индикатор кўрсатади: * Жами ҳисоб баланси * BUY позитция инвестиция миқдори (қимматли қоғозлар) * Қолган нақд пул (эркин капитал) * Портфелдан фойдаланиш фоизи * Нақд пул фоизи * Очиқ сотиб олиш позициялари сони * Ранг белгиси билан хавф ҳолати
Кўрсаткич биржа портфелларини фаол бошқарадиган ва ҳозирда қанча капитал қўйилганини ва қанча маблаг ъ мавжудлигини аниқ тушунишни ист
FREE
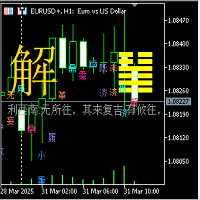
I Ching 64 Hexagram Change Indicator
1. Hexagram Indicator Description: (1) This 64 Hexagram Change Indicator is based on the Yin-Yang transformation thought of the "I Ching" philosophy in ancient Chinese culture, integrating the results of the long and short game of each candlestick K-line period of the financial trading K-line chart, using China's oldest prediction coding method, in the form of the I Ching 64 hexagrams, combining the Yin-Yang of each line of the hexagram with the Yin-Yang of
FREE

Lumen Chart Panel — a clean market panel for MetaTrader 5
Lumen Chart Panel puts your essential market context in one tidy panel on the chart: the countdown to the next candle, the current spread, the active trading session, server time, and the day's range with the live price inside it. No more crowding your chart with several small indicators or switching between terminal tabs to check the same things every day.
It is read-only — it shows information and nothing else. It places no trades, s
FREE

This indicator, the BB Donchian Hybrid (Volatility Breakout Analyzer), is a dual-layered technical analysis tool designed to identify high-probability trend entries by combining statistical volatility with price-action extremes.
By merging the "elasticity" of Bollinger Bands with the "structural" boundaries of Donchian Channels, it filters out the market noise that often leads to false breakouts.
Core Mechanics The indicator operates on two primary mathematical pillars:
The Bollinger Band "S
FREE
Unlike many other indicators including the moving average indicator, Pivot Point can be a leading indicator. In these systems, the price levels of the previous period are used to determine the critical points instead of relying on the current price performance. Such an approach provides a clear framework for traders to plan their trades in the best possible way.
You can use this method and its combination with the methods you want to build and use a powerful trading setup. MT4 version
Let us kno
FREE
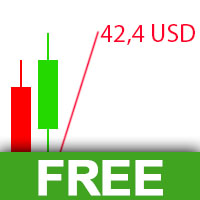
The Visual Result Calculator Indicator is a powerful tool designed to enhance your trading experience on the MetaTrader platform. This intuitive and user-friendly indicator allows you to visualize potential profits or losses on a trading chart, helping you make better-informed decisions and manage your trades with precision. The Indicator displays a dynamic line on the trading chart, representing the potential profit or loss of a trade based on the start and end of the line. Simply click and
FREE

This indicator is designed to automatically identify and highlight Mother Bars and their corresponding Child Bars on a price chart using rectangles. A Mother Bar is defined as a significant candlestick that encompasses smaller candlesticks (Child Bars) within its range, commonly used in Price Action trading strategies. The indicator draws rectangles around the Mother Bar and the subsequent Child Bars, providing a clear visual representation for traders to spot potential patterns. Key features: A
FREE
Este indicador de Média Móvel Personalizada permite aos traders visualizar a tendência do mercado utilizando diferentes métodos de cálculo e aplicação a várias séries de preços. O indicador é flexível e pode ser configurado para se adaptar a várias estratégias de trading, oferecendo suporte aos métodos de média móvel mais populares, incluindo Média Móvel Simples (SMA), Média Móvel Exponencial (EMA), Média Móvel Ponderada Linearmente (LWMA) e Média Móvel Suavizada (SMMA). Funcionalidades: Seleção
FREE

Gölge İndikatörü: Her Mumun Gizli Gücünü Ortaya Çıkarın! Yüzeysel fiyat hareketi analizinden bıktınız mı? Her zaman diliminde alıcı ve satıcı gücünü daha derinlemesine anlamak mı istiyorsunuz? Karşınızda Gölge İndikatörü – piyasanın gizli dinamiklerini görselleştirmek ve analiz etmek için vazgeçilmez aracınız! Bu güçlü indikatör, mum gövdelerinin boyutlarında yansıyan boğalar ve ayılar arasındaki görünmez savaşı, doğrudan grafiğinizde net ve bilgilendirici bir histograma dönüştürür. Mum gövdeler
FREE

"We have developed a highly accurate trading signal system applicable to all assets on the 15-minute (M15) timeframe. Calibrated against actual Gold price behavior, this system allows users to trade every candlestick effectively, regardless of market conditions—whether the market is trending, moving sideways, or reversing. The system features real-time arrows and color-coded indicators that signal immediate Buy or Sell entry points. This allows traders to use it as a reliable confirmation tool t
FREE

Smart Trend Suite Pro – Advanced Trend Indicator with Dashboard & Alerts Overview: Smart Trend Suite Pro is a powerful trend-detection indicator that offers traders a complete set of tools for accurate trend analysis and actionable insights. Designed for versatility and precision, Smart Trend Suite Pro adapts seamlessly to multiple timeframes and market conditions, making it suitable for various trading styles, including scalping and swing trading. Key Features: Real-Time Trend Detection: Identi
FREE

VXN Göstergesi Tanıtımı
Darwinex Zero'da %25 İndirim Kodu: DWZ2328770MGM Nasdaq-100 Endeksinin dalgalı sularında gezinmek için nihai ortağınız. Hassasiyet ve güvenilirlik talep eden yatırımcılar için tasarlanan VXN Göstergesi, piyasa hissiyatı ve potansiyel fiyat dalgalanmaları hakkında gerçek zamanlı bilgiler sunar. VXN Göstergesi ile şunları yapabilirsiniz: Dalgalanmayı Tahmin Edin : Piyasa hareketlerini doğru bir şekilde tahmin ederek rekabet avantajı kazanın. Stratejilerinizi Optimize Edin
FREE
MetaTrader Mağazasının neden alım-satım stratejileri ve teknik göstergeler satmak için en iyi platform olduğunu biliyor musunuz? Reklam veya yazılım korumasına gerek yok, ödeme sorunları yok. Her şey MetaTrader Mağazasında sağlanmaktadır.

Alım-satım fırsatlarını kaçırıyorsunuz:
- Ücretsiz alım-satım uygulamaları
- İşlem kopyalama için 8.000'den fazla sinyal
- Finansal piyasaları keşfetmek için ekonomik haberler
Kayıt
Giriş yap
Web sitesi politikasını ve kullanım şartlarını kabul edersiniz
Hesabınız yoksa, lütfen kaydolun