Visual Order Book

1

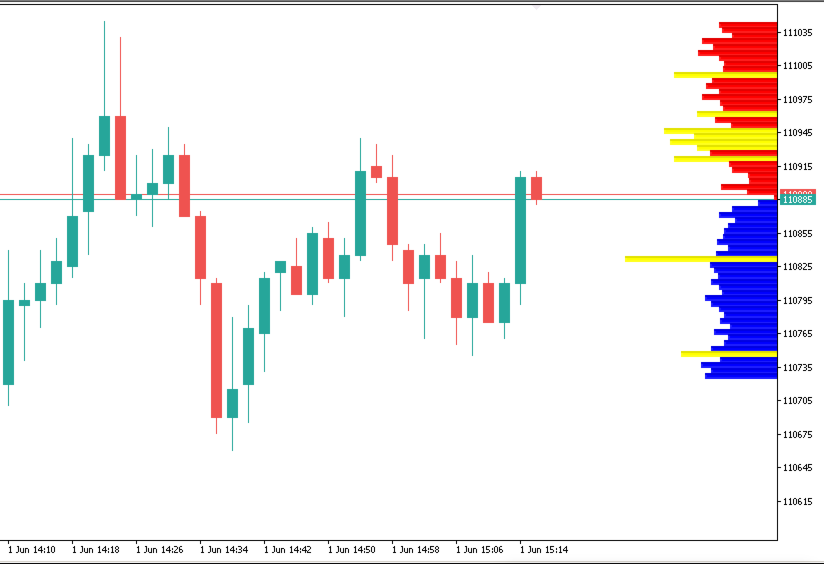
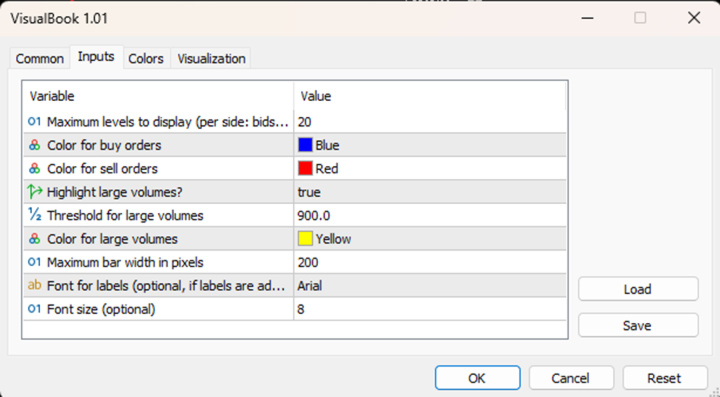
Bu gösterge ile piyasaya dair güçlü içgörüler elde edin; Nelogica'nın Profit Visual Book'undan ilham alarak grafikte görsel bir emir defteri sunar. Alış hacimlerini (mavi) ve satış hacimlerini (kırmızı) temsil eden yatay çubuklar gösterir, büyük hacimler sarı ile vurgulanır, böylece yüksek likidite bölgeleri kolayca tespit edilir. Fiyat, emirlerin en yoğun olduğu bölgelere doğru hareket etme eğilimindedir, bu da destek ve direnç seviyelerini belirlemek için vazgeçilmez bir araçtır. Tamamen özelleştirilebilir ayarlar her türlü işlem stiline uyum sağlar ve gerçek zamanlı güncellemeler piyasa dinamiklerini takip etmenizi sağlar. MetaTrader 5'te forex, hisse senetleri ve diğer piyasalar için idealdir. Aracının piyasa derinliği (emir defteri) verilerini sağlaması gerekir. Hemen indirin ve net, uygulanabilir analizlerle işlem kararlarınızı güçlendirin!


Önerilen ürünler
FT ADX Color Candles
FELIPE MISAEL MORAES KRUGER
5 (7)
Trading can be quite tiring when you need to look at several things at the same time. Format of candles, supports, resistances, schedules, news and indicators. This tool aims to facilitate the analysis of the ADX indicator. It colors the candles based on the levels of the indicator and the DI lines. The period, the limit of the indicator and the colors of the candles are customizable. You can also place a visual aid on the lower right side of the graph to view the values of ADX, DI + and DI-
FREE
Daily HiLo
Nicanor Jr Cagape Layco
DailyHiLo Indicator Master the daily range like a pro. This indicator automatically plots the previous day’s high and low levels —a core element in the (Beat The Market Maker) trading approach—directly on your chart. These levels act as natural boundaries for intraday price action, helping traders identify potential reversal zones, breakout points, and liquidity targets. Key Features Accurate plotting of yesterday’s high and low for any symbol and timeframe. Works seamlessly with BTMM-inspired
FREE
TilsonT3
Jonathan Pereira
5 (1)
Tillson's T3 moving average was introduced to the world of technical analysis in the article ''A Better Moving Average'', published in the American magazine Technical Analysis of Stock Commodities. Developed by Tim Tillson, analysts and traders of futures markets soon became fascinated with this technique that smoothes the price series while decreasing the lag (lag) typical of trend-following systems.
FREE
Smart Flow Bands
Mohamad Sami Taleb
How the Sell Signal Works 1. Bollinger Band condition The current candle must close at or above the Upper Bollinger Band . This signals potential overbought conditions. 2. OBV confirmation (On Balance Volume) OBV must be falling → OBV_now < OBV_prev . Stronger confirmation: OBV decreasing for 2–3 consecutive bars. This shows that buying pressure is weakening . 3. ATR filter (Average True Range) Current ATR must be below its moving average (e.g., ATR_now < ATR_SMA(14) * 1.2 ). Purpose: avoid ente
FREE
Donchian Pro
Paulo Henrique Faquineli Garcia
5 (3)
The Donchian Channel Channels are among the most popular tools of technical analysis, as they visually convey to the analyst the limits within which most price movement tends to occur. Channel users know that valuable information can be obtained at any time, whether prices are in the central region of a band or close to one of the border lines. One of the best known techniques to explore these concepts is Bollinger Bands. However, John Bollinger was not the only one to research the application
FREE
Market Momentum
Flavio Javier Jarabeck
4.43 (7)
The Market Momentum indicator is based on the Volume Zone Oscillator (VZO), presented by Waleed Aly Khalil in the 2009 edition of the International Federation of Technical Analysts journal, and presents a fresh view of this market valuable data that is oftenly misunderstood and neglected: VOLUME. With this new approach of "seeing" Volume data, traders can infer more properly market behavior and increase their odds in a winning trade. "The VZO is a leading volume oscillator; its basic usefulness
FREE
Bollinger colorido
Sergio Domingues
5 (1)
Funciona como bandas de bollinger normais. Criado por Joe Ross, é um setup de maior risco por ser contra-tendência. Pode ser usado para Day Trade, Swing Trade e Position. Para identificar, é necessário inserir no gráfico as Bandas de Bollinger, com uma Média Móvel Simples de 20 períodos e largura (desvio) 2. Verifica-se um fechamento de determinado candle abaixo da banda inferior de Bollinger. Se o próximo candle fechar dentro das Bandas, marca-se a máxima dele. O rompimento dessa máxima será o
FREE
Qstick is a way to objectively quantify candlestick analysis and improve the interpretation of candlestick patterns. Qstick was developed by Tushar Chande and published in his book " The New Technical Trader - Boost Your Profit by Plugging Into the Latest Indicators (1994) ". Qstick is built based on a moving average of the difference between the Open and Close prices. The basis of the idea is that the Opening and Closing prices are the heart of candlestick analysis. We strongly recommend the re
FREE
Swing BOS Structure is a market structure indicator for MetaTrader 5. The indicator automatically detects: • Swing High (SH) • Swing Low (SL) • Break of Structure (BOS) • Change of Character (CHoCH) Swings are confirmed only after a defined number of candles, ensuring no repainting. BOS signals indicate trend continuation. CHoCH signals indicate a potential change in market structure and may appear less frequently depending on market conditions and timeframe. The indicator is lightweight, fa
FREE
Candle Zones
Flavio Javier Jarabeck
You probably heard about Candlesticks behaviors, which in most of the times could denote and trace Volume behaviors even if you are not watching Volume itself... Well, this indicator will do this. Naked traders love to rely solely on candlesticks patterns and with Candle Zones you can trap special patterns and DRAW THEM on your chart. As simple as that. There are several filters you can tweak in order to achieve the analysis you want. Just give it a try. After several months of testing, we think
FREE
Wave Box Market Frenquency
Jean Jacques Huve Ribeiro
4.75 (4)
Totally linked to the result of a movement and the duration he had. Its height records how many ticks the asset walked during a given movement, its width shows us the duration that movement had. Its configuration must be in line with the Weis Wave Indicator configuration to observe the movement force and can indicate a possible accumulation or distribution of the movement;
FREE
VolumesWithMedia
Jonathan Pereira
5 (1)
Volume is a widely used indicator in technical analysis, however there is a variation that is even more useful than Volume alone: the Moving Average of Volume. It is nothing more than a moving average applied to the popular Volume indicator. As the name says, Volume + MA serves to display the transacted volume (purchases and sales executed) of a certain financial asset at a given point of time together with the moving average of that same volume over time. What is it for? With the Volume + M
FREE
(Special New Year promotion - free price!) The indicator displays the actual 'Scale in points per bar' (identical to the manual setting in the Terminal, see screenshot) in the upper right corner of the chart. The displayed value changes INSTANTLY whenever the chart scale is changed! (This is very convenient when planning screenshots). In Settings: Change language (Russian/English), font size of the displayed text, text label offset coefficient from the graph corner, equally in X and Y directi
FREE
Stackable VWAP
Flavio Javier Jarabeck
3.5 (4)
Volume Weighted Average Price (VWAP) is a trading benchmark commonly used by Big Players that gives the average price a Symbol has traded throughout the day. It is based on both Volume and price. Additionally we put in this indicator the MVWAP (Moving Volume Weighted Average Price). For those who do not know the usage and the importance od this indicator I recommend a great article about this subject at Investopedia ( https://www.investopedia.com/articles/trading/11/trading-with-vwap-mvwap.asp
FREE
Ratio X Trend Watcher – Advanced Trendline Breakout Indicator Ratio X Trend Watcher is a professional indicator designed to analyze price action, draw trendlines on the current chart timeframe, and detect meaningful breakouts. Built for traders who rely on support and resistance levels, this tool offers clear visual cues and optional automated actions to help improve your trading decisions. Developed by Mauricio Vellasquez, it is part of the Ratio X suite of trading systems. Key Features Real‑t
FREE
Strong movement levels
Nikolay Mitrofanov
5 (2)
Looks for strong price movements and draws levels upon their completion. You determine the strength of the movement yourself by specifying in the settings the number of points and the number of candles of the same color in a row in one direction. There are 2 types of building in the settings: extrenum - high / low close - close price You can also adjust the number of displayed levels and the number of candles for calculations. By default, the settings indicate 5 levels for 360 candles. That
FREE
Equidistant bands indicator with calculated moving average, allows you to configure the band size and can be used freely as an entry / exit indicator. Buffer 0 = price, buffer 1 = upper band, buffer 2 = lower band. you can also configure the periods of moving averages used in the calculations and also the shift to previous bars in addition to the price that can CLOSE (default) or OPEN. Excellent for fast daily moving pairs and frequent returns.
FREE
Rejection Zones
Paulo Henrique Faquineli Garcia
Este poderoso indicador analisa o gráfico e mostra zonas de Rejeição de Preços! Isto é, locais onde o preço foi, mas não foi aceito pelo mercado! A visualização desta zona de Rejeição, facilita o entendimento do trader na tomada de decisões de onde operar e como operar! O indicador é composto por 4 linhas, sendo classificadas em 2 grupos: Linhas Vermelha e Amarela: Denotam os extremos onde o preço conseguiu chegar, mas não foi aceito! Linhas Laranja e Azul: A partir delas, denotam o Início da z
FREE
TREND VISION DAILY nedir TREND VISION DAILY, piyasanın yönünü net, yapılandırılmış ve profesyonel bir şekilde analiz etmek için tasarlanmış gelişmiş çok zaman dilimli (multi-timeframe) trend yön filtresidir . Gösterge, fiyat davranışını birden fazla trend ve momentum bileşeni üzerinden sentezleyerek yatırımcıya piyasa bağlamı hakkında hızlı ve güvenilir bir bakış sunar. Bu bir doğrudan giriş göstergesi değildir. Klasik bir osilatör değildir. TREND VISION DAILY, piyasanın gerçekten yönsel b
FREE
Genel Açıklama Bu gösterge, klasik Donchian Kanalı ’nın geliştirilmiş bir versiyonudur ve gerçek işlem için pratik işlevlerle zenginleştirilmiştir. Standart üç çizgiye (üst, alt ve orta çizgi) ek olarak sistem breakout (fiyat kırılımı) noktalarını tespit eder ve bunları grafikte oklarla görsel olarak gösterir. Ayrıca grafiği sadeleştirmek için mevcut trend yönünün tersindeki çizgi yalnızca görüntülenir. Gösterge şunları içerir: Görsel sinyaller : Kırılım sırasında renkli oklar Otomatik bildiriml
FREE
Ideal for scalpers, day traders and swing trades. Automatically identifies key support and resistance levels based on historical price data. It displays real-time trading zones and a precise countdown timer for each candle, helping traders make faster and more confident decisions. Fully customizable for multiple timeframes and instruments. The indicator analyzes historical price data to draw horizontal levels that represent key trading areas. It also displays, in real time, the current zone whe
FREE
Quarter EMA
Jithin Sajan Sajan
5 (2)
Kindly rate and comment about the product for upgradation & Support The 5 EMA is plotted in green color ( Lime ). The 14 EMA is plotted in red color ( Red ). The 20 EMA is plotted in blue color ( Blue ). The 200 EMA is plotted in yellow color ( Yellow ). The Quarter EMA that provided calculates and plots four Exponential Moving Averages (EMAs) on the chart using different periods: 5, 14, 20, and 200. Each EMA is represented by a different color on the chart. Here's a description of each EMA:
FREE
Quintet EMA
Jithin Sajan Sajan
Kindly rate and comment about the product for upgradation & Support The   5 EMA   is plotted in   green   color ( Lime ). The  14 EMA  is plotted in  red  color ( Red ). The   20 EMA   is plotted in   blue   color ( Blue ). The  200 EMA  is plotted in  black  color ( Black ). The   200 EMA   is plotted in   yellow   color ( Yellow ). The Quarter EMA that provided calculates and plots four Exponential Moving Averages (EMAs) on the chart using different periods: 5, 14, 20, and 200. Each EMA is
FREE
RSI abcd
Francisco Gomes Da Silva
3 (1)
RSI ABCD Desen Bulucu: Teknik Strateji 1. Gösterge Nasıl Çalışır? Klasik RSI ile otomatik ABCD harmonik desen tespitini birleştirir. Temel Bileşenler Standart RSI (ayarlanabilir periyot) Tepe ve dip işaretleri (oklar) ABCD desenleri (yeşil/kırmızı çizgiler) Aşırı alım (70) ve aşırı satım (30) filtreleri 2. MT5 Kurulumu period = 14 ; // RSI periyodu size = 4 ; // Maksimum desen boyutu OverBought = 70 ; // Aşırı alım seviyesi OverSold = 30 ; // Aşırı satım seviyesi Filter = USE_FILTER_ YES ; // On
FREE
Volume Profile Density V2.40 Fiyat seviyelerine göre işlem hacmini gösterir ve kurumsal ilgiyi çeken bölgeleri ortaya çıkarır. Klasik hacim göstergelerinden farklı olarak, hacmin gerçekte nerede yoğunlaştığını gösterir. Temel ilkeler: Yatay çubuklar = her fiyat seviyesindeki işlem hacmi Daha uzun çubuk → daha yüksek hacim Kırmızı bölgeler = güçlü destek / direnç alanları Ana kullanımlar: Gerçek destek ve direnç bölgelerini belirleme POC (Point of Control) tespiti Değer Alanı (toplam hacmin %70’i
FREE
Spike Catch Pro
Amani Fungo
4.14 (7)
Spike Catch Pro 22:03 release updates Advanced engine for searching trade entries in all Boom and Crash pairs (300,500 and 1000) Programmed strategies improvements Mx_Spikes (to combine Mxd,Mxc and Mxe), Tx_Spikes,   RegularSpikes,   Litho_System,   Dx_System,   Md_System,   MaCross,   Omx_Entry(OP),  Atx1_Spikes(OP),   Oxc_Retracement (AT),M_PullBack(AT) we have added an arrow on strategy identification, this will help also in the visual manual backtesting of the included strategies and see ho
FREE
Gelişmiş Ekonomik Takvim Göstergesi Bu gösterge, seçilen döviz çifti veya enstrüman için tüm yaklaşan ekonomik olayları doğrudan grafikte gösterir. Yüksek volatilite dönemlerini önceden tahmin etmenizi sağlar ve işlem stratejilerinizi daha hassas şekilde planlamanıza yardımcı olur. Başlıca Özellikler Gelecek olayların 5 gün öncesine kadar görüntülenmesi (özelleştirilebilir). Haber etkisine göre filtreleme (yüksek, orta, düşük). Hızlı tanımlama için dikey olay çizgileri ve numaralı işaretler göst
FREE
Coral Indi
Dinh Duong Luong
Coral trend is   a trend-following indicator that is widely popular among FOREX traders . It is usually used as a confluence with other indicators. It uses combinations of moving averages with complex smoothing formulas! It has two configurable parameters: Coefficient   - smoothing ratio (*) Applied price Calculation: Coral = (-0.064) * B6 + 0.672 * B5 - 2.352 * B4 + 2.744 * B3
FREE
MIDAS Super VWAP
Flavio Javier Jarabeck
4.4 (10)
Imagine VWAP, MVWAP and MIDAS in one place... Well, you found it! Now you can track the movement of Big Players in various ways, as they in general pursue the benchmarks related to this measuring, gauging if they had good execution or poor execution on their orders. Traders and analysts use the VWAP to eliminate the noise that occurs throughout the day, so they can measure what prices buyers and sellers are really trading. VWAP gives traders insight into how a stock trades for that day and deter
FREE
Cybertrade Keltner Channels - MT5 Created by Chester Keltner, this is a volatility indicator used by technical analysis. It is possible to follow the trend of financial asset prices and generate support and resistance patterns. In addition, envelopes are a way of tracking volatility in order to identify opportunities to buy and sell these assets. It works on periods longer than the period visible on the chart. All values ​​are available in the form of buffers to simplify possible automations.
FREE
Bu ürünün alıcıları ayrıca şunları da satın alıyor
Bu indikatörü satın alırsanız, Profesyonel Trade Manager’ımı  + EA ÜCRETSİZ olarak alacaksınız. Öncelikle, bu Ticaret Sistemi'nin Non-Repainting, Non-Redrawing ve Non-Lagging Göstergesi olduğunu vurgulamak önemlidir, bu da hem manuel hem de robot ticareti için ideal hale getirir. Online kurs, kılavuz ve ön ayarları indir. "Smart Trend Trading System MT5", yeni ve deneyimli tüccarlar için özelleştirilmiş kapsamlı bir ticaret çözümüdür. 10'dan fazla premium göstergeyi birleştiriyor ve 7'den fazla
ARIPoint
Temirlan Kdyrkhan
ARIPoint is a powerful trading companion designed to generate high-probability entry signals with dynamic TP/SL/DP levels based on volatility. Built-in performance tracking shows win/loss stats, PP1/PP2 hits, and success rates all updated live. Key Features: Buy/Sell signals with adaptive volatility bands Real-time TP/SL/DP levels based on ATR Built-in MA Filter with optional ATR/StdDev volatility Performance stats panel (Success, Profit/Loss, PP1/PP2) Alerts via popup, sound, push, or email Cu
SuperScalp Pro
Van Minh Nguyen
5 (2)
SuperScalp Pro – Gelişmiş Çoklu Filtreli Scalping Gösterge Sistemi SuperScalp Pro, klasik Supertrend ile çok sayıda akıllı onay filtresini birleştiren gelişmiş bir scalping gösterge sistemidir. Gösterge M1’den H4’e kadar tüm zaman dilimlerinde verimli çalışır ve özellikle XAUUSD, BTCUSD ve ana Forex pariteleri için uygundur. Bağımsız bir sistem olarak kullanılabilir veya mevcut ticaret stratejilerine esnek şekilde entegre edilebilir. Gösterge, hız ve yavaş EMA’lar, trend belirleyen üç EMA, EMA e
Entry In The Zone and SMC Multi Timeframe is a real-time market analysis tool developed based on Smart Money Concepts (SMC). It is designed to analyze market structure, price direction, reversal points, and key zones across multiple timeframes in a systematic way. The system displays Points of Interest (POI) and real-time No Repaint signals, with instant alerts when price reaches key zones or when signals occur within those zones. It functions as both an Indicator and a Signal System (2-in-1), c
Divergence Bomber
Ihor Otkydach
4.89 (82)
Bu göstergeyi satın alan herkese aşağıdaki ekstra içerikler ücretsiz olarak sunulmaktadır: Her işlemi otomatik olarak yöneten, Stop Loss ve Take Profit seviyelerini ayarlayan ve işlemleri strateji kurallarına göre kapatan özel yardımcı araç: "Bomber Utility" Göstergenin farklı varlıklar üzerinde kullanılmasına yönelik ayar dosyaları (set dosyaları) Bomber Utility için 3 farklı modda kullanım sunan ayar dosyaları: "Minimum Risk", "Dengeli Risk" ve "Bekle-Gör Stratejisi" Bu ticaret stratejisini hı
Azimuth Pro
Ottaviano De Cicco
5 (3)
LAUNCH PROMO Azimuth Pro price is initially set at 299$ for the first 100 buyers. Final price will be 499$ . THE DIFFERENCE BETWEEN RETAIL AND INSTITUTIONAL ENTRIES ISN'T THE INDICATOR — IT'S THE LOCATION. Most traders enter at arbitrary price levels, chasing momentum or reacting to lagging signals. Institutions wait for price to reach structured levels where supply and demand actually shift. Azimuth Pro maps these levels automatically: swing-anchored VWAP, multi-timeframe structure lines, an
Game Changer, metatrader'ınızı güçlü bir trend analiz aracına dönüştürmek için herhangi bir finansal enstrümanda kullanılmak üzere tasarlanmış devrim niteliğinde bir trend göstergesidir. Gösterge, yeniden çizim yapmaz ve gecikmez. Herhangi bir zaman diliminde çalışır ve trend tanımlamasına yardımcı olur, olası geri dönüşleri işaret eder, takip eden bir durdurma mekanizması görevi görür ve anında piyasa tepkileri için gerçek zamanlı uyarılar sağlar. İster deneyimli, ister profesyonel, ister avant
Power Candles – Tüm Piyasalar İçin Güce Dayalı Giriş Sinyalleri Power Candles , Stein Investments’ın kanıtlanmış güç analizini doğrudan fiyat grafiğinize taşır. Sadece fiyata tepki vermek yerine, her mum gerçek piyasa gücüne göre renklendirilir. Bu sayede momentum birikimleri, güç hızlanmaları ve net trend geçişleri anında görülebilir. Tüm Piyasalar İçin Tek Mantık Power Candles tüm işlem sembollerinde otomatik olarak çalışır. Gösterge, mevcut sembolün Forex mi yoksa Forex dışı bir piyasa mı old
FX Power MT5 NG
Daniel Stein
5 (31)
FX Power: Daha Akıllı Ticaret Kararları için Para Birimlerinin Gücünü Analiz Edin Genel Bakış FX Power , her piyasa koşulunda başlıca para birimlerinin ve altının gerçek gücünü anlamak için vazgeçilmez bir araçtır. Güçlü para birimlerini alıp zayıf olanları satarak, FX Power ticaret kararlarınızı basitleştirir ve yüksek olasılıklı fırsatları ortaya çıkarır. İster trendlere sadık kalın ister Delta'nın aşırı değerlerini kullanarak tersine dönüşleri öngörün, bu araç ticaret tarzınıza mükemmel bir
TrendMaestro5
Stefano Frisetti
note: this indicator is for METATRADER4, if you want the version for METATRADER5 this is the link:  https://www.mql5.com/it/market/product/108106 TRENDMAESTRO ver 2.5 TRENDMAESTRO recognizes a new TREND from the start, he never makes mistakes. The certainty of identifying a new TREND is priceless. DESCRIPTION TRENDMAESTRO identifies a new TREND in the bud, this indicator examines the volatility, volumes and momentum to identify the moment in which there is an explosion of one or more of these da
Atomic Analyst MT5
Issam Kassas
4.07 (28)
Öncelikle belirtmek gerekir ki bu Ticaret Göstergesi Yeniden Çizim Yapmaz, Gecikmez ve Gecikme Göstermez, bu da hem manuel hem de robot ticareti için ideal hale getirir. Kullanıcı kılavuzu: ayarlar, girişler ve strateji. Atom Analisti, Piyasada Daha İyi Bir Avantaj Bulmak İçin Fiyatın Gücünü ve Momentumunu Kullanan PA Fiyat Hareketi Göstergesidir. Gürültüleri ve Yanlış Sinyalleri Kaldırmaya ve Ticaret Potansiyelini Artırmaya Yardımcı Olan Gelişmiş Filtrelerle Donatılmıştır. Birden fazla katmanl
Grabber System MT5
Ihor Otkydach
4.82 (22)
Size mükemmel bir teknik gösterge olan Grabber’ı tanıtıyorum. Bu araç, kullanıma hazır bir “her şey dahil” işlem stratejisi olarak çalışır. Tek bir yazılım kodu içinde güçlü piyasa teknik analiz araçları, işlem sinyalleri (oklar), uyarı işlevleri ve push bildirimleri entegre edilmiştir. Bu göstergeyi satın alan herkes aşağıdaki hediyeleri ücretsiz olarak alır: Açık emirleri otomatik yönetmek için Grabber Yardımcı Aracı Kurulum, yapılandırma ve nasıl işlem yapılacağını adım adım anlatan video kıl
Top indicator for MT5   providing accurate signals to enter a trade without repainting! It can be applied to any financial assets:   forex, cryptocurrencies, metals, stocks, indices .  Watch  the video  (6:22) with an example of processing only one signal that paid off the indicator! MT4 version is here It will provide pretty accurate trading signals and tell you when it's best to open a trade and close it. Most traders improve their trading results during the first trading week with the help of
Trend Screener Pro MT5
STE S.S.COMPANY
4.84 (100)
Trend Göstergesi, Trend Alım Satım ve Filtreleme için Çığır Açan Benzersiz Çözüm, Tüm Önemli Trend Özellikleriyle Tek Bir Araç İçinde Yerleştirildi! Forex, emtialar, kripto para birimleri, endeksler ve hisse senetleri gibi tüm sembollerde/araçlarda kullanılabilen %100 yeniden boyamayan çoklu zaman çerçevesi ve Çoklu para birimi göstergesidir. Trend Screener, grafikte noktalarla ok trend sinyalleri sağlayan etkili bir trend trend göstergesidir. Trend analizörü göstergesinde bulunan özellikler: 1.
Göstergemiz, piyasada ilgi gösterilen bölgeleri vurgular ve ardından emir birikim bölgelerini gösterir. Büyük ölçekli bir emir defteri (order book) gibi çalışır. Bu, büyük sermaye için geliştirilmiş bir göstergedir. Performansı olağanüstüdür. Piyasada ne tür bir ilgi olursa olsun, onu görürsünüz . (Bu, tamamen yeniden yazılmış ve otomatikleştirilmiş bir versiyondur – artık manuel analiz gerekmez.) İşlem Hızı (Transaction Speed) , piyasada büyük emirlerin nerede ve ne zaman biriktiğini gösteren v
" Dynamic Scalper System MT5 " göstergesi, trend dalgaları içinde işlem yapmak için scalping yöntemi için tasarlanmıştır. Başlıca döviz çiftleri ve altın üzerinde test edilmiştir, diğer işlem araçlarıyla uyumluluğu mümkündür. Ek fiyat hareketi desteğiyle trend boyunca pozisyonların kısa vadeli açılması için sinyaller sağlar. Göstergenin prensibi. Büyük oklar trend yönünü belirler. Küçük oklar şeklinde scalping için sinyaller üreten bir algoritma trend dalgaları içinde çalışır. Kırmızı oklar yü
Smart Stop Indicator – Stop-loss düzeylerini doğrudan grafikte akıllı ve hassas şekilde belirleyin Genel Bakış Smart Stop Indicator, stop-loss seviyesini tahmin ederek veya sezgilere güvenerek değil, net ve sistematik bir şekilde belirlemek isteyen traderlar için özel olarak geliştirilmiştir. Bu araç, klasik price-action mantığını (yükselen tepeler, düşen dipler) modern breakout algılama ile birleştirerek bir sonraki mantıklı stop seviyesini belirler. Trendlerde, yatay piyasalarda veya hızlı k
RelicusRoad Pro: Kantitatif Piyasa İşletim Sistemi ÖMÜR BOYU ERİŞİMDE %70 İNDİRİM (SINIRLI SÜRE) - 2.000+ TRADER'A KATILIN Neden çoğu trader "mükemmel" indikatörlere rağmen başarısız olur? Çünkü tekil kavramları boşlukta trade ederler. Bağlamı olmayan bir sinyal kumardır. Sürekli kazanmak için KONFLÜANS (UYUM) gerekir. RelicusRoad Pro basit bir ok indikatörü değildir. Tam bir Kantitatif Piyasa Ekosistemi dir. Tescilli volatilite modellemesini kullanarak fiyatın ilerlediği "Adil Değer Yolu"nu har
Super Signal – Skyblade Edition Profesyonel No-Repaint / Gecikmesiz Trend Sinyal Sistemi, Olağanüstü Kazanma Oranı ile | MT4 / MT5 için 1 dakika, 5 dakika ve 15 dakika gibi daha düşük zaman dilimlerinde en iyi şekilde çalışır. Temel Özellikler: Super Signal – Skyblade Edition, özellikle trend bazlı işlemler için geliştirilmiş akıllı bir sinyal sistemidir. Yalnızca güçlü, yönlü ve gerçek momentum destekli piyasa hareketlerini tespit etmek amacıyla çok katmanlı bir filtreleme yapısı kullanır.
Support And Resistance Screener, MetaTrader için tek bir gösterge içinde birden fazla araç sağlayan tek bir Düzey göstergesindedir. Kullanılabilir araçlar şunlardır: 1. Piyasa Yapısı Eleme Aracı. 2. Geri Çekilme Bölgesi Boğa. 3. Geri Çekilme Bölgesi Ayı. 4. Günlük Pivot Noktaları 5. haftalık Pivot Noktaları 6. aylık Pivot Puanları 7. Harmonik Modele ve hacme dayalı Güçlü Destek ve Direnç. 8. Banka Seviyesi Bölgeleri. SINIRLI SÜRELİ TEKLİF : YG Destek ve Direnç Göstergesi sadece 50 $ ve ömür boyu
TPSproTREND PrO MT5
Roman Podpora
4.74 (19)
TPSproTrend PRO, piyasanın yön değiştirdiği anı belirler ve hareketin başlangıcında bir giriş noktası oluşturur. Piyasaya, fiyat hareketi henüz yeni başladığı anda girersiniz, hareket gerçekleştikten sonra değil.   Gösterge       Sinyalleri yeniden çizmez ve giriş noktalarını, Zarar Durdurma ve Kar Al seviyelerini otomatik olarak göstererek alım satımı net, görsel ve yapılandırılmış hale getirir. RUSÇA TALİMATLAR   -   MT4 SÜRÜMÜ Başlıca avantajlar Yeniden çizim yapılmadan sinyaller.   Tüm sinya
IX Power MT5
Daniel Stein
4.92 (12)
IX Power: Endeksler, Emtialar, Kripto Paralar ve Forex Piyasaları için İçgörüler Genel Bakış IX Power , endeksler, emtialar, kripto paralar ve forex sembollerinin gücünü analiz etmek için tasarlanmış çok yönlü bir araçtır. FX Power , tüm kullanılabilir döviz çiftlerinin verilerini kullanarak döviz çiftleri için maksimum doğruluk sağlarken, IX Power yalnızca temel sembolün piyasa verilerine odaklanır. Bu, IX Power 'ı forex dışındaki piyasalar için ideal ve daha basit forex analizleri için güven
FX Levels MT5
Daniel Stein
5 (13)
FX Levels: Tüm Piyasalar İçin Son Derece Hassas Destek ve Direnç Hızlı Bakış Döviz kurları, endeksler, hisseler veya emtialar gibi herhangi bir piyasada güvenilir destek ve direnç seviyeleri belirlemek mi istiyorsunuz? FX Levels geleneksel “Lighthouse” yöntemini ileri düzey bir dinamik yaklaşımla birleştirerek neredeyse evrensel bir doğruluk sağlar. Gerçek broker deneyimimize ve otomatik günlük güncellemeler ile gerçek zamanlı güncellemelerin birleşimine dayalı olarak, FX Levels size dönüş nok
The AX Forex Indicator MT5 is a sophisticated trading tool designed to provide traders with a comprehensive analysis of multiple currency pairs. This   powerful indicator   simplifies the complex nature of the forex market, making it accessible for both novice and experienced traders. AX Forex Indicator uses   advanced algorithms   to detect trends, patterns and is an essential tool for traders aiming to enhance their forex trading performance. With its robust features, ease of use, and reliabl
Dark Support Resistance  is an Indicator for intraday trading. This Indicator is programmed to identify  Support and Resistance Lines , providing a high level of accuracy and reliability. Key benefits Easily visible lines Only the most important levels will be displayed Automated adjustment for each timeframe and instrument Easy to use even for beginners Never repaints, never backpaints, Not Lag 100% compatible with Expert Advisor development All types of alerts available: Pop-up, Email, Push
Weis Wave with Alert MT5
Trade The Volume Waves Single Member P.C.
4.94 (17)
Rental/Lifetime Package Options and Privileges  Rent Monthly Six Months   Yearly/Lifetime Weis Wave with Speed with Alert+Speed Index x x x Manual  x x x Quick Set up Video x x x Blog x x x Lifetime Updates x x x Setup and Training Material x x Discord Access Channel "The SI traders"          x Rectangle Break Alert Tool      x How to trade with it:    http://www.tradethevolumewaves.com   ** If you purchase please contact me to setup your  : Training Room and  complete manual access.  Wei
Öncelikle, bu Ticaret Aracının Non-Repainting, Non-Redrawing ve Non-Lagging Gösterge olduğunu vurgulamakta fayda var, bu da onu profesyonel ticaret için ideal hale getiriyor. Çevrimiçi kurs, kullanıcı kılavuzu ve demo. Akıllı Fiyat Hareketi Kavramları Göstergesi, hem yeni hem de deneyimli tüccarlar için çok güçlü bir araçtır. İleri ticaret fikirlerini, Inner Circle Trader Analizi ve Smart Money Concepts Ticaret Stratejileri gibi 20'den fazla kullanışlı göstergeyi bir araya getirerek bir araya
Gold Entry Sniper
Tahir Mehmood
5 (3)
Gold Entry Sniper – Altın Scalping & Swing Trading için Profesyonel Çoklu Zaman Çerçeveli ATR Paneli Gold Entry Sniper , XAUUSD ve diğer enstrümanlar için doğru al/sat sinyalleri veren, ATR Trailing Stop mantığı ve çoklu zaman çerçevesi analizi ile geliştirilmiş gelişmiş bir MetaTrader 5 göstergesidir. Temel Özellikler ve Avantajlar Çoklu Zaman Çerçevesi Analizi – M1, M5, M15 trendlerini tek panelde gösterir. ATR Tabanlı Trailing Stop – Volatiliteye göre dinamik olarak ayarlanır. Profesyonel Gra
Her gün binlerce trader aynı tuzağa düşüyor. Fiyat kritik bir seviyeyi kırıyor. İşleme giriyorsun. Sonra BOOM — piyasa tersine dönüyor ve stopunu patlatıyor. Bu gerçek bir kırılım değildi. Asıl hareket başlamadan önce perakende parayı tuzağa düşürmek için tasarlanmış bir yanılsamaydı. Profesyonel trader’lar buna “likidite süpürmesi” (liquidity sweep) der. Akıllı para buna “stop avı” (stop hunt) der. TANIŞTIRIM: MIRAGE TRADING SYSTEM — sahte kırılımları avantajına çevir. SINIRLI LANSMAN: Şimdi s
- Real price is 80$ - 45% Discount (It is 45$ now) Contact me for extra bonus   indicator, instruction or any questions! - Lifetime update free - Non-repaint - Related product: Gann Gold EA - I just sell my products in Elif Kaya Profile, any other websites are stolen old versions, So no any new updates or support. Advantages of  M1 Scalper Pro  Profitability: M1 Scalper Pro is highly profitable with a strict exit strategy. Frequent Opportunities: M1 Scalper Pro  takes advantage of numerous smal
Yazarın diğer ürünleri
NakaTrend
Ricardo De Andrade Nakano
2 (1)
"NakaTrend'i Tanıtıyoruz: MetaTrader 5 İçin Son Trend Belirleyici! Trading deneyiminizi devrim niteliğinde bir hale getirmeye hazır mısınız? NakaTrend'i keşfedin, trend değişikliklerini hassas ve kolay bir şekilde belirlemek için güvenilir göstergeniz. NakaTrend ile artık piyasadaki dalgalanmalardan yararlanma fırsatını kaçırmayacaksınız. Yükselen bir trend ortaya çıktığında, NakaTrend bunu yeşil bir dolar işareti ile belirtir ve alış emri vermenizi önerir. Ve eğer eğilim düşüşe geçerse, kırm
FREE
NakaSide
Ricardo De Andrade Nakano
Size NakaSide'i Tanıtmaktan Mutluluk Duyarız - Piyasadaki En İyi Fırsat İndikatörünüz! Kârlı işlem fırsatlarını kaçırmaktan bıktınız mı? İşlem yapmayı bir üst seviyeye taşımaya hazır mısınız? Artık daha fazla aramanıza gerek yok çünkü NakaSide işte burada, işlem yapma şeklinizi devrimleştirmek için! NakaSide sıradan bir indikatör değil; karmaşık finansal piyasaların dünyasında kendinize güvenli ve kesin bir şekilde seyretmeniz için gizli silahınızdır. Gelişmiş algoritmaları ve son teknolojiyi
NakaTrendBot
Ricardo De Andrade Nakano
Size NakaTrendBot'u tanıtmaktan gurur duyuyoruz - Trend Ticareti için en son ortağınız! Piyasa değiştiğinde fırsatları kaçırmaktan bıktınız mı? Daha fazla aramayın, çünkü NakaTrendBot, trend ticareti dünyasında gezinmenize yardımcı olmak için burada. NakaTrendBot, sadece bir robot değil; hassas trend değişikliklerini ve konsolidasyonları tespit etmek için tasarlanmış sofistike bir algoritma makinesidir. İleri düzey makine öğrenme algoritmaları ve gelişmiş teknik analiz kullanarak, NakaTrendBo
NakaSideBot
Ricardo De Andrade Nakano
Tanıtıyoruz: NakaSideBot - Yan Piyasa Şampiyonunuz! Piyasa yön değiştirdiğinde fırsatları kaçırmaktan bıktınız mı? NakaSideBot ile tanışın, yan piyasa şampiyonunuz! Bu son teknoloji robotu, sürekli değişen piyasa koşullarında başarılı olmak için tasarlanmış olup, hem trend hem de yan piyasalar için mükemmel bir şekilde uyum sağlar. NakaSideBot, piyasa geçişleri veya konsolidasyonları sırasında diğerlerinin göz ardı edebileceği fırsatları yakalar. Gelişmiş algoritmaları sayesinde, trend değişi
Filtrele:
pauloideriha
14
pauloideriha 2026.01.16 14:43 
 

Kullanıcı incelemeye herhangi bir yorum bırakmadı

Jonilton Silva De Barros Santos
136
Jonilton Silva De Barros Santos 2025.11.05 02:29 
 

Não funciounou na conta DEMO! em nenhum tempo grafico!

Ricardo De Andrade Nakano
2239
Geliştiriciden yanıt Ricardo De Andrade Nakano 2025.11.10 15:30
Funciona somente se seu broker fornece os dados de book. Se importa em me dizer qual seu broker para eu poder arrumar o indicador, por favor?
İncelemeye yanıt