YouTube'dan Mağaza ile ilgili eğitici videoları izleyin
Bir alım-satım robotu veya gösterge nasıl satın alınır?
Uzman Danışmanınızı
sanal sunucuda çalıştırın
sanal sunucuda çalıştırın
Satın almadan önce göstergeyi/alım-satım robotunu test edin
Mağazada kazanç sağlamak ister misiniz?
Satış için bir ürün nasıl sunulur?
MetaTrader 4 için teknik göstergeler - 121

Previous Period High Low . This indicator shows the previous Day, Week, Month and Years High and Low. It's great for price action strategies. : Provides clear and visible breaks in structure. : Easy to see breakout levels. : Easy to see gaps between previous high, low levels after breakouts have occurred. The indicator works on every time frame. Multiple periods can be selected and be seen on the same chart. Every line can be customized to Your liking. Color, style and thickness. Enjoy!

UR Vortex
The Probabilistic UR Vortex Formula: An Accurate System for Predictive Market Analysis using Volatility and Standard Deviation Calculations. The UR Vortex indicator is a technical analysis tool that uses volatility and standard deviation calculations to predict potential tops and bottoms in a market. It measures the strength of a trend by calculating the distance between the current price and a moving average, and then standardizing this distance by dividing it by the average true

R Hareket Kolaylığı Metatrader 4 forex göstergesi mavi renkli bir EMZ ticaret osilatörüdür. Bir yükseliş ve düşüş ticaret alanı oluşturan osilatör tipi bir forex göstergesidir. Sıfır seviyesinin üzerindeki değerlerin yükseliş, sıfır seviyesinin altındaki değerlerin düşüş olduğu söylenir.
R Ease of Movement osilatörü tek başına iyi sonuçlar vermez, teknik göstergeyi takip eden bir trend ile birlikte işlem görmesi gerekir. İyi forex trend göstergeleri şunları içerir: SMA, EMA, PSAR, Bollinger Ba
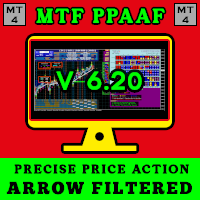
Yalnızca tek bir gösterge kullandığınız için sık sık işlem kaybediyorsanız bu işlem aracını deneyin. Bu ticaret aracı birden fazla gösterge kullanır. Yalnızca RSI göstergesini kullanan tüccarları sıklıkla gözlemliyorum. Çoğu zaman piyasa aşırı satıştadır ancak hala aşağıdadır veya piyasa aşırı alımdadır ancak hala yüksektir. Bu nedenle birden fazla gösterge kullanmanız gerekir. Yeni sürüm V 3.40 MTF PPAAF ile tanışın: Çoklu Zaman Çerçevesi Hassas Fiyat Eylem Oku Filtrelendi. Bu ticaret aracı, p

50% Off Today Only! Price Goes Back Up at 11 PM (EST)
uGenesys Volume Indicator: Your Key to Mastering Market Volume Analysis What Traders Are Saying: "A must-have indicator...really a game-changer." – wuzzy66 "Amazing indicator...strongly recommend to beginners." – joinbehar Understanding Market Volume: Volume in the market is a critical indicator of movement and opportunity. The uGenesys Volume Indicator is specially crafted to pinpoint when the market has the most volume, allowing you to tr

UR PulseScalp Hızlı tempolu piyasalarda en üst noktayı arayan kazıyıcılar için kalibre edilmiş bir ticaret göstergesi
UR PulseScalp , hızlı tempolu pazarlarda en üst noktayı arayan kazıyıcılar için son teknoloji bir ticaret çözümüdür. Bu yenilikçi gösterge, son derece doğru ve güvenilir bir sinyal oluşturmak için Volatilite, MoneyFlow ve Relative Strength'in gücünü harmanlayan bilimsel olarak kalibre edilmiş bir formül üzerine kurulmuştur.
UR PulseScalp kullanmanın avantajları:
Konforlu İnt

MACD (short for M oving A verage C onvergence/ D ivergence) is a popular trading indicator used in technical analysis of securities prices. It is designed to identify changes in the strength, direction, momentum, and duration of a trend in a security's price.
History Gerald Appel created the MACD line in the late 1970s. Thomas Aspray added the histogram feature to Appel's MACD in 1986.
The three major components and their formula 1. The MACD line: First, "PM Colored MACD" employs two Moving

Signal trend indicator for scalping. Has three different sensitivity options
It detects a trend change and gives signals to open positions.
Has built-in audio and visual trend change alerts. Can send notifications to your phone or email. Allows you to open positions in a timely manner in accordance with the direction of the market. Works on all timeframes, on all currency pairs, metals, indices and cryptocurrencies. Can be used when working with binary options. Distinctive features Does not

MACD Color for GOLD Use for looking moving-way of graph and checking will be buy or sell Easy for looking by see the color of trand. Red is down / Blue is up. Can to use it with every time-frame by 1. Long Trade : Use it with time-frame H1 / H4 / Daily 2.Short Trade : Use it with time-frame M5 / M15 / M 30 / H1 and you can see when you will open or close the orders by see this indicator by well by see signal line cut with color line again in opposite. and you can use this indicator for
RumahForexID Momentum Scalping Indicator is the best momentum indicator ever created, and why is that? The indicator works on all timeframes and assets, the indicator is made after 6 years of experience in forex. You know many momentum indicators on the internet are unhelpful, and difficult to trade, but RumahForexID Momentum Scalping Indicator is different , The indicator shows wave momentum, when the market is about to trend or consolidate, all that in one simple and clear indicator!
RumahFo
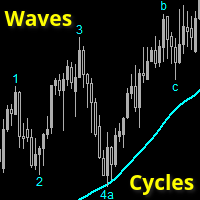
Wave and Cycle counter to give an immediate indication how far the ongoing trend has progressed.
Low numbers: trend has just started, ride the trend. Higher numbers: trend is 'older', watch for reversals
This indicator is 100% compatible with the fantastic TopDog trading strategy.
(I will NOT give any details about this Top Dog strategy)
The trend direction is determined by a SMA value (or any other MA) you can set.
Waves and cycles numbers and letters are derived from a SlowStoch setting.
Wave

OB Breakout is alert indicator that identifies when a trend or price move is approaching exhaustion(Supply and Demand) and ready to reverse. It alerts you to changes in market movement which typically occur when a reversal or major pullbacks are about to or have happened. The indicator identifies breakouts and price momentum initially, every time a new high or low is formed near a possible Supply or Demand level point. The indicator draws in a rectangle on Supply or Demand Zones. Once price we

Key Level Key Level is a MetaTrader 4 Indicator that uses a proprietary algorithm based on Price Retracement/Breakout Method to show the Entry-Line on your trading.
Instead, it analyzes data of market and identify entry points and opportunities. (Price Retracement / Price Breakout)
It's also a trading tool that be used to practice and enhance your manual trading skills.
Key Level is an amazing tool for Scalping Trader. It also a trading tool that be used to practice and enhance your manual trad

Momentum Breakout Finder (MoBlast) is an indicator based on Volume to find the when the current pair is making breakout and when market are range bound. Oscillators Indicators like RSI, MACD that works fine for an interval of the market, it fails to generate profitable signals when the market conditions change, and hence it produces wrong signals resulting in big losses. This indicator implements an volume logic algorithm that finds the best breakout of the symbol. When an arrow signal appears
Современный индикатор паттерна Ключевой разворот. Имеет настройки таймфрейма. Можно настроить количество баров для отображения индикатора на графике. Индикатор предпочтительно использовать на часовом таймфрейме и выше, но работает и ниже. Подходит для использования с любой стратегией. Условие отображения: какой таймфрейм указали в настройках, галочку во вкладке отображение ставим там же. Для фильтра можно использовать скользящую среднюю.

Volume predictor is an essential indicator if you trade with volumes, this indicator predicts the final volume of the current candle and increases it's precision as the time goes by. In order to predict the final volume the current volume and market conditions are used, the predicted volume adjust in real time. You can change every individual color of the indicator to your liking, the default colors were assigned to be easy on your eyes while using a dark theme. Don't forget to leave your revie

"BUYUK SAVDOGAR" TM has developed this strategy to support all who trade binary options.
This trading system determines the state of imbalance in the market based on volume analysis. The most convenient point for opening a trade is an imbalance situation. The trading system independently allocates an imbalance zone. Issues a warning (alert) in the desired direction.
The terms of trade are very simple. We are waiting for directions. We open a deal on the current timeframe in the direction.
It

Современный индикатор паттернов PinBar по торговой стратегии RAIT. Работает по тренду и без него. Имеет настройки таймфрейма для отображения. Можно настроить количество баров для отображения индикатора на графике. Используется несколько паттернов PinBar. Индикатор предпочтительно использовать на часовом таймфрейме и выше, но работает и ниже . Паттерны: PinBar, InsPinBar, PinInside. Отображаются одной стрелкой.

This Harmony Cross Signal indicator is designed for signal trading. This indicator generates trend signals.
It uses many algorithms and indicators to generate this signal. It tries to generate a signal from the points with the highest trend potential.
This indicator is a complete trading product. This indicator does not need any additional indicators.
The indicator certainly does not repaint. The point at which the signal is given does not change.
Features and Suggestions Time F

PURCHASE THIS INDICATOR AND GET OUR SECRET BONUS! Why is TREND Important? This is one of the biggest questions asked by beginner traders. Trend is important because that is primarily when the market moves the most. When a market has good volume, many banks, hedgefunds and large institutions are participating and driving price up or down in strong trends. THIS IS THE PERFECT TIME TO TRADE. The uGenesys Multi-Trend Indicator was specifically designed to identify when a trend has started in the ma

The RSI and Moving Average Indicator is a powerful tool for any trader looking to take their technical analysis to the next level. With the RSI as the main indicator, you will have access to a clear and accurate representation of the strength of the current market trend. The addition of the moving average line adds another level of insight, providing a smoothed view of the RSI that helps to identify longer-term trends and potential buying or selling opportunities. Whether you are a day trader, s

Super Magic Signal indicator is designed for signal trading. This indicator generates trend signals.
It uses many algorithms and indicators to generate this signal. It tries to generate a signal from the points with the highest trend potential.
This indicator is a complete trading product. This indicator does not need any additional indicators.
The indicator certainly does not repaint. The point at which the signal is given does not change.
Features and Suggestions Time Frame: H1 W

Sharp Transition is a new product that allows you to identify the current market phase (uptrend, downtrend or flat). Represents a typical investor strategy that usually indicates a trend change from bearish to bullish. A tool that allows you to determine the direction and strength of a trend. Unlike most indicators, Sharp Transition finds longer trends and gives fewer false signals.
This indicator displays arrows of different colors depending on the current state of the market and thus signals
If you do not have your own trading strategy yet, you can use our ready-made trading strategy in the form of this indicator. The Your Trends indicator tracks the market trend, ignoring sharp market fluctuations and noise around the average price.
The indicator is based on price divergence. Also, only moving averages and a special algorithm are used for work. It will help in finding entry points in the analysis and shows favorable moments for entering the market with arrows. Can be used as a fi

The ORB The Opening Range Breakout or the OPR 'Open Price Range' MT5 Indicator is a powerful tool designed to enhance your trading experience by automatically tracking market openings range , custom ranges, sessions, and Asian ranges. This dynamic indicator is perfect for price action traders, offering unparalleled precision and accuracy without any manual effort. Key Features: London ORB The Opening Range Breakout : Automatically displays the London open price range. New York ORB The Ope

The Trend PT indicator tracks market trends, ignoring sharp fluctuations and market noise. The indicator can work both for entry points and as a filter.
The Trend PT indicator displays information in a visual way. It will help in finding entry points in the analysis. Suitable for trading on low timeframes because it ignores sudden price spikes or corrections in price action by reducing market noise around the average price.

With the help of the Impulses Enter forex indicator algorithm, you can quickly understand what kind of trend is currently developing in the market. The Elephant indicator accompanies long trends, can be used without restrictions on instruments or timeframes. With this indicator, you can try to predict future values. But the main use of the indicator is to generate buy and sell signals. The indicator tracks the market trend, ignoring sharp market fluctuations and noises around the average price.

Big movement indicator is a very simple indicator which draws a pattern of boxes where price has moved significantly on a particular timeframe. It also displays the number of candles the strong movement is continuing till now. This indicator work based on zig zag indicator when there is a minimum gap between the last 2 zigzag values we draw a box around this. We can also capture the point where it meet the criteria as buffer values

This indicator offers a unique perspective; it looks a lot like Envelopes but is totally different.
The default parameters are the same as I use in my strategies, every day and with all pairs, although each pair has its own characteristic.
By changing the parameters you can enter Fibonacci levels that you prefer, I use 0.5/1.0/1.5 which equals 50/100/150 .
NO-REPAINT unlike other similar indicators Hot Range does not redraw level lines, I use a simple strategy, when the 1.5 level is reached

The standard Relative Strength Index (RSI) indicator, in which we have added notification functions to the phone and email. In the indicator settings, you can specify the upper and lower limits of the indicator, upon reaching which the indicator will send you a notification to your phone and email. The notification will be sent in the following format: currency pair + timeframe + notification time. If you use this free standard indicator in your trading strategy, then our improved version of th
One of the basic needs of every trader is to have a checklist to enter every position. Of course, using pen and paper may not be convenient forever. With this indicator, you can have a small checklist next to the screen for each of your charts and use it for better use in your trades. MT5 Version This indicator will have many updates and special settings will be added to it.
You can contact us via Instagram, Telegram, WhatsApp, email or here. We are ready to answer you.

The TrendChangeZone indicator displays global and local price highs and lows on the chart. The indicator also shows the global trend on the chart and corrective waves. This indicator is designed to determine the direction and change the trend. Most importantly, the indicator shows trend continuation or reversal zones. An indispensable assistant in trading. The indicator does not redraw. The indicator can work on all trading instruments.
Important !!! Top trend if 2 (two) or more blue segments
You can identify the strength of the main forex currencies with this tool. You can combine it with different styles and get the best strategy out of it. It has very high power. It can be customized.
MT5 version
This indicator will have many updates and special settings will be added to it.
You can contact us via Instagram, Telegram, WhatsApp, email or here. We are ready to answer you.
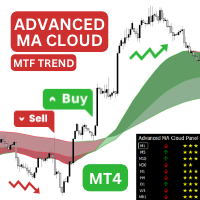
Introducing the Advanced MA Cloud indicator for MetaTrader 4 - a powerful indicator system that will help you identify potential buy and sell opportunities, as well as potential trend reversals. Advanced MA Cloud indicator is a great trend following indicator based on three fully customisable Moving Averages. In addition, t he indicator can also act as a support and resistance using the two clouds formed by the moving averages. Each moving average and each cloud changes its color according to

Support and resistance are the basic and widely used trading strategies in the financial trading world. The Support and Resistance indicator for MetaTrader is the best technical tool for identifying potential areas of a support or resistance zone. The indicator is a multi-timeframe indicator that automatically scans through different timeframes for support&resistance zones. It displays lines of the support&resistance zones of a specified period in all the time frames. This implies that the indi

Ayak izi grafiği için çok talep edilen bir istek ekledim. Gösterge çok basittir ve teklif hacimlerini ve talep hacimlerini gösterir. Bu bir sinyal göstergesi değildir, sadece mumlardaki hacimleri gösterecek ve aynı zamanda geçmiş değerleri de gösterecektir. Forex'in merkezi bir hacmi yoktur, ancak bu parçalanır ve kene hacmini gösterir. Mum satmak istekleri, mum almak teklifleri gösterecektir. Tek bir analiz sistemi olarak veya diğer faktörlerle birlikte alınıp satılabilir. Piyasayı bu anlamda

System 17 with ATR Strategy is a trend-Momentum system filtered by volatility. Averange true range is the indicator of volatility that I use as filter. Best time frame for this trading system is 30 min. Currency pairs: EUR/USD, USD/CAD, USD/JPY, AUD/USD, GBP/USD, GBP/JPY, NZD/USD, EUR/JPY. Metarader Indicators: System 17 (trend following indicator with arrow buy and sell), this indicator is formed by moving average 12 period, close, Bollinger Bands period 8, deviation 0.75, Moving average 21

You have made a great decision to try this powerful indicator. The FX Turbo is a supreme forex trading indicator that will help you achieve your financial goals on currency market. In this post you will learn how to use and trade with FX Turbo Marksman indicator. Recommended Timeframe
This indicator was optimized for 1-hour timeframe but you can successfully use it on any timeframe as well. Generally speaking higher timeframes are for swing trading and and lower timeframes are for scalping.

One of the most popular methods in technical analysis used by both institutional and retail traders is determining the resistance and support levels using the so-called Pivot Point, which in turn is the starting point when defining market sentiment as bullish or bearish. Resistance and support levels are distinguished for their ability to limit the appreciation/depreciation of a certain asset. The most-commonly used technical tools for determining resistance/support levels include: prior tops/bo

Candlestick patterns have little value without the right price action context. If you’ve been studying candlestick formations, you must have heard this principle many times over. You cannot trade patterns in a vacuum. But what do we mean by context ? It is an overall technical assessment that encompasses: The market’s trend Support and resistance structure Recent price formations Volatility It seems intimidating at first, but a simple trading indicator can help us out here - the moving a

The Hybrid Trend indicator is used to determine the strength and direction of a trend and to find price reversal points. The Hybrid Trend indicator is used in the forex markets. The indicator was created in order to display the trend in a visual form. One of the main definitions for monitoring the currency market is a trend.
The trend can be up (bullish) or down (bearish). In most cases, the trend rises for a long time and falls sharply, but there are exceptions in everything. The price moveme

Tired of choosing indicator settings, losing precious time? Tired of uncertainty in their optimality? Scared by the unknown in their profitability? Then the Trend IM indicator is just for you. The indicator will save you a lot of time that can be spent on more useful activities, such as relaxing, but at the same time, the efficiency will increase many times over. It uses only one parameter for setting, which sets the number of bars for calculation.
Trend IM is a reversal indicator and is part

Trend Oracle trend indicator, shows entry signals. Displays both entry points and the trend itself. Shows statistically calculated moments for entering the market with arrows. When using the indicator, it is possible to optimally distribute the risk coefficient. The indicator can be used for both short-term pipsing and long-term trading. Uses all one parameter for settings. Length - the number of bars to calculate the indicator. When choosing a parameter, it is necessary to visually similarize s

Индикатор виртуального эквити, представляемый здесь, может работать по нескольким
символам одновременно. Для каждого символа задается направление ( Buy/Sell ) и размер позиции.
В настройках также указывается размер предполагаемого депозита, дата открытия и закрытия
позиции.
На графике при этом устанавливаются вертикальные линии, обозначающие указываемые в настройках даты.
После установки индикатора на график, можно изменять время открытия и закрытия позиции,
передвигая эти линии.
Дату закр
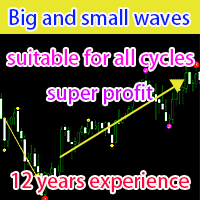
Bu, periyodik yukarı veya aşağı ticaret eğilimlerini küçük, orta ve büyük açılardan analiz eden mükemmel bir teknik gösterge sistemidir.
Parametrelerdeki Periyot1 küçük bir zaman periyodu, Periyot2 orta zaman periyodu ve Periyot3 büyük bir zaman periyodudur; küçük_sembol 1 numaralı sinyalin tanımlayıcısıdır, orta_sembol 2 numaralı sinyalin tanımlayıcısıdır ve büyük_sembol tanımlayıcıdır 3 numaralı sinyalin ;uyarı, uyarı düğmesinin anahtarıdır, Mail, e-posta gönderme anahtarıdır ve Bildirim, an

A cycle is a recognizable price pattern or movement that occurs with some degree of regularity in a specific time period. The analysis of cycles shows us support and resistance that represent smart places to anticipate a reaction in the price of an asset, and therefore represent a basic tool in technical analysis. Cycle lengths are measured from trough to trough, the most stable portion of a cycle. The information you find on this page is useful to combine with Elliott wave analysis .

Pivots Points are price levels chartists can use to determine intraday support and resistance levels. Pivot Points use the previous days Open, High, and Low to calculate a Pivot Point for the current day. Using this Pivot Point as the base, three resistance and support levels are calculated and displayed above and below the Pivot Point. and below the Pivot Point.

A Market Profile is an intra-day charting technique (price vertical, time/activity horizontal) devised by J. Peter Steidlmayer, a trader at the Chicago Board of Trade (CBOT), ca 1959-1985. Steidlmayer was seeking a way to determine and to evaluate market value as it developed in the day time frame. The concept was to display price on a vertical axis against time on the horizontal, and the ensuing graphic generally is a bell shape--fatter at the middle prices, with activity trailing o

The best way to identify the target price is to identify the support and resistance points. The support and resistance (S&R) are specific price points on a chart expected to attract the maximum amount of either buying or selling. The support price is a price at which one can expect more buyers than sellers. Likewise, the resistance price is a price at which one can expect more sellers than buyers.

This is first public release of detector code entitled "Enhanced Instantaneous Cycle Period" for PSv4.0 I built many months ago. Be forewarned, this is not an indicator, this is a detector to be used by ADVANCED developers to build futuristic indicators in Pine. The origins of this script come from a document by Dr . John Ehlers entitled "SIGNAL ANALYSIS CONCEPTS". You may find this using the NSA's reverse search engine "goggles", as I call it. John Ehlers' MESA used this measurement to

The "Strategic scalping" indicator displays possible trend reversal points on the chart. The indicator highlights two different pivot points: high points (pivot points from above) and low points (pivot points from below). Upper pivot points are indicated by down arrows and appear on the chart when the price reaches a high and starts to fall. Pivot lows are indicated by arrows pointing up and appear on the chart when the price bottoms out and starts to rise. The indicator can be useful for trade

green up = buy red down = sell with alerts! that's how easy it is. --this indicator follows trend --based on moving averages and rsi and macd and pivot points --good for scalping and intraday trading and daytrading --works for swing --recommended time frame is 15m or 5m contact me after purchase to receive a trading strategy with the indicator with another bonus indicator!
A robot that trades on the signals of this indicator https://www.mql5.com/en/market/product/46338
This indicator is a high-frequency tool designed for technical analysis of price dynamics in the Forex market in the short-term period. The scalping approach, where this indicator is used, is aimed at quickly executing trades and achieving small profits within short timeframes. The indicator is based on price chart analysis and employs highly sensitive mathematical algorithms to determine changes i
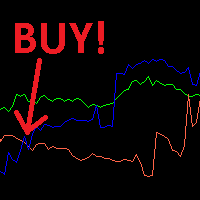
Ready trading strategy for scalping. When the blue line crosses the red line from the bottom up, we open a buy order. When the red line crosses the blue line from bottom to top, we open a sell order. Indicator period 14. Currency pairs: GBPUSD, EURUSD, XAUUSD, AUDUSD, USDJPY. USDCHF, USDCAD. Stoploss is set from 45 to 75 points, depending on the currency pair (you need to experiment). TakeProfit is set from 20 to 40 points, depending on the currency pair. The best time to trade is from 09:00 am
Unlike many other indicators including the moving average indicator, Pivot Point can be a leading indicator. In these systems, the price levels of the previous period are used to determine the critical points instead of relying on the current price performance. Such an approach provides a clear framework for traders to plan their trades in the best possible way.
You can use this method and its combination with the methods you want to build and use a powerful trading setup. MT5 version
Let us kno
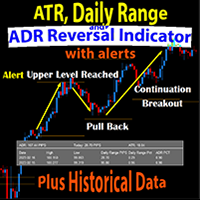
The Daily Range and ADR Reversal Indicator shows you where price is currently trading in relation to its normal average daily range. You will received alerts via pop-ups when price exceeds its average daily range. This alert is a signal for a potential pullback or reversal. This gives you an edge on identifying and trading pullbacks and reversals quickly.
The Indicator also shows you the Daily Range of Price for the current market session as well as previous market sessions. It shows you the AT
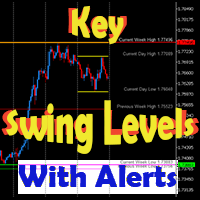
This dynamic indicator will draw the Key Swing High and Low Levels for any symbol on any timeframe!
User may Hide or Show any Level or Label and also Receive Alerts when price returns to that key level via Pop-Up, Push, Email or Sound.
Levels include Current Day High/Low, Previous Day High/Low, Current Week High/Low, Previous Week High/Low and Monthly High/Low.
The Key Levels are labeled with the Price Point Data Listed next to it for quick easy reference.
You can change the Style, Siz

This dynamic indicator allows you to measure retracements of price between any two points in either direction. It displays the price points, percentages and also displays the extension levels.
User may Modify and Add addition levels and extensions." User may also Add multiple Fibonacci indicators on the chart and change their colors, style and sizes.
Can be used on any timeframe.
This is the only Fibonacci Tool you'll need to measure and trade on Structure.
MT5 Version Available as well (

This dynamic indicator will identify when Fast Moving Averages (EMA, SMA, or LW) cross Slow Moving Average lines on any timeframe and with any symbol.
When the moving averages cross and price close above or below the crossing, the User will receive an alert via pop-up, push, or email.
Choose any two Moving Averages to cross to receive an alert and the Indicator will also paint the Moving Average Lines and Arrows.
You can choose Exponential Moving Averages (EMA). Simple Moving Averages (SMA) o

False Breakout Detector Detect new highs and new lows in price action. When the market tries to break these highs and lows but fails, the indicator places an arrow on the chart and sends out an alert (Email, Push on platform or Movil)
Simple and easy to use Does not require strange configurations Works on all assets and time frames
------------------------------------------------------
[ MT5 Version ] [ Kill Zones ] [ SMT Divergences ] How to trade using Order Blocks: Click here
User Interface Performance: During testing in the strategy tester, the UI may experience lag. Rest assured, this issue is specific to the testing environment and does not affect the indicator's performance in live trading. Elevate your trading strategy with the Order Blocks ICT Multi TF indicator, a cutting-edge tool designed to enhance your trading decisions through advanced order block analys

Next Trend Pro INDICATOR - the best trend indicator on the market, the indicator works on all timeframes and assets, the indicator is built on the basis of 12 years of experience in forex and many other markets. You know that many trend indicators on the internet are not perfect, late and difficult to trade with, but the Next Trend Pro indicator is different, the Next Trend Pro indicator shows a buy or sell signal, colored candles confirm the signal, and support levels and resistance levels give

Spirit mt4 is an indicator that works without flashing, the signals are triggered after the arrow at the beginning of the next candle
Includes several indicators for overbought and oversold levels.
Works with any currency pair: EUR/USD, AUD/USD and others.
After the purchase, send me a private message and I will send you the settings that I use for this indicator.
Suitable for trading cryptocurrencies.
I like to trade cryptocurrency more, so I use it more there.
It can also be used for bi
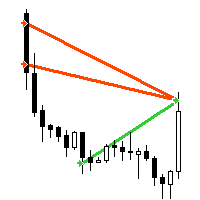
"AV Trade History" is an indicator for MetaTrader 4, which similar to the MetaTrader 5 "Trade History" or "Show trade history" setting, shows the closed trades in the chart. It also shows the orders history in the strategy tester, makes it easier to see them when testing expert advisors automated trading.
Improvements :
- Visibility is increased by line thickness and free choice of color.
- Additional information about the trade is visible when hovering over it, e.g. ticket, magic, comment,

Looking to take your forex trading to the next level? Look no further than my revolutionary forex indicator. Here are j many reasons why you should start using my indicator today: Easy to Use: With an intuitive interface and simple setup process, my forex indicator is easy for traders of all levels to use. Comprehensive Data Analysis: My forex indicator is backed by rigorous data analysis and machine learning algorithms, giving you a comprehensive view of the market. Real-Time Updates: Stay up-t

Supp & Resist Every Trader Need that an Indicator will show you zones for weak, Untested, Verified, Proven and Reversal Support and Resistance with smart calculation. take a look for the Screenshots there some explanations. i don't want to talk a lot :) try it by yourself for FREE because everything is clear in the inputs parameters. If you have any question feel free to ask me.
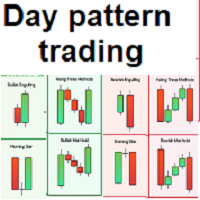
Simple and effective indicator based on some candle patterns recognition Arrows appear on candles when bear signal / bull signal based on candle pattern recognition -----> TWO strategies available you can enable / disable one of them Indicator can work on any chart and time frame I prefer to work on high time frames especially the Daily charts D1 and H4 Red arrows appears above candle showing a bear signal after candle completed - arrow will be blue during candle formation Green arrows appears b
Check My Products
Contact me to discover all my services
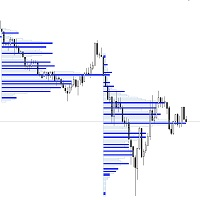
I present to you one of the most sought after indicators by traders! It is one of the most useful and valuable indicators for discretionary trading.
It used to be easier to access this indicator from various platforms, but growing demand makes it impossible to use it on external platforms (such as TradingView) without paying a monthly subscription.
That's why I decided to use my experience in software programming to create this indica
Check My Products Contact me to discover all my services
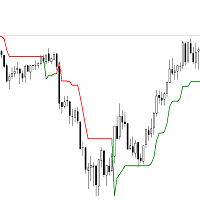
FEEL FREE TO ADD A REVIEW TO HELP ME AND OTHER COSTUMERS This is an indicator based on the famous SuperTrend. Thanks to this mt4 software, it is now possible to have them directly on the mt4 platform, without having to pay subscriptions for external platforms.
It is one of the most functional trend indicators that exists, and it really makes a difference when it comes to discretionary trading.

The First Dawn indicator uses a unique mechanism to search and plot signals.
This keeps searching for signals, making it a great indicator for scaping and identification of changes in direction, swing trading and trend trading.
The First Dawn helps you get early signals. The backtest gives the true picture of how the indicator works with real/demo accounts.
Although this is a tiny indicator it is packed with advantageous settings that will help you whether you desire to: Snap the Peaks and
MetaTrader mağazası - yatırımcılar için alım-satım robotları ve teknik göstergeler doğrudan işlem terminalinde mevcuttur.
MQL5.community ödeme sistemi, MetaTrader hizmetlerindeki işlemler için MQL5.com sitesinin tüm kayıtlı kullanıcıları tarafından kullanılabilir. WebMoney, PayPal veya banka kartı kullanarak para yatırabilir ve çekebilirsiniz.
Alım-satım fırsatlarını kaçırıyorsunuz:
- Ücretsiz alım-satım uygulamaları
- İşlem kopyalama için 8.000'den fazla sinyal
- Finansal piyasaları keşfetmek için ekonomik haberler
Kayıt
Giriş yap
Gizlilik ve Veri Koruma Politikasını ve MQL5.com Kullanım Şartlarını kabul edersiniz
Hesabınız yoksa, lütfen kaydolun
MQL5.com web sitesine giriş yapmak için çerezlerin kullanımına izin vermelisiniz.
Lütfen tarayıcınızda gerekli ayarı etkinleştirin, aksi takdirde giriş yapamazsınız.