MetaTrader 5용 기술 지표 - 26

Indicator IRush uses a modified version of a popular indicator RSI (Relative Strength Index) to look for entries on a daily chart or lower. The indicator has been set up and tested with the major symbols: AUDUSD, EURUSD, GBPUSD, USDCAD, USDCHF, and USDJPY. An automated trading with this indicator is implemented in the expert advisor Intraday Rush . This expert advisor can open, trail and close its trades. Check it out, it may be exactly what you are looking for!
A Correct Reading of IRush
The c
FREE

Tillson's T3 moving average was introduced to the world of technical analysis in the article ''A Better Moving Average'', published in the American magazine Technical Analysis of Stock Commodities. Developed by Tim Tillson, analysts and traders of futures markets soon became fascinated with this technique that smoothes the price series while decreasing the lag (lag) typical of trend-following systems.
FREE

Probability emerges to record higher prices when RVi breaks out oscillator historical resistance level. It's strongly encouraged to confirm price breakout with oscillator breakout since they have comparable effects to price breaking support and resistance levels; surely, short trades will have the same perception. As advantage, a lot of times oscillator breakout precedes price breakout as early alert to upcoming event as illustrated by last screenshot. Furthermore, divergence is confirmed in
FREE

As médias coiote automatizam a leitura de analise de médias rápidas e lentas no saldo do volume e preço. Quando as médias estão em modo compra, a coloração do candle fica azul.
Quando as médias estão em modo venda, a coloração do candle fica magenta. Quando a coloração fica verde ou vermelho, temos a tomada das médias no volume mas não no preço, quando isso ocorre é um sinal de atenção.
A concepção do indicador é ser utilizado para operações em saída de consolidações na direção da tendencia do
FREE

RITZ QUANTUM PULSE Next-Generation Economic Intelligence System Ritz Quantum Pulse — Next-Gen Economic Intelligence System.
Experience quantum-level precision in news trading: real-time event detection, AI-powered filtering, and temporal synchronization.
Anticipate volatility before it happens — not after.
Where Market Intelligence meets Temporal Physics. Ritz Quantum Pulse represents the convergence of quantum logic , AI-driven analytics , and real-time economic intelligence .
This is
FREE

Friend of the Trend: Your Trend Tracker Master the market with Friend of the Trend , the indicator that simplifies trend analysis and helps you identify the best moments to buy, sell, or wait. With an intuitive and visually striking design, Friend of the Trend analyzes price movements and delivers signals through a colorful histogram: Green Bars : Signal an uptrend, indicating buying opportunities. Red Bars : Alert to a downtrend, suggesting potential selling points. Orange Bars : Represent cons
FREE

Introduction to Fractal Moving Average Fractal Moving Average indicator was designed as part of Fractal Pattern Scanner. Inside Fractal Pattern Scanner, Fractal Moving Average Indicator was implemented as multiple of chart objects. With over thousands of chart object, we find that it was not the best and efficient ways to operate the indicator. It was computationally too heavy for the indicator. Hence, we decide to implement the indicator version of Fractal Moving Average indicator to benefit ou
FREE

Multi-period Parallel Random Oscillator 1. Main chart cycle main line and signal line 2. 15M 30M 1H fixed cycle signal line Mainly used to observe the overbought and oversold conditions of other cycles in the same chart。 Its main function is to identify moments of multi-cycle resonance, enabling you to better grasp opportunities for buying and selling points.
FREE
Pivot Points Indicator – a fast, reliable, and fully customizable pivot detection for MetaTrader 5. This indicator uses MetaTrader’s native iHighest and iLowest functions to identify pivot highs and lows by scanning for the highest and lowest prices within a user-defined window of bars. A pivot is confirmed only when the current bar is the absolute maximum or minimum within the selected range, ensuring accurate and timely signals based on robust built-in logic.
Key Features No Repainting : Onc
FREE
If you love this indicator, please leave a positive rating and comment, it will be a source of motivation to help me create more products <3 Key Takeaways The Laguerre RSI is an enhanced version of the traditional Relative Strength Index (RSI) that incorporates Laguerre filters to smooth the price data. This helps reduce the noise and volatility that are often seen in the standard RSI, providing a cleaner and more reliable indicator for spotting trends, reversals, and overbought or oversold con
FREE

The indicator plots two lines by High and Low prices. The lines comply with certain criteria. The blue line is for buy. The red one is for sell. The entry signal - the bar opens above\below the lines. The indicator works on all currency pairs and time frames It can be used either as a ready-made trading system or as an additional signal for a custom trading strategy. There are no input parameters. Like with any signal indicator, it is very difficult to use the product during flat movements. You
FREE
MSX Hybrid Heiken Scalper Elevate Your Scalping Precision with a Next-Generation Non-Repaint Heiken Ashi Indicator The MSX Hybrid Heiken Scalper is a scientifically designed, non-repainting Heiken Ashi indicator optimized for M5 to H1 scalping on MetaTrader 5. It introduces a robust closed-bar smoothing method that preserves trend clarity while filtering minor price noise — all without using traditional EMA/WMA/HMA smoothing that causes repainting. Reliable Closed Candle Logic
Each candle’s
FREE

The indicator displays the size of the spread for the current instrument on the chart. Very flexible in settings. It is possible to set the maximum value of the spread, upon exceeding which, the color of the spread label will change, and a signal will sound (if enabled in the settings). The indicator will be very convenient for people who trade on the news. You will never enter a trade with a large spread, as the indicator will notify you of this both visually and soundly. Input parameters: Aler
FREE
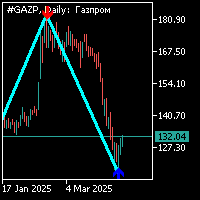
지그자그 표시기는 34 의 주기로 표준으로 추가 화살표 신호가 있습니다. 추가 신호는 지그재그 표시기와 별도로 계산됩니다.이 표시기에 대한 작업은 다음과 같습니다. 지그재그 표시기의 세그먼트를 형성하고 추가 화살표 신호가 나타날 때 화살표 방향으로 위치를 열어야합니다. 이전 팔의 상단에 있는 추가 신호(화살)의 반대 방향으로 지그자그 표시기의 다른 팔을 형성할 때,대기 중인 순서의 위치를 설정하는 것이 가능해집니다.3. 반대쪽 지그재그 어깨에서 추가 신호(화살표)로 형성이 완료되면 이전에 열린 위치에 추가하거나 정지 손실을 이 수준으로 이동할 수 있습니다;4. 보수적 인 거래 모드에서 거래하는 경우 가격 움직임의 첫 번째 철수 전에 추가 포지션을 열 수 없습니다. 정확하게 시장에 진입하려면 지그재그 표시기 세그먼트의 형성과 수석 시간대에 추가 신호의 출현을 기다릴 수 있으며 열린 위치에서 40 점보다 더 가까운 정지를 배치 할 수 있습니다. 6. 당신이 무역에 추가 위치를 추가 한

Trend Entry Indicator Your Trading will Be easier with this indicator!!! This Indicator is Developed To make our trading life easier. Get an Arrow for Entry with Take Profit and Slop Loss marks on chart. - Indicator is Based on trend, because thats what we all want we want to follow the trend "it's our friend". - Based on Levels, price action and oscillators. - It works on all currency pairs, all indices, metals and stock. - it works on all pairs/indexes on Deriv including Boom and Crash. - Tim

매수자-매도자 압력 지표는 M1부터 D1까지 다중 시간프레임에서 시장 심리를 표시합니다. 구성 가능한 기간 동안 이동평균 모멘텀 분석을 사용하여 매수 및 매도 압력 백분율을 계산합니다. 시각적 패널은 매수자 강세를 청록색으로, 매도자 우세를 빨간색으로 보여주는 진행 막대를 중요할 때 백분율 값과 함께 표시합니다. 각 시간프레임에는 상승추세, 하락추세 또는 횡보시장을 보여주는 방향 지표와 함께 ADX 추세 강도 측정이 포함됩니다. 횡보 기간(ADX 23 이하) 동안, 트레이더들은 지지 레벨에서 매수하고 저항 구간에서 매도하여 레인지 전략을 실행할 수 있습니다. 색상 코드 신호 점들은 최적 진입 타이밍을 위한 시장 조건의 빠른 시각적 확인을 제공합니다. 성공 메시지- 분석 완료! 전략적 거래 결정을 위한 다중 시간프레임 심리 데이터가 준비되었습니다.
거래 정밀도를 향상시키기 위해 Super Woodies CCI Indicator MT5를 사용하세요. 이는 켄 우드의 유명한 Woodies CCI 시스템에서 영감을 받은 고급 모멘텀 오실레이터로, 2000년대 초반에 데이 트레이더들 사이에서 듀얼 CCI 접근으로 순환 패턴과 고확률 설정을 탐지하는 것으로 인기를 끌었습니다. 소매 및 기관 트레이더들에게 널리 채택된 이 지표는 강력한 추세 식별, 반전 pinpointing, 브레이크아웃 감지에 탁월하며, 연구에 따르면 컨플루언스 전략은 RSI, MACD, ADX와 같은 지표 간 합의를 요구함으로써 승률을 20-30%까지 향상시킬 수 있습니다. 이는 감정적 결정 만들기를 줄이고, 거짓 신호로부터 드로다운을 최소화하며, 변동성 환경에서 스캘핑, 데이 트레이딩 또는 스윙 포지션의 일관된 수익성을 강화합니다. Super Woodies CCI Indicator MT5는 색상 코딩된 히스토그램을 통해 컨플루언스를 시각화합니다: 강세 신호를 위한

- 심지 채우기 트렌드 개념
시장에서 변동성이 큰 이벤트 동안 양초는 이동 중에 심지를 만드는 경향이 있습니다. 촛대의 심지는 가격의 거부를 반영합니다. 이 심지는 대부분 그 방향으로 밀리는 큰 양이 있기 때문에 채워집니다. Wick Fill Trend는 트렌드 시장에 중점을 둔 기회를 스캔합니다.
진입 점과 함께 라이브 신호를 표시하고 이익을 얻고 손실을 막는 성공률 시뮬레이터 대시 보드가 있습니다. 이 성공률 시뮬레이터는 백 테스트로 사용하여 과거에 더 나은 수익을 가진 입력을 확인할 수 있습니다. 핍과 백분율의 이익을 계산하여 과거 성과를 기반으로 사용하기에 가장 적합한 매개 변수가 무엇인지 전체적으로 알 수 있습니다.
- 입력
- 트렌드 심지 :이 입력은 표시기가 스캔해야하는 심지의 크기를 결정합니다. %로 측정됩니다 %. 기본적으로 20 %입니다.
- 신호 수 : 성공률 시뮬레이터를 위해 스캔 할 신호 수입니다.
- 이동 평균 :이 필터는 이동 평균 표시기와 R

Verve AI Reversal Pro Indicator Pro는 정밀한 정확도와 탁월한 시장 통찰력을 추구하는 트레이더를 위한 궁극의 동반자입니다. 최첨단 인공지능 기술을 활용하여 가격 움직임, 거래량, 변동성을 실시간으로 지속 분석함으로써 되돌림이 완전히 형성되기 전에 고확률 전환 지점을 포착합니다. 고급 머신러닝 알고리즘과 검증된 기술적 분석 원칙을 완벽히 결합한 Verve AI는 복잡한 데이터를 명확하고 자신감 있는 신호로 변환하여, 가장 불안정한 시장에서도 안심하고 거래할 수 있도록 돕습니다.
Verve AI Reversal Pro Indicator Pro의 주요 기능:
• 지능형 전환 탐지: AI 엔진이 수백 개의 가격 패턴과 통계 지표를 실시간으로 스캔하여 주요 추세 변화를 예고하는 미묘한 단서를 식별합니다. • 동적 지지선 및 저항선 매핑: 전환이 발생하기 쉬운 핵심 가격 수준을 자동으로 강조 표시하여 정확한 진입 및 청산 포인트를 시각적으로 가이드합니다.

KT Volume Profile은 Y축에 히스토그램 형태로 거래량 누적 데이터를 시각화하여, 특정 시간대 및 가격 수준에서의 거래 활동을 확인할 수 있게 해주는 도구입니다. 이 기능은 트레이더가 거래가 집중된 가격 구간을 식별하는 데 매우 유용합니다.
볼륨 프로파일에서의 POC (Point of Control)
POC는 전체 프로파일 중 가장 많은 거래량이 발생한 가격 수준을 나타냅니다. 일반적으로 주요 지지 또는 저항 영역으로 활용되며, 시장이 본격적인 방향 전환 전에 되돌림을 보이는 핵심 레벨로 작용할 수 있습니다.
주요 기능 사용법이 매우 간단합니다. 사각형을 차트에서 드래그 앤 드롭하면 실시간으로 볼륨 프로파일이 업데이트됩니다. 가격이 POC를 돌파할 경우 알림을 설정할 수 있습니다. 처음부터 경량화된 코드로 설계되어 CPU 및 메모리 자원 사용이 최소화됩니다.
입력 설정 볼륨 소스: 틱 볼륨 / 실제 거래량 프로파일 색상: 히스토그램 막대의 색상 박스 너비:
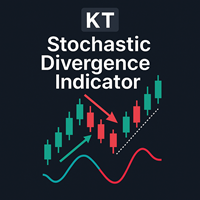
다이버전스는 시장에서 가격 반전을 나타내는 중요한 신호 중 하나입니다. KT Stoch Divergence는 가격과 스토캐스틱 오실레이터 사이에 형성된 정규 및 히든 다이버전스를 표시합니다.
KT Stoch Divergence의 한계
스토캐스틱 다이버전스를 단독 진입 신호로 사용하는 것은 위험할 수 있습니다. 모든 다이버전스가 강력한 반전을 의미하는 것은 아닙니다. 더 나은 결과를 위해 가격 행동 및 추세 방향과 함께 사용하는 것이 좋습니다.
기능
가격과 스토캐스틱 사이의 정규 및 히든 다이버전스를 시각적으로 표시합니다. 추세 반전 및 추세 지속 전략 모두에 적합합니다. EA(자동매매 시스템)에 통합 가능한 구조입니다. 비대칭 다이버전스는 정확도 향상을 위해 제외됩니다. 진입뿐 아니라 청산 신호로도 사용할 수 있습니다. 모든 MT 알림 기능을 포함합니다.
다이버전스란 정확히 무엇인가요? 일반적으로 가격이 고점을 갱신하면 오실레이터도 고점을 갱신해야 하고, 가격이 저점을 갱신하

KT Heiken Ashi Alert는 표준 Heiken Ashi 캔들에 기반하여 매수 및 매도 화살표를 표시하고 다양한 알림을 생성하는 유용한 트렌드 보조 도구입니다. Heiken Ashi를 거래 전략에 통합하고 싶은 트레이더에게 필수적인 도구입니다. Heiken Ashi가 하락 상태에서 상승 상태로 전환되면 매수 화살표가 표시됩니다. Heiken Ashi가 상승 상태에서 하락 상태로 전환되면 매도 화살표가 표시됩니다. 모바일 알림, 이메일, 사운드, 팝업 알림 모두 지원됩니다.
Heiken Ashi란? Heiken Ashi(平均足)는 일본어로 "평균 바"를 의미하며, 기존의 일본식 캔들보다 트렌드를 더 쉽게 파악할 수 있도록 설계된 차트 유형입니다. 이 캔들은 진입과 청산 전략 모두에 활용될 수 있으며, 색상이 바뀌면 종종 시장 방향의 전환을 의미합니다.
중요 포인트
Heiken Ashi Alerts를 단독으로 사용하는 것은 추천하지 않으며, 다른 보조 지표와 함께 사용하는
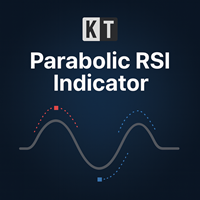
KT Parabolic RSI 는 RSI 선 위에 파라볼릭 SAR을 직접 중첩시켜 시장의 전환점을 더욱 명확하게 보여줍니다. 전통적인 RSI의 과매수와 과매도 구간은 이미 반전을 시사하지만, PSAR 필터를 추가하면 불필요한 노이즈가 제거되어 신호가 더욱 선명하고 신뢰할 수 있게 되며, 거래자가 더 확실한 매매 기회를 잡을 수 있습니다. 큰 사각형 신호: RSI가 과매수 또는 과매도 영역에 있을 때 발생하는 파라볼릭 SAR 전환. 이는 높은 확률로 시장 반전을 나타냅니다. 작은 사각형 신호: RSI가 중립 구간에 있을 때 발생하는 SAR 전환. 이는 확률이 낮은 신호로 간주되며, 부분 청산이나 기존 추세를 따라갈 때 유용합니다.
특징 RSI 모멘텀과 파라볼릭 SAR의 추세 전환을 하나의 오버레이에 결합하여 두 개의 인디케이터 창을 따로 관리할 필요가 없습니다. RSI 창에 나타나는 사각형 마커는 메인 가격 차트에도 동일하게 표시되어 가격 움직임을 보면서도 신호를 확인할 수 있습니다
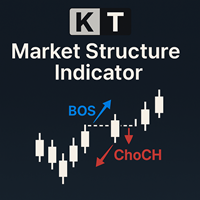
The KT Market Structure intelligently detects and displays Break of Structure (BOS) , Change of Character (CHoCH) , Equal Highs/Lows (EQL) , and various significant swing high/low points using our proprietary algorithm for accurate pattern detection. It also offers advanced pattern analysis by effectively demonstrating the captured profit for each pattern. A fully automated EA based on this indicator is available here: KT Market Structure EA MT5
Features
Accurate Pattern Detection: Our advance
Engulfing Pattern is a free indicator available for MT4/MT5 platforms, its work is to provide "alerts" when a "Bullish" or "Bearish engulfing pattern forms on the timeframe. This indicator comes with alerts options mentioned in the parameter section below. Join our MQL5 group , where we share important news and updates. You are also welcome to join our private channel as well, contact me for the private link. Engulfing Pattern Indicator MT4 Other Products Try our Martini EA with 2 years of liv
FREE

Smoothed Supertrend Indicator - 변동성 기반 추세 지표와 평활화 기능 Smoothed Supertrend Indicator는 MetaTrader 5용 클래식 Supertrend 지표의 고급 변형입니다. 추가 평활화 기능의 통합을 통해 시장 노이즈가 감소하고 추세 신호의 품질이 향상됩니다. 기술 설명: 이 지표는 시장 변동성을 측정하기 위한 Average True Range(ATR)를 기반으로 하며 가격 데이터의 이동평균 평활화와 결합합니다. 결과 라인은 현재 추세 방향을 보여주며 변동성 변화에 동적으로 적응합니다. 계산 방법: 가격의 이동평균(MA) 계산 N 기간에 걸친 Average True Range(ATR) 계산 상하 밴드 계산: 상단 밴드 = MA + (ATR × 승수) 하단 밴드 = MA - (ATR × 승수) 밴드에 대한 종가 위치를 기반으로 추세 결정 계단 로직: 라인은 추세 반전 시에만 변경 입력 매개변수: ATR_Period (기본값: 10
FREE
The RSI with Moving Averages indicator combines the classic Relative Strength Index with customizable moving averages, offering deeper insights into market momentum and trend direction. By smoothing the RSI curve with short- and long-term averages, traders can better distinguish true reversals from noise. This tool highlights overbought and oversold levels, reveals divergences between price and momentum, and confirms entry or exit points with enhanced accuracy. Its adjustable parameters allow tr
FREE
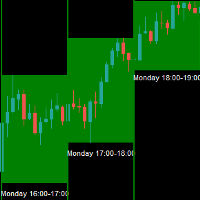
The Entry Signal Analyzer is a sophisticated MetaTrader 5 indicator designed to analyze and identify optimal trading hours based on price movement patterns. The indicator analyzes gold currency only a updated version is currently being developed for other symbol the indicator in the strategy tester is non-functional works on the real chart Statistical Analysis: Analyzes historical price movements for each hour of the trading day Tracks success rates and consistency of movements Calculates poi
FREE

This is a non-parametric ZigZag providing 4 different methods of calculation. Upward edge continues on new bars while their `highs` are above highest `low` among previous bars, downward edge continues on next bars while their `lows` are below lowest `high` among previous; Gann swing: upward edge continues while `highs` and `lows` are higher than on the left adjacent bar, downward edge continues while `highs` and `lows` are lower than on the left adjacent bar. Inside bars (with lower `high` and
FREE

Norion Smart Levels is a professional support and resistance indicator developed to help traders identify the most relevant price levels where the market historically reacts. The indicator analyzes price structure and market behavior to automatically plot key support and resistance levels, eliminating subjectivity and reducing chart noise. The result is a clean, objective, and easy-to-read visualization that adapts to different market conditions. Key Features: Automatic detection of support and
FREE
Haven Fibonacci Volume Profiles — 자동 시장 범위 분석기 Haven Fibonacci Volume Profiles 를 소개합니다. 이는 시장 분석을 한 차원 높여주는 강력한 도구입니다. 이 지표는 중요한 피봇 포인트를 기반으로 구축된 핵심 가격 범위를 자동으로 식별하고, 각 범위에 상세한 볼륨 프로파일과 피보나치 레벨을 겹쳐 표시합니다. 이를 통해 트레이더는 유동성이 어디에 집중되어 있는지, 그리고 진정한 지지 및 저항 레벨이 어디에 위치하는지 즉시 파악할 수 있습니다. 다른 제품 -> 여기 . 어떤 범위가 유효한지 더 이상 추측할 필요가 없습니다. 이 지표는 과거 및 현재 가격 범위를 모두 표시하여 시장 상황에 대한 완전한 이해를 제공하며, 모든 복잡한 작업을 대신 처리해 줍니다. 주요 지표 기능 자동 범위 감지: 지표가 중요한 고점과 저점(피봇)을 자동으로 찾아 그 사이에 가격 범위를 구성합니다. 상세한 볼륨 프로파일: 각 범위에 대해 볼륨 프로파일이

1. Introduction The Market Squeeze Momentum Indicator (SQZMOM_LB) is a powerful technical analysis tool designed to help traders identify periods of low market volatility (the "squeeze" phase) and predict the direction and strength of price momentum after the squeeze ends. This indicator combines the principles of Bollinger Bands and Keltner Channels to detect changes in market volatility, along with a momentum oscillator to measure buying/selling pressure. 2. Key Components of the Indicator The
FREE

Documentation for connecting Metatrader 5 with Python with a simple drag and drop EA.
A full end-to-end solution ,fully tested ,fast and efficient!
The Pytrader ecosystem consists of a python script and a MT5 or MT4 version EA.
Further for the licensing an indicator is used.
The communication between the python script and the EA is based on sockets.
EA is the Server and the python script the Client .
It is always query(function / python script) and output(data / server).
T
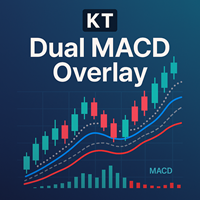
KT Dual MACD Overlay는 현재 시간대와 상위 시간대의 두 MACD 오실레이터를 가격 차트에 직접 겹쳐 표시합니다. 빠른 MACD는 단기 모멘텀을 포착하고, 느린 MACD는 더 큰 추세와의 일관성을 유지합니다. 두 MACD가 캔들 위에 겹쳐 표시되므로 창을 전환하지 않고도 시장 모멘텀을 완벽히 파악할 수 있습니다.
매수 진입
주 매수 진입: 상승 추세가 시작될 때 파란색 세로선이 나타납니다. 추가 매수: 빠른 MACD가 시그널선을 상향 돌파하고, 느린 MACD와 주요 상승 추세가 이를 확인할 때 발생합니다. 매도 진입 주 매도 진입: 하락 추세가 시작될 때 주황색 세로선이 나타납니다. 추가 매도: 빠른 MACD가 시그널선을 하향 돌파하고, 느린 MACD와 주요 하락 추세가 이를 확인할 때 발생합니다.
특징 빠른 MACD와 느린 MACD를 동시에 활용해 단일 MACD보다 완성도 높은 시스템 제공. 추세 시작 지점을 세로선으로 명확하게 표시. 주 진입을 놓쳐도 여러 번

세계 주요 시장의 현재 시간을 표시하는 표시기. 또한 현재 세션을 표시합니다. 사용하기 매우 쉽습니다. 차트에서 많은 공간을 차지하지 않습니다. VirtualTradePad 와 같은 Expert Advisor 및 기타 패널과 함께 사용할 수 있습니다. 클래식 스타일 버전. 친애하는 친구 및 EA 사용자 여러분, 리뷰 섹션에 귀하의 평가를 추가하십시오. Forex 소프트웨어의 모든 업데이트는 무료입니다 ! 이것은 무료 거래 유틸리티입니다! 다른 특징들: 입력 매개변수에 옵션이 있습니다. 버튼 위에 마우스를 놓으면 팁 표시/숨기기, 영어/러시아어 팁 언어를 선택할 수도 있습니다. 닫기 버튼은 응용 프로그램을 중지합니다. 최대화/최소화 버튼은 차트의 창을 축소/확장합니다. 창은 차트에서 이동할 수 있습니다. 이렇게 하려면 창 상단 닫기 및 최소화 버튼 근처를 클릭한 다음 창을 원하는 위치로 이동합니다. Expforex,Vladon,Indicator,Utility
FREE

The Top and Bottom Identifier Pro is the essential tool for traders who use technical analysis and price action as the basis for their decisions. In MetaTrader 5, understanding market structure—whether the price is making higher or lower highs and lower lows—is the first step to success. This indicator automates this process, eliminating subjectivity and allowing you to visualize price inflection points with immediate clarity.
FREE

When prices breakout resistance levels are combined with momentum oscillator breaks out its historical resistance levels then probability emerges to record farther higher prices. It's strongly encouraged to confirm price breakout with oscillator breakout since they have comparable effects to price breaking support and resistance levels; surely, short trades will have the same perception. Concept is based on find swing levels which based on number of bars by each side to confirm peak or trough
FREE

This is an exclusive candlestick closing monitor with audio alerts for the MT5 platform, designed to deliver precise reminders for the closing moments of candlesticks on your specified timeframe. Equipped with a visual global switch, independent dual-mode alerts and real-time data display, it features easy operation and full compatibility with all MT5 trading timeframes. It effectively prevents missing key trading opportunities and serves as a practical auxiliary tool for trading chart monitori
FREE

인디케이터는 차트의 라운드 레벨을 보여줍니다. 심리적, 뱅킹 또는 주요 플레이어 레벨이라고도 합니다. 이 수준에서 황소와 곰 사이에 실제 싸움이 있고 많은 주문이 누적되어 변동성이 증가합니다. 표시기는 모든 악기와 기간에 따라 자동으로 조정됩니다. 80레벨을 돌파하고 테스트를 하면 구매합니다. 20레벨 돌파 후 테스트 하면 판매합니다. 목표는 00입니다. 주목. 강력한 지원 및 저항 수준으로 인해 가격이 00 수준을 약간 놓칠 수 있습니다.
입력 매개변수.
Bars Count - 라인 길이. Show 00 Levels - 00 레벨을 표시하거나 표시하지 않음. Show 10, 90 Levels. Show 20, 80 Levels. Show 30, 70 Levels. Show 40, 60 Levels. Show 50 Levels. N Lines - 차트의 레벨 수를 제한하는 매개변수. Distance 00 Levels - 레벨 사이의 거리(자동 또는 수동). Line Positi
FREE

AllTF Trend Bias Indicator is a professional tool to visualize market bias, designed mainly for 1-minute charts. The colors are not trading signals by themselves, but a visual compass to guide your decision-making: HiddenEdge release model
All HiddenEdge tools follow the same structured release plan.
Each indicator is released initially for free to collect feedback.
After reaching a stable user base, it moves to a fixed paid tier.
Some utilities remain permanently free as part of the Hidde
FREE

Cycle Sniper MT5 Cycle Sniper MT4 Version and definitions : https://www.mql5.com/en/market/product/51950 Important Notes: MT5 Version does not include Breakout Mode and Late Entry Mode Features.
MT5 Version does not include RSI and MFI filter. **Please contact us after your purchase and we will send you the complimentary indicators to complete the system.**
This indicator does not send any signal without a reason...You can observe and analyze the indicator and the signals it sends Cycle Sni

Smart Trend pro New - Advanced Trend Indicator with Interactive GUI Professional trend-following indicator with comprehensive visualization and control panel Key Features: Advanced Trend Detection Reliable Half Trend algorithm for precise trend identification Color-coded trend lines (Blue for bullish, Orange for bearish) Customizable amplitude parameter for different trading styles Interactive GUI Panel Real-time market strength visualization (Bulls vs Bears) Current signal display (Buy/Se
FREE

ATREND: 작동 방식 및 사용 방법 ### 작동 방식 MT5 플랫폼을 위한 "ATREND" 지표는 기술 분석 방법론의 조합을 활용하여 트레이더에게 강력한 매수 및 매도 신호를 제공하도록 설계되었습니다. 이 지표는 주로 변동성 측정을 위해 평균 진폭 범위(ATR)를 활용하며, 잠재적인 시장 움직임을 식별하기 위한 트렌드 탐지 알고리즘과 함께 사용됩니다. 구매 후 메시지를 남기면 특별 보너스 선물을 받게 됩니다. ### 주요 특징: - 동적 트렌드 탐지: 이 지표는 시장 트렌드를 평가하고 신호를 조정하여 트레이더가 현재 시장 상황에 맞춰 전략을 조정할 수 있도록 돕습니다. - 변동성 측정: ATR을 사용하여 시장의 변동성을 측정하며, 이는 최적의 손절매(SL) 및 이익 실현(TP) 수준을 결정하는 데 중요합니다. - 신호 시각화: 이 지표는 차트에 매수 및 매도 신호를 시각적으로 표시하여 트레이더의 의사 결정을 향상시킵니다. ### 운영 단계 #### 입력 및 설정 - TimeFr

Gold TL MTF - this is a fine stock technical indicator. The indicator algorithm analyzes the movement of the asset price and reflects trend lines along the fractals of a specific timeframe (TF).
Benefits of the indicator: The indicator produces signals with high accuracy. The confirmed signal of the indicator does not disappear and is not redrawn. You can trade on the MetaTrader 5 trading platform of any broker. You can trade any assets (currencies, metals, cryptocurrencies, stocks, indices e
FREE

Ritz Smart FIBOPIVOT Optimus Pro Advanced Multi-Timeframe Fibonacci Trading System SMART PREDICTION & ACCURATE FORECAST Revolutionary Fibonacci Pivot Technology combines traditional pivot points with advanced Fibonacci extensions, creating a powerful predictive tool for professional traders.
Our algorithm intelligently detects significant price levels across multiple timeframes, delivering laser-accurate support and resistance zones before the market moves . INTELLIGENT VOLUME-VALIDATED SIGNALS
FREE

실제 팽이 표시기
해머나 도지나 널 캔들스틱과 다른 팽이의 진정한 의미인 균형잡힌 몸체와 심지 높이 비율로 차트에서 정확한 팽이를 감지합니다.
이 지표는 차트에서 발견된 팽이의 수에 날개 아이콘을 표시합니다.
설정에는 다음이 포함됩니다.
Number of Bars : 막대 수에 대한 검색 조정
아이콘 색상 : 아이콘 색상 변경
아이콘 코드 : 아이콘에 대한 wingdings 코드 변경 실제 팽이 표시기
해머나 도지나 널 캔들스틱과 다른 팽이의 진정한 의미인 균형잡힌 몸체와 심지 높이 비율로 차트에서 정확한 팽이를 감지합니다.
이 지표는 차트에서 발견된 팽이의 수에 날개 아이콘을 표시합니다.
설정에는 다음이 포함됩니다.
Number of Bars : 막대 수에 대한 검색 조정
아이콘 색상 : 아이콘 색상 변경
아이콘 코드 : 아이콘에 대한 wingdings 코드 변경
FREE

Global Trading Sessions is a technical indicator for MetaTrader 5 designed to identify and mark the opening times of the four major financial sessions: Tokyo, London, New York, and Sydney . The indicator addresses the common challenge of varying broker server times by utilizing a GMT-based calculation logic . By synchronizing with Global Mean Time (GMT), the indicator ensures that session boundaries are accurately placed regardless of the brokerage platform’s local time zone. This makes it an es
FREE

Price Predictor Pro Turn Market Patterns into Predictable Profits!
Are you tired of guessing where the market will go next? With Price Predictor Pro , you’ll trade with confidence by spotting powerful chart patterns and receiving precise price projections —directly on your MT5 chart.
What Price Predictor Pro Does: ️ Detects high-probability chart patterns like Double Tops, Double Bottoms, Head & Shoulders, Flags, Pennants, and more . ️ Instantly projects the next price target using adv
FREE
바이너리 옵션용 신호 인디케이터로, Forex 및 기타 시장에서도 효과적으로 사용할 수 있습니다. M1–M5 구간의 단기 그리드 트레이딩에 적합하며, 포지션을 단계적으로 늘려 가기 위한 신호를 포함합니다. 무료 버전은 XAUUSD 통화쌍에서만 작동합니다. MetaTrader 5용 전체 버전은 아래에서 확인할 수 있습니다. https://www.mql5.com/en/market/product/156185 인디케이터는 2단계 적응 방식을 사용합니다. 첫 번째는 기본 속도 프로파일(시작 시점부터 “빠르게/부드럽게”를 설정)이고, 두 번째는 거래 결과에 기반한 자동 적응으로, 승리 및 손실 신호의 연속을 고려하여 현재 시장에 맞게 필터를 조정합니다. 모델은 차트에서 짧은 방향성 임펄스를 탐지하고, 바가 마감될 때 CALL(매수) 및 PUT(매도) 화살표로 표시하며, 리페인트는 발생하지 않습니다. 클래식 Forex/CFD 계좌에서도 사용할 수 있지만, 거래 기간이 짧기 때문에 스프레드와 수수
FREE

UT Bot Alerts is a technical indicator for MetaTrader 5 that highlights potential directional changes based on momentum conditions.
The indicator marks signal points directly on the chart and can generate optional notifications for convenience. The signal generation logic can operate in two modes: Closed-bar mode: signals are confirmed only after the bar closes. Live-bar mode: signals are displayed during the formation of the current bar. Both modes are available depending on the user's preferr

This indicator is based on the Parabolic SAR indicator. It helps the user identifying whether to buy or sell. It comes with an alert that will sound whenever a new signal appears. It also features an email facility. Your email address and SMTP Server settings should be specified in the settings window of the "Mailbox" tab in your MetaTrader 5. Blue arrow up = Buy. Red arrow down = Sell. Line = Trailing Stop. You can use one of my Trailing Stop products that automatically move the Stop Loss and i
FREE
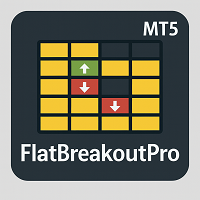
FlatBreakoutPro MT5 Multi-Symbol Flat Panel and Breakout Detector for MT5 FlatBreakoutPro MT5 is a professional tool for modern traders, designed to detect and monitor flat (sideways) zones and instantly react to breakouts across multiple instruments and timeframes. The indicator uses transparent fractal logic, guarantees clear non-repainting signals, and provides full visual control of the market situation. Who Is This Product For? Active traders who prefer breakout trading strategies (range br

For feedback, free connect to signal, PARTNER PROGRAM and detailed information : Facebook Welcome to the "Breakeven Line" indicator, version 1.1, developed by Sergei Ivanov in 2025. Visualize breakeven price levels for your trades with precision and ease. Advisor Description The "Breakeven Line" is a MetaTrader (MQL5) indicator that displays breakeven price levels for open buy and sell positions on the current symbol, factoring in commissions and swaps for accurate risk management. Key
FREE

Megatron Shark Indicator – MT5 Harmonic Pattern Detection Tool The Megatron Shark Indicator is a MetaTrader 5 tool for detecting and displaying Shark harmonic patterns directly on the chart. It automatically identifies bullish and bearish Shark formations, calculates entry, stop-loss, and take-profit levels, and provides real-time alerts. This allows traders to quickly integrate harmonic pattern analysis into their trading process without manual drawing. Advantages * Automatic Pattern Detection
FREE

The indicator has been designed for use on FORTS, but it can also work on other markets, at brokers broadcasting the required data. A peculiarity of these data is that they cannot be requested from the broker's server as a section of history, but can only be obtained for the current moment. The indicator periodically requests the broker, collects to a file and displays the following history from the stored file: The weighted average price. The volume of buy pending orders. The volume of sell pen
FREE

RiskKILLER_AI Navigator는 AI 기반의 다중 시간대 시장 방향 및 전략 어시스턴트입니다. 트레이딩 성과는 프로처럼 시장을 이해하는 데 있습니다. 그것이 바로 RiskKILLER_AI Navigator 가 제공하는 것입니다: MQL5 외부 에서 작동하는 AI 기반 트렌드, 심리, 거시 분석을 통해 여러분의 트레이딩 스타일에 맞춰진 기관 수준의 인사이트를 얻으세요. 구매 후 사용자 설명서를 받으려면: 1. 설명서를 요청하는 댓글 을 게시 2. 저에게 쪽지 를 보내주세요. [ 전용 그룹 | 버전 MT5 - MT4 ]
핵심 이점 여러 시간대와 자산에 걸친 실시간 시장 방향 거시 지표, 뉴스, 심리에 대한 AI 기반 분석 여러분의 트레이딩 스타일(수동 또는 자동)에 기반한 맞춤형 조언 RiskKILLER_AI Expert Advisor (EA)와의 직접적인 시너지
주요 기능 AI 기반 글로벌 트렌드 대시보드 - 주요 FX 쌍과 BTCUSD에 대해 M1부터 D1까지의 시장

FlagTrendTF Free Indicator for MetaTrader 5 FlagTrendTF is a free MetaTrader 5 indicator designed to help traders identify market trends across multiple timeframes quickly and visually. It is ideal for confirming whether the market direction is aligned from higher timeframes down to the trading timeframe. How FlagTrendTF Works The indicator allows you to monitor up to 4 timeframes simultaneously , displaying easy-to-read arrows: Green arrow : bullish trend Red arrow : bearish trend This fa
FREE

Quick Start Guide - Supply & Demand Smart Signals Installation (5 Minutes) Step 1: Install the Indicator Open MetaTrader 5 Click File → Open Data Folder Navigate to MQL5 → Indicators Copy SupplyDemand_CleanSignals.mq5 into this folder Restart MT5 or press Refresh in Navigator Step 2: Add to Chart Open your desired chart (any symbol, any timeframe) In Navigator panel, find Indicators → Custom Double-click SupplyDemand_CleanSignals Click OK (default settings work great) Step 3: You're Ready! Blue

Easy Correlations Indicator The Easy Correlations Indicator is designed to help traders analyze the relationship between two correlated instruments. By monitoring the distance between their Relative Strength Index (RSI) values, the indicator highlights situations where one instrument has moved significantly further than the other. This creates potential trading opportunities: Sell the stronger instrument (overstretched RSI) Buy the weaker instrument (lagging RSI) Because the positions are opened
FREE

속도를 위해 약간 변경되었습니다. 테스터는 이메일로 나에게 쓰기,관심이 새로운 고문이 필요합니다 777basil@mail.ru
https://backoffice.aurum.foundation/u/DHXP1U
표시기는 역사의 가격 변화를 기반으로 계산되며 수학적으로 계산되며 데이터가 다시 수신 될 때마다 다시 계산됩니다. 그것은 다른 시간대에 사용할 수 있습니다. 70%의 지표의 경계에서 가격 이동 또는 통합 방향의 변화가 있습니다. 이 방법으로,당신은 추세와 국경에서 채널의 중간에 보트를 거래 할 수 있습니다. 저항/지원 수준을 결정하기 위해 추세 거래에서 사용하는 것이 좋습니다. 비디오에서 표시기가 어떻게 작동하는지 확인할 수 있습니다:
https://youtu.be/UG2ZZEH9B_U
통신 연락처 777basil@mail.ru 우리는 당신의 작업에 대한 지표 인 전문가를 준비 할 것입니다.
FREE

Trend Fuzzy Analyzer Purpose and Concept
The Trend Fuzzy Analyzer indicator assesses the strength and direction of the current market trend. It is based on the principle of Fuzzy Logic , which transforms quantitative readings from several standard technical indicators into a qualitative assessment of trend strength. Unlike binary signals, the indicator outputs a final value as a confidence level (from 0 to 100%). Core Working Principle The indicator simultaneously analyzes input data from f
FREE
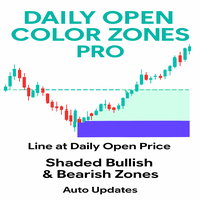
This indicator is a professional tool designed to plot the Daily Open Line and instantly shade the bullish and bearish price zones around it. Instead of leaving traders guessing, it delivers a clear visual map of market sentiment from the very first of the day. Its goal: to help you instantly identify whether the market is trading above or below the daily open — a key reference point for intraday strategies.
The indicator automatically draws a horizontal line at the daily open price and shades
FREE

넥스트 바 카운트다운은 MetaTrader 5용 고정밀 고성능 시간 지표로, 트레이더에게 현재 캔들 마감까지 남은 시간을 표시하도록 특별히 설계되었습니다. 정확한 타이밍은 특히 새 캔들이 열릴 때 즉시 결정을 내려야 하는 경우 많은 거래 전략에 결정적입니다.
주요 기능: 이 지표는 표준 타이머를 뛰어넘는 다양한 기능을 제공합니다: 이중 시간대 표시: 현재 차트 시간대와 두 번째 자유롭게 선택 가능한 시간대(예: H4 또는 일간)의 카운트다운을 동시에 표시할 수 있습니다. 안티 래그 기술: 서버 시간과 로컬 시스템 시간 간의 지능형 동기화를 통해 타이머가 완벽하게 부드럽게 작동합니다. 시장 변동성이 낮거나 주말에 틱이 수신되지 않더라도 초를 건너뛰지 않습니다. 개별 맞춤 설정: 글꼴, 크기 및 차트 상의 위치는 사용자의 차트 설정에 완전히 맞게 조정할 수 있습니다. 시각적 경고 신호: 지표는 캔들 마감 직전 마지막 몇 초 동안 카운트다운 색상을 변경하여 사용자의 주의를 제때 끌 수
FREE

Pi Cycle Projections란 무엇인가요? Pi Cycle Projections는 MetaTrader 5용으로 개발된 완벽한 트레이딩 시스템으로, 두 가지 이점을 제공합니다. 현재 시장에서 높은 확률의 진입 신호 (이동 평균선 교차)를 식별할 뿐만 아니라, 시장의 미래 시나리오를 시각적으로 보여주는 지도를 그립니다. 이것을 2-in-1 시스템으로 생각해보세요. 언제 행동해야 할지를 알려주는 스마트 신호 생성기 (Pi 이동 평균선 교차). 가격이 어디로 향할 수 있는지를 보여주는 전략적 사이클 예측기 . 두 기능 모두 강력한 "Pi" 사이클 개념을 기반으로 하지만, 노이즈를 줄이기 위해 여러 선택적 필터 로 강화되었습니다 (이 필터를 활성화하면 조건 중 하나를 충족하지 못할 경우 예측선이 사라집니다). 구성 요소 1: Pi 이동 평균선 교차 신호 생성기 ("현재") 일반적으로 Pi 신호는 이동 평균선 교차 시에 생성됩니다. 그러나 이 지표는 매수 또는 매도 화살표를 거의 생성
FREE

WYSIWYG OPEN RANGE BREAKOUT - PRO EDITION
Ultra-precise ORB indicator with smart line-breaking, dynamic ATR-based targets, and multi-session adaptability. Perfect for day, swing, and algorithmic traders seeking clear visuals and actionable levels . Trade with confidence – see what you trade, trade what you see . "What You See Is What You Get" "What You See Is What You Get" – The ultimate ORB indicator delivering ultra-precise trading range visualization with a smart line-breaking system.

What is VWAP? The Volume Weighted Average Price (VWAP) is a trading benchmark that reflects the average price of a security, weighted by volume, over a specific time period. It helps traders identify fair value and is used widely in intraday trading to assess price action relative to institutional trading levels. Key Features of Anchored VWAP PRO Anchored Calculation : Unlike traditional VWAP that resets daily, your indicator allows users to anchor VWAP to specific time frames or key points (e.g

우리의 Basic Support and Resistance 표시기는 기술 분석을 향상시키는 데 필요한 솔루션입니다.이 표시기는 차트/ MT4 버전
특징
피보나치 수준의 통합 : 지원 및 저항 수준과 함께 피보나치 수준을 표시하는 옵션과 함께, 우리의 지표는 시장 행동과 가능한 역전 영역에 대한 더 깊은 통찰력을 제공합니다.
성능 최적화 : 각 막대의 개구부에서만 확장 라인을 업데이트하는 옵션을 사용하여, 우리의 지표는 지원 및 저항 수준의 정확도를 희생하지 않고 최적의 성능을 보장합니다.
입력 주요 설정 Timeframe: 이 입력을 통해 차트에 더 높은 기간의 지지선과 저항선을 표시하도록 선택할 수 있습니다. Support/Resistance Strength [Number of Bars]: 이 입력을 사용하면 지지대와 저항의 강도를 결정할 수 있습니다.숫자가 높을수록지지/저항이 더 강해집니다. Price mode: 이 매개 변수를 사용하면 지원 및 저항 수준을
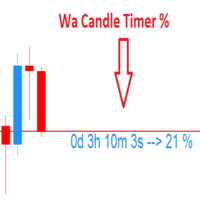
Wa Candle Timer Percentage MT5 is an indicator which shows the user how much time is remaining until the next candle will form. The percentage of the evolution of the current candle is also displayed. The user can set the percentage that the candle timer will change the color. These are the settings: 1- The percentage that the candle timer will change the color. 2- Color of Candle Timer when it's BELOW the percentage set by the user. 3- Color of Candle Timer when it's ABOVE the percentage set b
FREE

The Bull DCA DowJones Signal – Premium Trend & Swing Indicator (WinWiFi Robot Series) Overview: Unlock the full potential of Index trading with the latest innovation from the WinWiFi Robot Series . "The Bull DCA DowJones Signal" is a precision-engineered indicator designed to conquer global Indices, Energy, and Forex markets. Optimized for the H4 Timeframe , this tool filters out market noise and delivers clear, actionable signals for Trend Following, Breakouts, and Pullbacks.
Key Features & S
FREE

Mahdad Candle Timer 는 가볍고 정밀한 MetaTrader 5용 지표로, 현재 캔들이 마감될 때까지 남은 시간을 최신 봉 옆에 실시간으로 표시합니다. 스캘핑, 데이 트레이딩, 또는 스윙 트레이딩에서 캔들 확정을 기다리는 등 정확한 타이밍을 중시하는 트레이더에게 적합합니다. 주요 기능 정확한 카운트다운 – HH:MM:SS 형식으로 남은 시간 표시 (옵션: 밀리초) 동적 위치 조정 – 차트 확대/축소와 관계없이 항상 최신 캔들과 정렬 스마트 색상 적응 – 배경 및 캔들 방향(상승/하락)에 따라 텍스트 색상 자동 변경 사용자 알림 – 캔들 마감 X초 전에 사운드 또는 팝업 알림 제공 완전한 사용자 설정 – 글꼴, 크기, 색상, 새로고침 속도, 알람 설정 가능 가볍고 효율적 – CPU 사용 최소화, 다른 지표나 EA와 충돌 없음 ️ 입력 파라미터 Sow Milliseconds (true/false) Update Interval (ms) Bullish/Bearish C
FREE
MetaTrader 마켓은 거래 로봇과 기술 지표들의 독특한 스토어입니다.
MQL5.community 사용자 메모를 읽어보셔서 트레이더들에게 제공하는 고유한 서비스(거래 시그널 복사, 프리랜서가 개발한 맞춤형 애플리케이션, 결제 시스템 및 MQL5 클라우드 네트워크를 통한 자동 결제)에 대해 자세히 알아보십시오.
트레이딩 기회를 놓치고 있어요:
- 무료 트레이딩 앱
- 복사용 8,000 이상의 시그널
- 금융 시장 개척을 위한 경제 뉴스
등록
로그인
계정이 없으시면, 가입하십시오
MQL5.com 웹사이트에 로그인을 하기 위해 쿠키를 허용하십시오.
브라우저에서 필요한 설정을 활성화하시지 않으면, 로그인할 수 없습니다.