适用于MetaTrader 5的技术指标 - 26

A simple volume indicator according to the color of the candle!
- Custom background!
- Supports Volume by Ticks or Real Volume.
The original Metatrader Volume indicator does not show the colors of the bar according to the color of the Candle, it only changes color when the volume of a candle is greater than the previous one, this sometimes creates confusion for beginners and does not know the real reason for the color change.
Free indicator, support may take a while to respond!
FREE

RiskKILLER_AI Navigator 是一款基于人工智能的多时间框架市场方向与策略助手。 交易表现的关键在于像专业人士一样理解市场。这正是 RiskKILLER_AI Navigator 所提供的: 通过 AI 驱动的趋势、情绪和宏观分析( 独立于 MQL5 ),获得机构级别的洞察,并适应您的交易风格。 购买后,如需获取用户手册,请:1. 发布一条 评论 索要 2. 给我发送 私信 。 [ 专属群组 | MT5 版本 - MT4 版本 ]
核心优势 跨多个时间框架和资产的实时市场方向 AI 驱动的宏观指标、新闻和情绪分析 根据您的交易风格(手动或自动)提供定制建议 与 RiskKILLER_AI 专家顾问 (EA) 直接协同工作
主要特性 AI 驱动的全球趋势仪表板 - 即时查看 M1 到 D1 时间框架下主要外汇货币对和 BTCUSD 的市场偏向(盘整、看涨、看跌)。 策略感知型 AI 助手 - RiskKILLER_AI Navigator 适应您的策略并突出机会: 马丁格尔 / 网格 / 均价定投 (DCA) - 提示风险和波动性陷阱 均值回归 - 识别有利的盘整条

Clock GMT Live 拥有您需要了解的有关我们经纪人的所有信息,很多时候您会想知道我现在的格林威治标准时间或我的经纪人正在处理什么格林威治标准时间,使用此工具您将能够实时了解格林威治标准时间和格林威治标准时间 经纪人和你当地时间的时间偏移,你也会不断地知道经纪人的 ping 只需将它放在一天中的某个时间,您就可以获得信息
每次收购价格都会上涨,我们将以此来保护,这样很少有人可以拥有我独特的策略 我的其他开发可以在这里查看
准确的时机可能是交易中的一个关键因素。 目前,伦敦或纽约证券交易所是否已经开市或仍处于关闭状态? 外汇交易的营业时间何时开始和结束? 对于手动交易和实时交易的交易者来说,这不是什么大问题。 使用各种互联网工具、金融工具的规格和时间本身,您可以快速了解何时是根据自己的策略进行交易的正确时间。 对于一些只关注价格走势并在价格走势向他们发出信号时进行买卖的交易者而言,时间本身并不重要。 对于在纽约(股票)市场收盘后和欧盟(股票)市场开盘前进行“夜间剥头皮”交易的交易者,或者专门在“伦敦休市”或其他时间进行交易的交易者而言,情况有所不同 最忙的时候,还是所有买卖
FREE

True TrendLines MT5 - Smart Trend Detection & Alerts Overview True TrendLines MT5 is a professional-grade technical analysis tool that automatically identifies and plots high-probability trend lines on your MetaTrader 5 charts. Using a sophisticated swing point detection algorithm, it helps traders visualize key market structure and potential reversal points with precision. Key Features Automatic Trend Line Detection Identifies valid swing highs and lows based on your chosen strength paramet
FREE
TW Volume Signal Pro MT5 利用先进的人工智能技术和专有智能算法,让您在黄金市场中交易更有信心,带来独特且无与伦比的交易体验。
您是否正在寻找高精度和卓越的黄金市场交易信号?
通过 TW Volume Signal Pro MT5,您可以成为专业交易者,并在黄金市场取得巨大成功。立即免费试用!
TW Volume Signal Pro MT5 的主要特点: 精准信号,固定止盈和止损 快速识别市场趋势变化 实时进出场提醒 三重利润目标的风险管理 安全区域自动止损 完全可调和自定义 在图表旁显示信号历史 在黄金和外汇市场表现出色 适合剥头皮交易者(M5 和 M15) 可在策略测试器中测试
为何选择此产品?
高准确性:精确且固定的信号 易用性:简洁友好的界面 灵活性:可自定义设置,兼容您的个人策略 可测试性:可以回测并精确计算盈利 购买此产品可获得价值 $37 的赠品。 要了解如何设置该产品,请阅读此文章。
https://www.mql5.com/en/blogs/post/759779 我们的客服团队随时为您解答!
Koryu Delta Koryu Delta 是一款 MetaTrader 5 指标。它利用枢轴点分析和 Delta 交易量数据来识别趋势反转点。它可以检测市场变化形态,并根据市场动态显示信号。此工具可供剥头皮交易、波段交易或长期投资的交易者使用。它可以分析多达 500 条历史K线图来发现过去的形态。它使用闭合K线图逻辑来发出信号。 Koryu Delta 的功能
形态检测:它使用枢轴点分析来识别看涨和看跌的市场变化形态。 Delta 交易量分析:它使用逐笔成交量和K线图结构来显示买入和卖出压力。Delta 显示可以调整。它通过检查形态范围内每根K线图的实体大小、灯芯比和逐笔成交量来计算 Delta。 支撑位绘制:它为检测到的形态绘制支撑位,包括入场位、止损位 (SL) 和三个止盈位 (TP)。可以为每个支撑位设置风险回报率。入场和止损的偏移量可以点数调整。 视觉元素:它使用三角形、支撑位和标签标记形态。它使用圆圈和线条突出显示枢轴点和形态边界。 信号选项:用户可以选择显示看涨信号、看跌信号或两者兼有。 警报:它会发送新形态的推送通知和弹出警报,其中包含入场、止损、止盈位和增量交
FREE

交易实用必备工具指标 波浪自动计算指标,通道趋势交易 完美的趋势-波浪自动计算通道计算 , MT4版本 完美的趋势-波浪自动计算通道计算 , MT5版本 本地跟单复制交易 Easy And Fast Copy , MT4版本 Easy And Fast Copy , MT5版本 本地跟单复制交易 模拟试用 Easy And Fast Copy , MT4 模拟账号运行 Easy And Fast Copy , MT5 模拟账号运行 Fibo: 来源于KTrade 1.自动计算分析波段.->得出所需波段 2.画出斐波那契 回撤线,以及扩展线作为参考 指标波段分析如何得来->请参考如下 波段分析来源于波浪分析指标↓↓↓ 波浪自动计算指标,通道趋势交易 完美的趋势-波浪自动计算通道计算 , MT4版本 完美的趋势-波浪自动计算通道计算 , MT5版本
FREE

The indicator displays divergence for any custom indicator. You only need to specify the indicator name; DeMarker is used by default. Additionally, you can opt for smoothing of values of the selected indicator and set levels whose crossing will trigger an alert. The custom indicator must be compiled (a file with ex5 extension) and located under MQL5/Indicators of the client terminal or in one of the subdirectories. It uses zero bar of the selected indicator with default parameters.
Input parame
FREE

我们的 Basic Support and Resistance 指示器是提高技术分析所需的解决方案。该指标允许您在图表/ MT4版本
功能
斐波那契水平的集成: 可以选择显示斐波那契水平以及支持和阻力水平,我们的指标使您对市场行为和可能的逆转区域有更深入的了解。
性能优化: 只能在每个栏的打开时更新扩展线,我们的指标可确保最佳性能,而无需牺牲支持和阻力级别的准确性。
输入 主设置 Timeframe: 通过此输入,您可以选择在图表上显示较高时间范围的支撑线和阻力线。 Support/Resistance Strength [Number of Bars]: 使用此输入,您可以确定支撑和电阻的强度。数量越高,支持/阻力越强。 Price mode: 此参数允许您选择哪种价格将用于计算支持和电阻水平。它可以是收盘价,最高价格,最低价格等。取决于您的策略和偏好,您可以选择最适合您需求的价格。 显示设置 Display Fibonacci levels: 此参数确定是否将显示斐波那契水平以及图表上的支持和电阻级别。斐波那契水平是技术分析中使用的关键水平,并使用斐

If you love this indicator, please leave a positive rating and comment, it will be a source of motivation to help me create more products <3 How to use Slope Direction Line Uptrend: When the SDL line slopes up and turns from red to green, it shows that the price is trending up. This is also considered a buy signal. Downtrend: When the SDL line slopes down and turns from green to red, it shows that the price is trending down. This is also considered a sell signal. Sideways: When the SDL line mo
FREE

Hidden Edge – High-Low PreUS High-Low PreUS is a clean and lightweight indicator that marks key reference levels before the US session begins.
It draws a session box from 00:01 to 09:00 CET, identifying the high and low of the Asian session, and includes additional reference elements to support structured intraday trading decisions. Features Draws a rectangular range from 00:01 to 09:00 CET Marks the high and low of the session clearly Plots a horizontal yellow line as a suggested stop level bas
FREE

My Fibonacci MT5 An automated Fibonacci indicator for MetaTrader 5 that combines ZigZag swing detection with comprehensive Expert Advisor integration through a 20-buffer system. More details about data specification and EA integration: https://www.mql5.com/en/blogs/post/764114 Core Features Automated Fibonacci Detection The indicator identifies swing points using configurable ZigZag parameters and draws Fibonacci retracements and extensions automatically. It updates levels as new swing formatio
FREE

The indicator shows the current timeframe and symbol name. It is also possible to turn on the indication of time until the end of the current bar. In the settings, you can specify: - the location of the indicator in relation to the terminal window, top left, top right, bottom left and bottom right - a row of text display arrangements so that the inscriptions do not overlap each other - color - font - font size.
FREE

This indicator marks the 50% mark of each candle. It will help you make profitable scalping trades. If the next candle opens above the 50% mark of the previous candle, you should open a BUY position, and if the next candle opens below the 50% mark of the previous candle, you should open a SELL position. This strategy is very profitable. To make the most of it, keep an eye on the candle contexts on the left. Good luck!
FREE

Cybertrade ATR Trend Zone - MT5 The indicator shows, by calculating the ATR (Average True Range), the zone of probable price resistance. Indicated to be used as a probable exit point of an operation.
It works on periods longer than the period visible on the chart. All values are available in the form of buffers to simplify possible automations. This indicator is the same one we use in our EA. Also check out our other products.
FREE

[ How to use the Demo version ] [ MT4 Version ] AO unpaid divergences MT5 AO unpaid divergences is the first indicator developed to detailed analyze Regular and Hidden Divergences. It uses this analysis to find out possible entry points and targets. Below some of the characteristics of this indicator: Time saving Highly customizable Working for all pairs (Crypto, Forex, Stocks, Indices, Commodities...) Suitable for Scalping or Swing trading Possible reversal swings Alerts and Notifications on M

Trading Dashboard Pro: MetaTrader 5 专业交易指挥中心 将您的 MT5 终端升级为机构级交易工作站 Trading Dashboard Pro (交易仪表板专业版) 是专为职业交易员、自营公司(Prop Firm)挑战者和严肃的剥头皮交易者设计的综合风险管理和账户分析工具。通过将关键的市场数据、账户健康指标和历史绩效整合到一个优雅的界面中,它让您可以专注于最重要的事情:做出正确的交易决策。 为什么您需要这个仪表板? 1. 专为自营公司交易员设计 (FTMO, MFF 等)
自营交易公司对 每日回撤 (Daily Drawdown) 和 最大回撤 (Max Drawdown) 有极其严格的规则。
解决方案: 我们的仪表板专门跟踪并显示当前日和当前月的 Max DD (最大回撤)。您将立即知道您距离每日亏损限制还有多远,从而帮助您避免违规爆仓。 2. 专为剥头皮和日内交易者设计
当您在几分钟内频繁进出市场时,您没有时间切换到“历史”选项卡并手动汇总利润。
解决方案: “每日交易分析”部分即时更新,让您一目了然地看到“今天”

Smart Trend pro New - Advanced Trend Indicator with Interactive GUI Professional trend-following indicator with comprehensive visualization and control panel Key Features: Advanced Trend Detection Reliable Half Trend algorithm for precise trend identification Color-coded trend lines (Blue for bullish, Orange for bearish) Customizable amplitude parameter for different trading styles Interactive GUI Panel Real-time market strength visualization (Bulls vs Bears) Current signal display (Buy/Se
FREE

This indicator is based on Bollinger Bands and moving averages, and uses ADX to get the turning point of the market trend and display a sign.
It is basically intended for use with currency pairs and futures with high volatility. In our tests we use it on XAUUSD, 5m and 15m. Win rate is more than 80% with 50 pips stop loss and 50 pips gain or more.
The indicator is also a simple indicator that allows you to enable or disable alerts and change the color of the arrows from the indicator settings
FREE
FOTSI – 外汇真实强度指数概览 发现每种货币的真实力量,并利用优势交易。 FOTSI 指标 是一种 多货币振荡器 ,用于测量每种主要货币(USD, EUR, GBP, JPY, CHF, AUD, CAD, NZD)在所有货币对中的真实动量。 FOTSI 不仅分析单一图表,而是整合多个货币对的数据,平滑价格波动,并应用 True Strength Index (TSI) 算法,为您提供清晰、稳定且无延迟的各货币相对强度视图。 主要特征 多货币振荡器: 独立衡量每种货币的强弱。 超买和超卖水平: +50 → 货币超买(高概率回调)。 –50 → 货币超卖。 ±25 → 中性区。 简单易懂: 曲线在零之上或之下 = 强/弱。 无重绘: 所有计算实时进行并保持稳定。 适用于任何货币对和时间周期: 建议在 H1, H4 和 D1 使用以提高可靠性。 如何使用? 反转策略: 当货币达到 +50 或 –50 极值时寻找反转机会。 入场确认: 结合价格行为或支撑/阻力位使用。 选择最强/最弱货币对: 基于最强货币对最弱货币进行交易。 实用示例 如果 USD 为 +60(超买)且 EUR 为 –

Gatotkaca Support Resistance Trendline Indicator is a simple indicator that detects support, resistance and trendlines. It will helps you find breakout momentum based on lines calculated by this indicator. This is conceptually based on fractals, but with customizable periods. Compatible for any timeframes. You can customize how this indicator work by setting up the period input.
FREE

This indicator is a volume indicator it changes the color of the candles according to a certain number of ticks, and this number of ticks can be informed by the user both the number of ticks and the color of the candles, this indicator works in any graphical time or any asset, provided that the asset has a ticker number to be informed.
This indicator seeks to facilitate user viewing when analyzing candles with a certain number of ticks.
FREE
Advanced UT BOT ALERTS for MT5 專業多重濾波趨勢識別系統|強化版 UT BOT 引擎 我們只提供高品質的指標。 Advanced UT BOT 為專業交易者設計,採用穩定的信號邏輯與安全運算結構,確保無延遲與錯誤更新。
它 不會重繪、不會重畫、不會刪除或修改 任何過去的信號。
所有 BUY 和 SELL 信號均在 K 線收盤後生成並固定 ,確保穩定性與準確性。
在即時行情中 不會重繪 ,信號會在收盤後即時出現。
限時優惠中 —— 下一次價格將調整為 49 美元。
請把握現在的優惠價格,售完即漲。 產品概述 Advanced UT BOT ALERTS 是新一代的趨勢信號系統,基於 UT BOT 的核心邏輯重新打造,
全面升級為 MT5 版本,融合多重濾波、動態視覺化與高精度警報系統。
UT Bot 指標最初由 Yo_adriiiiaan 開發,本版本由 PioneerAlgoFX 團隊深度強化,
在穩定性、精準度與自訂性方面均達到專業級水準,為實戰交易者而設計。 此系統能夠高精準地識別趨勢反轉與動能變化,
透過多層動態濾波與即時資訊面板輸出 高勝率信號

For those who love to follow Volume behavior here it is a little indicator that could be used as a replacement for the old and standard MT5 built-in volume indicator. The trick here is that this indicator paints the volume histogram based on the direction of the candle giving to the trader a quick "Heads Up" on what is happening, visually! It could be used to study and see for instance, the volume and past bars volume during (or, reaching) a peak (Tops and Bottoms). UP candles are shown in pale
FREE

All traders should know the trend before making their decision when placing the buy or sell orders. The first step always starts with supply and demand , rising and falling channels , trend lines, engulfing candles etc. All the above contribute to what is called “Price Action” and that is the best and most reliable way in trading and catching the trend and making profits, without stress. The Investment Castle Trend Line Indicator will automatically draw the trend lines on the MT5 for you.
FREE

Indicator Name: CM EMA Trend Bars Overview: The CM EMA Trend Bars indicator is a straightforward yet effective tool that changes the color of price bars based on their relationship to the Exponential Moving Average (EMA). This visual cue helps traders quickly identify trend direction and potential trading opportunities. Key Features: Dynamic Bar Coloring: The indicator changes the color of the bars depending on whether they are above or below the EMA, providing a clear visual representation of t
FREE

The indicator IQuantum shows trading signals for 10 symbols in the daily chart: AUDCAD, AUDUSD, EURUSD, GBPCAD, GBPCHF, GBPUSD, NZDUSD, USDCAD, USDCHF, and USDJPY.
Signals of the indicator are produced by 2 neural models which were trained independently from one another. The inputs for the neural models are normalised prices of the symbols, as well as prices of Gold, Silver and markers of the current day.
Each neural model was trained in 2 ways. The Ultimate mode is an overfitted neural model
FREE

Friend of the Trend: Your Trend Tracker Master the market with Friend of the Trend , the indicator that simplifies trend analysis and helps you identify the best moments to buy, sell, or wait. With an intuitive and visually striking design, Friend of the Trend analyzes price movements and delivers signals through a colorful histogram: Green Bars : Signal an uptrend, indicating buying opportunities. Red Bars : Alert to a downtrend, suggesting potential selling points. Orange Bars : Represent cons
FREE
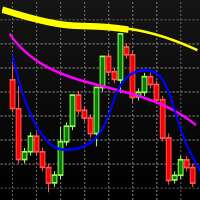
Baseado no indicador MIMA SAR, que é uma combinação dos indicadores MIMA Consolidação e MIMA Tendência, da metodologia Phicube. O indicador é composto pelos 8 fractais, 17,34.72.144.305,610.1292,2554. Sendo a tendência indicada pelas linhas finas e a consolidação pelas linhas mais espessas. Para usar o indicador de maneira adequada deve-se partir do princípio de que tudo na natureza segue o caminho que oferece menor resistência. Isso significa que para uma reversão da tendência ocorrer nesse mod
FREE

"Envelope of Adaptive Moving Average" 指标是一种帮助您在金融市场做出明智决策的工具。它旨在为您提供清晰的趋势方向以及交易中可能的入场和出场点。
该指标基于自适应移动平均,这意味着它会自动调整以适应市场波动性的变化。这使其在既可能平静又可能波动的市场中特别有用。该指标显示两条包围自适应移动平均线的线条。这些线条有助于识别关键的支撑和阻力水平,从而使您更明智地决定何时买入或卖出资产。
尽管它是一种高级技术工具,但易于理解和使用,适用于新手和经验丰富的交易者。该指标能够适应不断变化的市场条件,使其在各种情况下都具备灵活性和有效性。它提供了市场趋势的清晰视觉表现,有助于避免冲动交易。该指标可以成为您交易工具箱中宝贵的工具。
FREE
Multitimeframe Viewer HiddenEdge – HTF Realtime MiniChart A clear view of higher-timeframe structure — directly inside your main chart.
No need to switch timeframes anymore. HiddenEdge Multitimeframe Viewer shows the last candles of any higher timeframe in a compact, real-time panel — so you can see the bigger picture while staying focused on execution. Key Features Realtime update: the current higher-timeframe candle is drawn live, updating every second. Select how many candles to display:
FREE

头皮交易者的 VWAP
会话感知的 VWAP 线,用于快速、精确的头皮交易。 ️ 输入参数(MT4/MT5) Enable_Hourly_VWAP: 启用小时 VWAP。 Enable_Asia_VWAP: 启用亚洲会话 VWAP。 Enable_Europe_VWAP: 启用欧洲会话 VWAP。 Enable_NA_VWAP: 启用北美会话 VWAP。 Enable_Extended_VWAP: 启用扩展会话 VWAP。 Enable_Daily_VWAP: 启用每日 VWAP。 亚洲会话(GMT) Session_Asia_Start_Hour: 亚洲会话开始时间。 Session_Asia_End_Hour: 亚洲会话结束时间。 欧洲会话(GMT) Session_Europe_Start_Hour: 欧洲会话开始时间。 Session_Europe_End_Hour: 欧洲会话结束时间。 北美会话(GMT) Session_NA_Start_Hour: 北美会话开始时间。 Session_NA_End_Hour: 北美会话结束时间。 它的功能 绘制小时、会话(亚洲/欧
FREE

Volume Gives Depth To Price Action! Volume Critical can accurately locate the cheapest areas to place trades. Enter reversals as early as possible to get the best Risk Reward setups!
Features Aggressive algorithm that anticipates reversals Volume Classifications Gray Histograms - Normal Volume, average market activity Orange Histogram - Trending Volume, increased market activity Pink Histograms - Overbought Volume, we can wait for further confirmation to sell Blue Histograms - Oversold Conditio
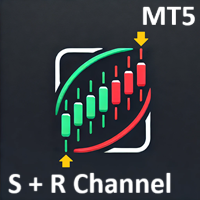
Support Resistance Channel MT5 The Support Resistance Channel MT5 indicator plots dynamic support and resistance levels based on a configurable lookback period, displaying them as green and red lines respectively. It optionally shows goldenrod-colored arrows when price touches these levels, indicating potential trend changes (not explicit buy/sell signals) , along with customizable "RES" and "SUP" labels. With adjustable parameters like lookback period, arrow size, and label offset, it offers t
FREE

A price increase indicator calculates range and price changes in percent. It is very useful when you look at the chart.
It helps you make decisions to open deals when the price is at the lowest level do not open sell deals and open buy deals and when it is at the highest level do not open buy deals open sell deals, it is not an entry signal for deals but to know the lowest and highest price that will reach in an hour or four hours a day or a week or a month as a whole for the period
FREE

LogVar 指标是一种专门用于计算并显示 价格对数变化率 的专业分析工具。与传统的线性百分比变化不同,对数变化能更真实地反映价格波动的强度与方向,尤其在高波动或长期趋势分析中更具稳定性与可比性。 该指标通过比较当前收盘价与 n 个周期前的收盘价(由参数 iPeriod 定义)来计算变化值,并在放大的对数刻度上绘制出来,使趋势的微小变化也能清晰呈现。 线条颜色根据价格方向自动变化: 绿色: 当前价格高于参考值,表示上涨趋势; 红色: 当前价格低于参考值,表示下跌趋势。 中心的 0 线 表示中性区域,直观地区分价格变化的正负方向。 主要特性: 精确测量 真实的对数变化率 ; 自动调整刻度比例,增强视觉可读性; 动态颜色变化,清晰区分市场方向; 中心零线,提供直观趋势基准; 轻量快速,适用于所有交易品种和周期。 推荐用途:
适用于识别 趋势反转 、测量 波动强度 、过滤虚假信号或作为 量化交易系统的基础组件 。在算法交易、量化研究及自动化系统中表现尤为出色。
FREE
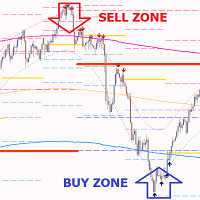
Gold PL MTF - 這是一項優秀的股票技術指標。指標演算法分析資產價格的走勢,並使用斐波那契方法(黃金分割)自動反映指定時間範圍(TF)的重要樞軸水準。
此指標完美地描述所選時間範圍(日、週、月、年)的價格軌跡,確定趨勢的開始和修正的開始,並可能發展為相反的趨勢。
此指標也顯示不同時間範圍內目前未使用的樞軸水平,作為價格磁鐵。這使得您能夠快速評估市場狀況並做出進入和/或退出交易的決定。每筆交易的潛力平均為50至1000點。
此指標可讓您評估不同時間範圍內價格變動的可能方向,並顯示最可能的目標和價格變動的潛力。
指標的優點: 1. 指標產生高精度訊號。 2. 樞軸水平不會消失,也不會重新繪製。只有當趨勢強勁時,FP 緩衝區的確認箭頭訊號才能重建。 3.您可以在任何經紀商的MetaTrader 5交易平台上進行交易。 4. 您可以交易任何資產(貨幣、金屬、加密貨幣、股票、指數等)。 5. 建議中長期交易的時間範圍為 H1-H4。 6. 可以在指標設定中更改單獨的參數(TF,顏色等),以便每個交易者可以輕鬆地為自己自訂指標。 7. 此指標可作為您交易系統的優秀主要補充,也可
FULL VERSION https://www.mql5.com/en/market/product/145203?source=Site https://www.mql5.com/en/users/gedeegi/seller
GEN TurboTrend Signals is an adaptive volatility-based trend indicator designed to help traders identify dominant trend directions, key momentum transition points, and projected profit-taking zones in a visual and intuitive manner. The indicator utilizes a temporally-weighted moving average combined with statistical dispersion via standard deviation to construct a dynamic volati
FREE

带有 MT5 警报的自动固定范围交易量配置文件
该指标显示价格花费更多时间的位置,突出可用于交易的重要水平。
并且可以显示随时间变化的价格密度,概述给定交易时段最重要的价格水平、价值区域和控制价值。 该指标可以附加到 M1 和 D1 之间的时间范围,并将显示每日、每周、每月甚至日内时段的市场概况。 较低的时间范围提供更高的精度。 建议使用更高的时间范围以获得更好的可见性。 还可以使用自由绘制的矩形会话在任何时间范围内创建自定义市场概况。 六种不同的配色方案可用于绘制配置文件的块。 也可以将配置文件绘制为纯色直方图。 或者,您可以选择根据看涨/看跌柱线为配置文件着色。 该指标基于裸价行为,不使用任何标准指标。
一个警报系统可用于价格跨越价值区域的高低、中值和单一打印区域的水平。
输入设置:
StartFromDate(默认 = __DATE__)— 如果 StartFromCurrentSession 为假,则指标将从该日期开始绘制配置文件。 它吸引了过去。 例如,如果您将其设置为 2018-01-20 并且 SessionsToCount 为 2,则它将绘制 2018-01

DiverX is a powerful and versatile divergence indicator developed for the MetaTrader 5 platform. It detects both Regular and Hidden Divergences based on five popular technical indicators: RSI (Relative Strength Index) , RVI (Relative Vigor Index) , Stochastic Oscillator, CCI (Commodity Channel Index) , and MACD (Moving Average Convergence Divergence) and ATR Plus (author’s proprietary indicator, product page >> ) . The indicator plots results directly on the main chart, providing visual lines
FREE

Raymond Cloudy Day Indicator for MT5 – Pivot-Based Reversal and Trend Levels Raymond Cloudy Day Indicator is a pivot-based level indicator for MetaTrader 5 (MT5). It was developed by Ngo The Hung based on Raymond’s original idea and is designed to give a structured view of potential reversal zones, trend extensions and support/resistance levels directly on the chart. The default settings are optimised for XAUUSD on the H1 timeframe, but the indicator can be tested and adjusted for other symbols
FREE

这是您停止猜测并理解策略的机会。 已跟踪281笔交易 | 64%的胜率 | 历史数据中70%的风险回报比 这些不仅仅是数字——它们是展示此策略如何运作的真实统计数据。如果您正在寻找更聪明交易的方法,这个工具可以带您实现目标。 您喜欢看到吞没策略的真实情况吗?购买后 联系我们 ,我们将免费为您提供我们的另一款产品。
查看我们的其他产品 ,了解更多真实策略,并 加入Real Trades社区 ,以自信交易并与真正的交易者联系! 基于 烛台范围理论(CRT) 打造的经过验证的工具,旨在精准且一致地识别流动性激增。该策略跟踪流动性掠夺,使用前一根K线的范围预测价格走势,并通过额外确认过滤掉虚假信号。 这个指标如何帮助您: 识别基于流动性的交易——带有止损和止盈的买入/卖出信号。 入场前确认——通过要求先发生流动性抢夺,避免虚假设置。 提供实时交易统计——随时了解您的表现:胜率、风险回报比和点数。 关注关键市场时段——仅在概率对您有利时交易。 保持您更新——每个交易设置的实时警报。 额外过滤器——通过附加确认获得更好的信号。 如果您厌倦了交易却不了解策略的概率,我们的工具可以帮到您。 亲眼见证!
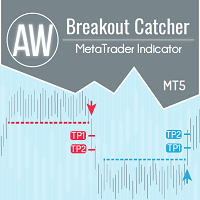
价格水平细分、高级统计、止盈计算和 3 种通知类型。 好处: 不要重绘你的结果 严格在蜡烛收盘时发出信号 假击穿过滤算法 它适用于任何趋势策略。 适用于所有工具和时间序列 手册和说明 -> 这里 / 问题解决 -> 这里 / MT4 版本 -> 这里 如何使用指标进行交易 只需三个简单的步骤即可使用 AW Breakout Catcher 进行交易: 第 1 步 - 开仓 收到买入信号,成功率超过 70% 第 2 步 - 确定止损 通过相反的信号选择中继线 第 3 步 - 定义止盈策略 策略一:达到 TP1 时平仓 策略 2:达到 TP1 时平仓 50%,达到 TP2 时平仓剩余 50% 策略 3:根据相反信号平仓 统计模块 为了更好地选择配对,请使用内置的统计计算。 计算交易 - 给出统计数据的信号总数 成功评级 - 达到 TP1 的信号百分比,或反转那些正获利的信号时的百分比 TakeProfit1 Hit - 达到 TP1 的信号百分比 TakeProfit2 Hit - 达到 TP2 的信号百分比 ExitProfit - 未达到 TP1 的信号百分比,但通过新信

What are Donchian Channels? Donchian Channels are three lines generated by moving average calculations that comprise an indicator formed by upper and lower bands around a mid-range or median band. The upper band marks the highest price of a security over N periods while the lower band marks the lowest price of a security over N periods. The area between the upper and lower bands represents the Donchian Channel. Career futures trader Richard Donchian developed the indicator in the mid-twentieth c
FREE

Candle Countdown Pro – Real-Time Timeframe & Spread Tracker Love it? Hate it? Let me know in a review! Feature requests and ideas for new tools are highly appreciated. :) Try "The AUDCAD Trader":
https://www.mql5.com/en/market/product/151841 Never miss a candle close again! Candle Countdown Pro is an essential trading tool that displays real-time countdowns for multiple timeframes,
live spread monitoring , and key trading information—all in one clean, customizable panel.
Key Features:
FREE
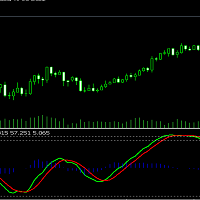
The WaveTrend (LazyBear) indicator is a momentum-based oscillator designed to identify reversal points , trend strength , and overbought/oversold conditions in the market. It is widely used in both Forex and Cryptocurrency trading due to its ability to detect turning points earlier than traditional oscillators like RSI or Stochastic.
(I have Converted from the original TradingView Pine Script version)
FREE

Swiss VWAPsimple Motivation Did not find free VWAP that works, the one that I found craseh. So I created a VWAP which calculates values only for the actual day. So computer resouces are not over stressed.
What is VWAP, how is it used? VWAP stands for Volume Weighed Average Price, it calculates the running sum of tick volume and the runnung sum of price times tickvolume. The division of these sums result in a weighed price (Sum P*V/Sum V). The calculation starts normally at midnight. The values
FREE

Description (English): Trend Test by Subho – Advanced Trend & Step Channel System Trend Test by Subho is a powerful all-in-one trend trading system designed to filter noise and provide clear market direction. This indicator combines two sophisticated algorithms: the Trend Test () and the Subho Step Channel into a single chart overlay. It also features a stylish Live Dashboard that alerts you to the current trend status in real-time. Key Features: Trend Test () Logic: An advanced tr
FREE
Advanced ADX Pro: 将您的ADX分析提升到新水平 Advanced ADX Pro 是一款先进的交易工具,旨在彻底改变您使用传统 平均趋向指数 (ADX) 指标的体验。该指标旨在提供更大的 便利性、控制力 以及 视觉和听觉清晰度 ,它远远超越了MetaTrader 5 (MT5) 原生ADX的功能。 什么是ADX?为何它至关重要? ADX是一个重要的技术指标,用于衡量市场 趋势的强度 。它由三条主要线组成: ADX(蓝色线): 表示趋势的强度。值增加表示趋势强劲 ,而值减少则表示趋势疲软或盘整 。 +DI(绿色线): 衡量上涨动能的强度 。 -DI(红色线): 衡量下跌动能的强度 。 这些线的组合使交易者能够识别市场何时处于趋势中以及趋势向哪个方向移动得更强劲。 MT5原生ADX vs. Advanced ADX Pro:功能上的飞跃 虽然MT5的原生ADX提供了基本线条,但 Advanced ADX Pro 的开发旨在克服这些限制,为您提供卓越的交易体验: 清晰独特的视觉信号 : 告别手动解读交叉点。Advanced ADX Pro 直接在主图表上提供 视觉箭头

Moving Average RAINBOW Forex traders use moving averages for different reasons. Some use them as their primary analytical tool, while others simply use them as a confidence builder to back up their investment decisions. In this section, we'll present a few different types of strategies - incorporating them into your trading style is up to you! A technique used in technical analysis to identify changing trends. It is created by placing a large number of moving averages onto the same chart. When a
FREE

This Indicator analyses the Trend and shows signals. When you open the Chart , Indicator shows you Buy or Sell Signal as Alert. Usage: Activate Algo Trading , Activate the Indicator and drag new currencies into chart. Indicator shows you Buy or Sell Signal as Alert.
Results
- Buy Signal
- Sell Signal
- No Signal For any question please don't hesitate to contact.
FREE

Bollinger bands out/in strategy A strategy created by Joe Ross, and very useful for finding trades when the market is overloaded. Indicator You don't need to find where there are entries on the chart, this indicator shows them for you. The entrance The trade is confirmed when the price closes outside the bollinger bands on a candle and the candle after the price closes inside the bands. comment I want to improve this indicator, so you can help me sending me your reviews and comments, thanks :).
FREE
Engulfing Pattern is a free indicator available for MT4/MT5 platforms, its work is to provide "alerts" when a "Bullish" or "Bearish engulfing pattern forms on the timeframe. This indicator comes with alerts options mentioned in the parameter section below. Join our MQL5 group , where we share important news and updates. You are also welcome to join our private channel as well, contact me for the private link. Engulfing Pattern Indicator MT4 Other Products Try our Martini EA with 2 years of liv
FREE

Candle Detector By Mahefa R. General Description Candle Detector is an advanced technical indicator for MetaTrader 5 , designed to automatically detect and highlight the most important Japanese candlestick patterns directly on the price chart .
It allows traders to quickly identify market reversal and continuation setups without visual clutter. The indicator recolors only the candles that match the selected pattern , ensuring a clear, accurate, and professional chart analysis . ️ How It Work
FREE

I'm sure after a lot of research on the internet, you haven't found any indicator that can help you with forex or binary trading in the latest probability strategy created by famous trader Ronald Cutrim. The strategy is based on a simple count of green and red candles, checking for a numerical imbalance between them over a certain period of time on an investment market chart. If this imbalance is confirmed and is equal to or greater than 16%, according to trader Ronald Cutrim, creator of the pro
FREE

Introduction
The SuperBands Indicator is a sophisticated technical analysis tool designed to provide traders with a clear visual representation of price movements within well-defined bands. This indicator is specifically engineered to filter out minor price fluctuations and market noise, offering traders a more accurate and reliable view of price trends and potential reversal points.
Signal
Buy when price breaks below the "Extremely oversold" band (darker red color) and then closes abo
FREE

Wyckoff fans, enjoy!
Ideally to be used with the Weis Waves indicator, but it can be easily used alone, the Waves Sizer puts the range (in resulting Price movement) done by the Price on its market swings. You can control how accurate or loose will be the swings. This tool is very helpful for visually know how much the Price has traveled in your Timeframe. This way you can confront this level of effort with the resulting Volume, etc... Weis Waves indicator:
https://www.mql5.com/en/market/produc
FREE

本指标是一款众所周知的 MetaTrader 4 指标,现直接免费在互联网上提供。它完全不会重绘。 它实现了一类突破策略。箭头指示行情的方向。在 M15 或更高时间帧里使用此指标。
FREE

This indicator searches for candlestick patterns. Its operation principle is based on Candlestick Charting Explained: Timeless Techniques for Trading Stocks and Futures by Gregory L. Morris. If a pattern is detected, the indicator displays a message at a bar closure. If you trade using the MetaTrader 4 terminal, then you can download the full analogue of the " Candle Pattern Finder for MT4 " indicator
It recognizes the following patterns: Bullish/Bearish (possible settings in brackets) : Hammer

Réngōng zhìhuì qūshì fāxiàn zhě (D Originals).
Wàihuì de shuāiluò.
Wǒmen jīngcháng wèn “jīngjì yèwù rúhé zhuànqián?”, Wǒmen huì qìngzhù wǒmen zhè yībiān de rènhé xiǎo'é yínglì jiāoyì.
Dàn shǐyòngle (D Originals) hòu nǐ huì wèn zìjǐ `wǒ shì rúhé yīyè zhìfù de?'.
Rúcǐ shēnkè, xíngdòng shèng yú xióngbiàn.
Yǒule réngōng zhìhuì qūshì guānchá zhě, bùyào hàipà:
*Shìchǎng cāozòng
*shìchǎng nìzhuǎn
* jū jí shǒu de jìnrù yǔ cúnzài
*làzhú tiàoyuè
cǐ zhǐbiāo shìyòng yú MT5 píngtái shàng kě j

RITZ SMART TREND ADAPTIVE FINDER Precision Trend Intelligence. Adaptive. Insightful. Real-Time. Ritz Smart Trend Adaptive Finder is an advanced market intelligence indicator engineered to detect and adapt to evolving market structures with dynamic precision.
It automatically calibrates its analytical period based on real-time volatility, price momentum, and correlation strength — delivering true adaptive trend detection rather than static or lagging signals. By combining Pearson correlation , sl
FREE

1. Overview The Ichimoku Kinko Hyo (or Ichimoku Cloud) is a comprehensive, all-in-one technical analysis indicator designed to provide a deep understanding of market trends, momentum, and dynamic support and resistance levels. This indicator provides a clean, standard implementation of the five core Ichimoku lines. Its key feature is a non-intrusive Status Dashboard that gives you an at-a-glance summary of the current market situation according to the Ichimoku system, allowing for quick and effi
FREE

Global Trading Sessions is a technical indicator for MetaTrader 5 designed to identify and mark the opening times of the four major financial sessions: Tokyo, London, New York, and Sydney . The indicator addresses the common challenge of varying broker server times by utilizing a GMT-based calculation logic . By synchronizing with Global Mean Time (GMT), the indicator ensures that session boundaries are accurately placed regardless of the brokerage platform’s local time zone. This makes it an es
FREE
Mean Reversion Probability – 统计性均值回归指标 简短说明
机构级指标,根据历史超延伸分析,计算价格回归到200周期均线(MA200)的统计概率。以量化精度识别市场疲劳区域。 主要功能
高级统计分析 – 基于500+历史延伸数据计算真实概率
概率评分 (0–99%) – 精确量化回归均线的可能性
疲劳检测 – 测量超延伸的持续时间与强度
多资产标准化 – 自动适配外汇、指数、黄金、加密货币、差价合约
智能警报 – 罕见但高度可靠的信号(概率 >80%,持续时间 >15 根K线)
专业级界面 – 清晰、结构化的机构风格设计 方法学
指标实时分析: 价格与MA200的标准化距离(以ATR计) 自上次回归以来的延伸时长 达到最大延伸的时间 与历史平均值比较 概率计算: 距离评分(最高60%):当前值与历史比值 持续评分(最高40%):延伸时间与平均时间比 疲劳加成(+15%):当持续时间 >1.5×最大延伸时间 极端加成(+10%):当距离 >2.5 ATR 推荐用法
机构级策略: 等待概率 >70% 且 距离 >1.5 ATR 通过较长延伸时间确认(绿色

You may find this indicator helpfull if you are following a session based strategy. The bars are colored according to the sessions. Everything is customisable.
Settings: + Asia Session: zime, color, high, low + London Session: zime, color, high, low + US Session: zime, color, high, low
Please feel free to comment if you wish a feature and/or give a review. Thanks.
FREE

Apply to the 5 minute timeframe against the major USD forex pairs. AUDUSD EURUSD GBPUSD USDCAD USDCHF USDJPY Highlights the PropSense Book Levels Turn on/off for Sydney, Asia, London and New York Sessions Shows the Tokyo and London Fixes Turn on/off for Tokyo and London Configure how many historical fixes to show Shows the Sessions Turn on/off visible indication for sessions (supports 4 sessions) Visibly shows the sessions (out of the box configuration for Sydney, Tokyo, London and New York) Hig
FREE

Advanced Indicator Scanner is a multi-symbol multi-timeframe scanner that works with hundreds of custom indicators available across the web including mql5 website market and codebase indicators.
Advanced Indicator Scanner features:
Scans your indicator in 28 customizable instruments and 9 timeframes. Monitors up to 2 lines(buffers) of an indicator. Showing of indicator value on buttons. You can choose between 3 alert modes: Single symbol and timeframe Multiple timeframes of a symbol Multiple

Relative Volume or RVOL is an indicator that averages the volume of X amount of days, making it easy to compare sessions volumes.
The histogram only has 3 colors:
Green - Above average volume
Yellow - Average volume
Red - Below average volume
The default setting is 20 days, which corresponds more or less to a month of trading.
In this version is possible to choose between tick and real volumes (if you are using a broker which offers future contracts)
With the data obtained from this in
FREE

Taking orders, now on MT5 the TPX Dash Needle is everything you need to find the famous Didi Needles on several timeframes and in several pairs at the same time. These are the simultaneous meeting of the 3, 8 and 20 averages that, aligned with the ADX indicator, are synonymous with large and strong movements in the market. Now with the new Heiken Aish filter, the name of the pair shows the direction of the Heiken Aish you choose, it can be weekly or daily, all signals will appear on the screen,

The indicator looks for the "Fifth dimension" trade signals and marks them on the chart. A detailed description of the chart patterns that generate the trade signals can be found in Chapter 8 "The Balance Line Trades" in the book Williams' "New Trading Dimensions". Signal levels with indication of the position entry or stop loss placement price are indicated directly on the chart. This feature creates additional convenience for the trader when placing pending orders. A solid horizontal line is d
FREE
MetaTrader市场提供了一个方便,安全的购买MetaTrader平台应用程序的场所。直接从您的程序端免费下载EA交易和指标的试用版在测试策略中进行测试。
在不同模式下测试应用程序来监视性能和为您想要使用MQL5.community支付系统的产品进行付款。
您错过了交易机会:
- 免费交易应用程序
- 8,000+信号可供复制
- 探索金融市场的经济新闻
注册
登录