Regardez les tutoriels vidéo de Market sur YouTube
Comment acheter un robot de trading ou un indicateur
Exécutez votre EA sur
hébergement virtuel
hébergement virtuel
Test un indicateur/robot de trading avant d'acheter
Vous voulez gagner de l'argent sur Market ?
Comment présenter un produit pour qu'il se vende bien
Indicateurs techniques pour MetaTrader 5 - 26
FOTSI – Indice de Force Véritable du Forex Découvrez la véritable force de chaque devise et tradez avec avantage. L' indicateur FOTSI est un oscillateur multi-devises qui mesure le momentum réel de chaque devise principale (USD, EUR, GBP, JPY, CHF, AUD, CAD, NZD) à travers tous ses paires. Au lieu d’analyser un seul graphique, FOTSI combine les données de plusieurs paires, lisse les mouvements et applique l’algorithme True Strength Index (TSI) pour offrir une vision claire, stable et sans retard
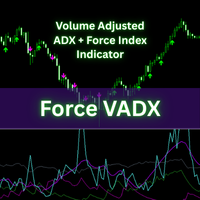
Force VADX Indicator Force VADX is an advanced, multi-factor indicator that fuses volume-adjusted trend strength, normalized force index, and adaptive directional signals. Designed for modern traders, it pinpoints high-confidence buy and sell zones, offering a robust technical foundation for both discretionary and automated trading.
Use this indicator in conjuntion with other tools for confirmation and confluene. This indicator is not intended to be a complete trading system but rather a tool
FREE

The indicator shows the current timeframe and symbol name. It is also possible to turn on the indication of time until the end of the current bar. In the settings, you can specify: - the location of the indicator in relation to the terminal window, top left, top right, bottom left and bottom right - a row of text display arrangements so that the inscriptions do not overlap each other - color - font - font size.
FREE

The indicator displays divergence for any custom indicator. You only need to specify the indicator name; DeMarker is used by default. Additionally, you can opt for smoothing of values of the selected indicator and set levels whose crossing will trigger an alert. The custom indicator must be compiled (a file with ex5 extension) and located under MQL5/Indicators of the client terminal or in one of the subdirectories. It uses zero bar of the selected indicator with default parameters.
Input parame
FREE

HiloPower – Advanced Trend and Market Strength Indicator for MetaTrader 5 HiloPower is not just another trend indicator developed from the traditional Hi-Lo. It was designed to offer a more complete and intelligent reading of the market, combining direction, strength, and intensity of movements. With it, the trader can see not only where the price is going, but also how strong and volatile that movement really is.
FREE
Advanced UT BOT ALERTS for MT5 Système professionnel de détection de tendance multi-filtres | Version améliorée du moteur UT BOT Nous proposons uniquement des indicateurs de haute qualité. Advanced UT BOT est conçu pour un usage professionnel, avec une logique de signal stable et un calcul sécurisé qui évite tout retard ou mise à jour erronée.
Il ne redessine, ne supprime ni ne modifie aucun signal passé.
Tous les signaux BUY et SELL sont générés uniquement après la clôture de la bougie , garant

Avez-vous déjà pensé à avoir un scanner qui analyse toutes les stratégies et montre les points d'achat et de vente sur tous les délais de cet actif, le tout en même temps ? C'est exactement ce que fait ce scanner. Il a été conçu pour afficher les signaux d'achat et de vente que vous avez créés dans le Rule Plotter : créateur de stratégies sans programmation et les exécuter dans ce scanner sur différents actifs et délais. La stratégie par défaut du Rule Plotter se compose uniquement des bougies h
FREE

Clock GMT Live a tout ce dont vous avez besoin pour en savoir plus sur notre courtier, plusieurs fois vous vous serez demandé sur quel gmt je suis ou sur quel gmt mon courtier travaille, eh bien avec cet outil vous pourrez savoir en temps réel à la fois le GMT décalage horaire du broker et de votre heure locale, vous connaîtrez également en permanence le ping du broker Juste en le plaçant à un moment de la journée, vous pouvez obtenir les informations
Le prix augmente pour chaque acquisition,
FREE

I'm sure after a lot of research on the internet, you haven't found any indicator that can help you with forex or binary trading in the latest probability strategy created by famous trader Ronald Cutrim. The strategy is based on a simple count of green and red candles, checking for a numerical imbalance between them over a certain period of time on an investment market chart. If this imbalance is confirmed and is equal to or greater than 16%, according to trader Ronald Cutrim, creator of the pro
FREE

Introduction
The RSI Plus is an innovative technical analysis tool designed to measure the strength and direction of the market trend. Unlike the traditional RSI indicator, the RSI Plus boasts a distinctive ability to adapt and respond to market volatility, while still minimizing the effects of minor, short-term market fluctuations.
Signal
Buy when the RSI plus has been in the oversold (red) zone some time and it crosses above the 20 level on previous candle close
Sell when the RSI plus ha
FREE

A professional tool for trading - the divergence indicator between the AO and the price, which allows you to receive a signal about a trend reversal in a timely manner or catch price pullback movements (depending on the settings). The indicator settings allow you to adjust the strength of the divergence due to the angle of the AO peaks and the percentage change in price, which makes it possible to fine-tune the signal strength. The indicator code is optimized and is tested very quickly as part
FREE

Do you want to see the most relevant supports and resistances at a glance? Tired of tracing the levels by hand? Multi Levels Detector is an indicator for MetaTrader that will draw supports and resistances according to the parameters entered, and also offers the possibility of executing an alert every time the price reaches any of its levels.
SETTINGS UsePercentage: Allows you to configure whether the distances between levels will be measured in points, or by a percentage of the asset.
TimeFram
FREE

Market Sessionsync** is a cutting-edge trading session indicator designed to enhance your trading experience by visually breaking down the market's daily rhythm. With a compact window overlaid on your chart, this indicator provides a split-second understanding of the current trading session through: Basic setup: Set Difference between your local time and your broker time , set DST(Daylight Saving Time) ON or OFF , set timescale sync you want to use (Local, Broker, CET) - A vertical time marker
FREE

Hull Moving Average is more sensitive to the current price activity than a traditional Moving Average. It faster responds to trend change and more shows the price movement more accurately. This is a color version of the indicator. This indicator has been developed based in the original version created by Sergey <wizardserg@mail.ru>. Suitable for all timeframes.
Parameters Period - smoothing period, recommended values are 9 to 64. The larger the period, the softer the light. Method - smoothing m
FREE
L’ indicateur Zero Lag Least Squares Moving Average (ZLSMA) est un outil avancé de moyenne mobile conçu pour offrir une analyse de tendance fluide et rapide sans retard. Basé sur la Least Squares Moving Average (LSMA) , il utilise un calcul à zéro décalage, ce qui le rend extrêmement réactif aux variations de prix. Cet indicateur aide les traders à identifier la direction du marché avec un minimum de retard , ce qui le rend idéal pour les stratégies de trading à court et long terme.
Caractéris
FREE

VWAP pour Scalpers
Lignes VWAP conscientes de la session pour des scalps rapides et précis. ️ Entrées (MT4/MT5) Enable_Hourly_VWAP: Activer VWAP par heure. Enable_Asia_VWAP: Activer VWAP de session Asie. Enable_Europe_VWAP: Activer VWAP de session Europe. Enable_NA_VWAP: Activer VWAP de session Amérique du Nord. Enable_Extended_VWAP: Activer VWAP de session étendue. Enable_Daily_VWAP: Activer VWAP quotidien. Session Asie (GMT) Session_Asia_Start_Hour: Heure de début de la session Asie. Session
FREE

Volume Gives Depth To Price Action! Volume Critical can accurately locate the cheapest areas to place trades. Enter reversals as early as possible to get the best Risk Reward setups!
Features Aggressive algorithm that anticipates reversals Volume Classifications Gray Histograms - Normal Volume, average market activity Orange Histogram - Trending Volume, increased market activity Pink Histograms - Overbought Volume, we can wait for further confirmation to sell Blue Histograms - Oversold Conditio

Introducing TrendScope – a versatile trend analysis tool designed for traders who want clear, structured insights into market direction.
TrendScope is built to deliver precise trend identification across multiple markets and timeframes, helping traders filter noise and focus on clean opportunities. Check out our other indicators as well:
Profile: More Indicators
Key Features: Universal Compatibility : Works on Forex, synthetic indices, commodities, indices, and crypto pairs. Multi-Timeframe
FREE
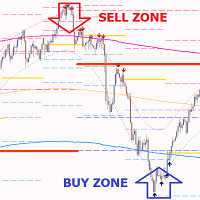
Gold PL MTF - c'est un excellent indicateur technique d'actions. L'algorithme de l'indicateur analyse le mouvement du prix de l'actif et reflète automatiquement les niveaux pivots importants de la période spécifiée (TF) à l'aide de la méthode de Fibonacci (section dorée).
L'indicateur décrit parfaitement la trajectoire du prix de la période sélectionnée (jour, semaine, mois, année), détermine le début d'une tendance et le début d'une correction, qui peut évoluer vers une tendance opposée.
L'i

This is a non-parametric ZigZag providing 4 different methods of calculation. Upward edge continues on new bars while their `highs` are above highest `low` among previous bars, downward edge continues on next bars while their `lows` are below lowest `high` among previous; Gann swing: upward edge continues while `highs` and `lows` are higher than on the left adjacent bar, downward edge continues while `highs` and `lows` are lower than on the left adjacent bar. Inside bars (with lower `high` and
FREE

This indicator is a volume indicator it changes the color of the candles according to a certain number of ticks, and this number of ticks can be informed by the user both the number of ticks and the color of the candles, this indicator works in any graphical time or any asset, provided that the asset has a ticker number to be informed.
This indicator seeks to facilitate user viewing when analyzing candles with a certain number of ticks.
FREE

Profil de volume à plage fixe automatique avec alertes pour MT5
Cet indicateur montre où le prix a passé le plus de temps, mettant en évidence les niveaux importants qui peuvent être utilisés dans le trading.
et peut montrer la densité des prix au fil du temps, décrivant les niveaux de prix les plus importants, la zone de valeur et la valeur de contrôle d'une séance de négociation donnée. Cet indicateur peut être attaché à des délais entre M1 et D1 et affichera le profil du marché pour des se

RSI Momentum Shift Detector - Momentum Change Indicator Maximize your accuracy: Divergences are powerful, but they are even stronger when combined with professional volume analysis. If you like the logic behind this indicator, you will love the Volume Structure Nexus , which identifies where the big players are entering. For fast-paced traders, pair these divergences with Accuracy M1 Scalper to catch explosive moves in lower timeframes.
RSI Momentum Shift Detector is a technical indicator desi
FREE

This indicator draws the highest and the lowest prices of the previous periods on the chart. And If you want, Indicator can alert you when the current price arrives these levels. For example: If you are watching the H1 timeframe, Indicator shows you the lowest and the highest prices of H4, D1, W1 and M1 periods. So you don't need to open the other periods of chart windows. Alert Options: Send Mobil Message, Send E-mail, Show Message, Sound Alert Time Periods: M1, M5, M15, M30, H1, H2, H3, H
FREE
Candle Countdown Pro – Real-Time Timeframe & Spread Tracker Love it? Hate it? Let me know in a review! Feature requests and ideas for new tools are highly appreciated. :) Try "The AUDCAD Trader":
https://www.mql5.com/en/market/product/151841 Never miss a candle close again! Candle Countdown Pro is an essential trading tool that displays real-time countdowns for multiple timeframes,
live spread monitoring , and key trading information—all in one clean, customizable panel.
Key Features:
FREE

Tracez facilement les niveaux d’entrée, de take profit et de stop loss sur votre graphique pour analyser et suivre les signaux de trading. Fonctionnalités principales Saisie facile des valeurs d’entrée, TP1, TP2, TP3 et SL Ligne verticale optionnelle pour marquer l’heure exacte du signal Étiquettes et couleurs personnalisables pour chaque ligne Évaluez visuellement la précision et le ratio risque/rendement des signaux Compatible avec tous les actifs et toutes les unités de temps Aucun recal
FREE
C’est votre chance d’arrêter de deviner et de comprendre votre stratégie. 281 trades suivis | 64 % de taux de réussite | 70 % de risque/rendement dans les données historiques Ce ne sont pas juste des chiffres — ce sont de vraies statistiques qui vous montrent comment cette stratégie fonctionne. Si vous cherchez un moyen de trader plus intelligemment, c’est l’outil qui peut vous y mener. Avez-vous aimé découvrir la réalité de la stratégie d’engloutissement ? Après votre achat, contactez-nous et n

Automatically unlocks vertical scrolling and fixes chart scaling issues when switching symbols or timeframes. Are you frustrated by MT5 constantly resetting your chart to "Auto Scale"?
Every time you change a symbol or timeframe, MT5 snaps the chart grid to the high/low of the price, locking the vertical axis. To move the chart up or down, you are forced to manually open properties or drag the side scale every single time.
Scale Enforcer solves this instantly.
This utility automatically det
FREE
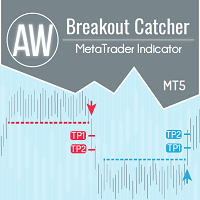
Ventilations des niveaux de prix, statistiques avancées, calcul TakeProfit et 3 types de notifications. Avantages: Ne redessinez pas vos résultats Signalez strictement à la fin de la bougie Algorithme de filtrage des fausses pannes Cela va bien avec toute stratégie de tendance. Fonctionne sur tous les outils et séries temporelles Manuel et instruction -> ICI / Résolution de problèmes -> ICI / Version MT4 -> ICI Comment trader avec l'indicateur Tradez avec AW Breakout Catcher en seuleme

This indicator marks the 50% mark of each candle. It will help you make profitable scalping trades. If the next candle opens above the 50% mark of the previous candle, you should open a BUY position, and if the next candle opens below the 50% mark of the previous candle, you should open a SELL position. This strategy is very profitable. To make the most of it, keep an eye on the candle contexts on the left. Good luck!
FREE

Калькулятор размера позиции в виде индикатора. Для тех случаев, когда использование стандартных советников для расчета риска невозможно. Два режима работы: Маркет и Отложенные ордера. Передвигаете линию SL и получаете необходимый объем позиции согласно настройкам риска. Только показывает информацию, сделки сам не открывает. Для корректной работы следует добавить все Major пары в Market Watch.
FREE

The Simple Market Sessions Indicator helps traders visualize the current status of major forex market sessions: Asian , London , New York , and Sydney . It shows whether each market is Open , Active (based on volume) , or Closed directly on the chart. With customizable session times and a volume threshold, this tool helps traders monitor session activity and volume strength, making it easier to decide the best times to trade.
Key features: Displays status: Open, Active (High Volume), or Closed
FREE

The Magic LWMA indicator is of great help in determining trend direction. It can be an excellent addition to your existing strategy or the basis of a new one. We humans can make better decisions when we see better visually. So we designed it to show a different color for rising and falling trends. Everyone can customize this in the way that suits them best. By setting the Trend Period, we can optimize it for longer or shorter trends for our strategy. It is great for all time frames.
IF YOU NEE
FREE
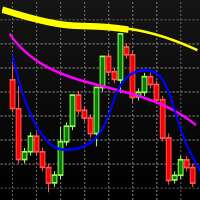
Baseado no indicador MIMA SAR, que é uma combinação dos indicadores MIMA Consolidação e MIMA Tendência, da metodologia Phicube. O indicador é composto pelos 8 fractais, 17,34.72.144.305,610.1292,2554. Sendo a tendência indicada pelas linhas finas e a consolidação pelas linhas mais espessas. Para usar o indicador de maneira adequada deve-se partir do princípio de que tudo na natureza segue o caminho que oferece menor resistência. Isso significa que para uma reversão da tendência ocorrer nesse mod
FREE

Apply to the 5 minute timeframe against the major USD forex pairs. AUDUSD EURUSD GBPUSD USDCAD USDCHF USDJPY Highlights the PropSense Book Levels Turn on/off for Sydney, Asia, London and New York Sessions Shows the Tokyo and London Fixes Turn on/off for Tokyo and London Configure how many historical fixes to show Shows the Sessions Turn on/off visible indication for sessions (supports 4 sessions) Visibly shows the sessions (out of the box configuration for Sydney, Tokyo, London and New York) Hig
FREE

Introducing the Professional Arka STM Signal Indicator
With Arka Candle Close Time – 100% Free Version Fast, Accurate, and Unmatched in Identifying Trading Opportunities
This indicator is the result of combining advanced price action analysis with specialized market algorithms, delivering clear, timely, and profitable signals. Completely Free – No Installation or Usage Limits
️ An automated trading bot, fully synchronized with it, is also ready to run. The Power of ARKA STM Signa
FREE
Advanced ADX Pro : Amenez votre analyse ADX au niveau supérieur L' Advanced ADX Pro est un outil de trading avancé conçu pour transformer votre expérience avec l'indicateur traditionnel Average Directional Index (ADX) . Créé pour offrir plus de confort, de contrôle et de clarté visuelle et auditive , cet indicateur va bien au-delà des capacités de l'ADX natif de MetaTrader 5 (MT5). Qu'est-ce que l'ADX et pourquoi est-il crucial ? L'ADX est un indicateur technique vital qui mesure la force de
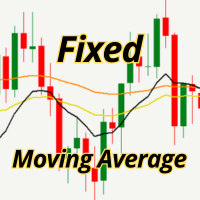
Display any moving average at its original timeframe, regardless of the chart’s timeframe.
What does it do?
This indicator allows you to view a moving average from any timeframe (M5, H1, H4, D1, etc.) directly on your current chart, preserving its original values from the timeframe you selected.
Practical example:
You are trading on the M5 timeframe.
You activate the H1 MA with this indicator.
You see exactly the same line you would see if you switched to H1.
Without changing the timefra
FREE

For traders, monitoring price movements is a constant activity, because each price movement determines the action that must be taken next.
This simple indicator will helps traders to display prices more clearly in a larger size.
Users can set the font size and choose the color that will be displayed on the chart. There are three color options that can be selected to be displayed on the chart.
FREE

Initiated in 1995 by the physicist and technical analyst Paul Levine, PhD, and subsequently developed by Andrew Coles, PhD, and David Hawkins in a series of articles and the book MIDAS Technical Analysis: A VWAP Approach to Trading and Investing in Today's Markets.Latterly, several important contributions to the project, including new MIDAS curves and indicators, have been made by Bob English, many of them published in the book.
FREE

Excellent outil utilitaire où vous pouvez surveiller en temps réel la moyenne de votre compte et la propagation du symbole Celui-ci saura identifier précisément les données, pour pouvoir savoir par exemple si vous avez un compte Prop Firm, connaître la bonne Laverage et si le spread est manipulé, etc. pour faire un lotage précis
Combinaison d'un effet de levier et d'un indicateur de spread. Des outils pour automatiser la vérification de l'effet de levier et du spread sur votre compte de tradin
FREE

The technical indicator Wave Vision measures the relative strength of the trend movements of the price from its average values over a certain time period. The histogram shows price movement strenght relative to the zero level line. Histogram values close to zero indicate the equality of forces between buyers and sellers. Above the zero level line - bullish trend (positive values of the bar chart). Below the zero level line - bearish trend (negative values of the bar chart).
Settings:
Smooth
FREE
1. Introduction The CM_Ultimate_RSI_MTF is a powerful and versatile custom indicator for MetaTrader 5, designed to enhance your Relative Strength Index (RSI) analysis. It provides multi-timeframe (MTF) capabilities, visual signals, and customizable alerts, making it an invaluable tool for traders seeking to identify overbought/oversold conditions, trend strength, and potential entry/exit points across various timeframes. 2. Key Features Multi-Timeframe (MTF) Analysis: Allows you to view RSI from
FREE

About the indicator: DALA Forecast is a universal tool for predicting the dynamics of time series of any nature. For prediction, modified methods of nonlinear dynamics analysis are used, on the basis of which a predictive model is built using machine learning methods. To get the trial version of the indicator, you can contact me in private messages.
How to use the indicator: Apply the indicator to your chosen financial instrument or indicator with the settings you need. The prediction will be
FREE

An indicator for visualizing time ranges of key trading sessions: Asian, European, and American. The indicator features functionality for setting the start and end times of each trading session, as well as an adjustable timezone of the trading server. The main advantages of the indicator include the ability to operate with minimal CPU load and memory usage. Moreover, it offers the option to specify the number of displayed historical days, providing the user with flexible market dynamics analysis
FREE

This indicator searches for candlestick patterns. Its operation principle is based on Candlestick Charting Explained: Timeless Techniques for Trading Stocks and Futures by Gregory L. Morris. If a pattern is detected, the indicator displays a message at a bar closure. If you trade using the MetaTrader 4 terminal, then you can download the full analogue of the " Candle Pattern Finder for MT4 " indicator
It recognizes the following patterns: Bullish/Bearish (possible settings in brackets) : Hammer

Hidden Edge – High-Low PreUS High-Low PreUS is a clean and lightweight indicator that marks key reference levels before the US session begins.
It draws a session box from 00:01 to 09:00 CET, identifying the high and low of the Asian session, and includes additional reference elements to support structured intraday trading decisions. Features Draws a rectangular range from 00:01 to 09:00 CET Marks the high and low of the session clearly Plots a horizontal yellow line as a suggested stop level bas
FREE

Cybertrade ATR Trend Zone - MT5 The indicator shows, by calculating the ATR (Average True Range), the zone of probable price resistance. Indicated to be used as a probable exit point of an operation.
It works on periods longer than the period visible on the chart. All values are available in the form of buffers to simplify possible automations. This indicator is the same one we use in our EA. Also check out our other products.
FREE

L'Ai Trend Spotter (D Originals).
La chute du Forex.
Nous demandons souvent « Comment le courtage gagne-t-il de l'argent ? » et nous célébrons toutes les petites transactions gagnantes de notre côté.
Mais après avoir utilisé (D Originals) vous vous demanderez " Comment suis-je devenu riche du jour au lendemain ?".
Si profond que l'action parle plus fort que la voix.
Avec l'Ai Trend Spotter, n'ayez pas peur de :
* Manipulation du marché
*Inversion du marché
* Entrée et existence de

My Fibonacci MT5 An automated Fibonacci indicator for MetaTrader 5 that combines ZigZag swing detection with comprehensive Expert Advisor integration through a 20-buffer system. More details about data specification and EA integration: https://www.mql5.com/en/blogs/post/764114 Core Features Automated Fibonacci Detection The indicator identifies swing points using configurable ZigZag parameters and draws Fibonacci retracements and extensions automatically. It updates levels as new swing formatio
FREE

Swiss VWAPsimple Motivation Did not find free VWAP that works, the one that I found craseh. So I created a VWAP which calculates values only for the actual day. So computer resouces are not over stressed.
What is VWAP, how is it used? VWAP stands for Volume Weighed Average Price, it calculates the running sum of tick volume and the runnung sum of price times tickvolume. The division of these sums result in a weighed price (Sum P*V/Sum V). The calculation starts normally at midnight. The values
FREE
'Fibonacci Dimension' indicator allows display of preset or user-defined multi-timeframe Fibonacci levels. It automatically takes the previous high and low for two user-defined timeframes and calculates their Fibonacci retracement levels. It also considers the retraced level to draw the expansions on every change of price. A complete visual dimension in multiple timeframes allows deriving profitable strategies for execution. Enhanced functionality to view and customize the default Fibonacci Rang
FREE
Mean Reversion Probability – Indicateur de Retournement Statistique Description courte
Indicateur institutionnel qui calcule la probabilité statistique de retour vers la moyenne mobile 200, à partir de l’analyse des sur-extensions historiques. Il identifie les zones de fatigue du marché avec une précision quantitative. Fonctionnalités principales
Analyse statistique avancée – Base de données de plus de 500 extensions historiques pour calculer des probabilités réelles
Score de probabilité (0–99

Free version of the TickScalper indicator. The Tick Scalp indicator is a trading assistant for a scalping trader. Works in a separate window. Tracks the momentary activity of the market, shows the graph of the movement of ticks and the strength of bulls or bears. Sometimes it can anticipate the beginning of a strong movement before any other indicators. Helps the trader to make a decision to open the desired order. Designed to work on any instrument. Used timeframes from M1 to M15. Has simple a
FREE

Volume Weighted Average Price (VWAP) is a trading benchmark commonly used by Big Players that gives the average price a Symbol has traded throughout the day. It is based on both Volume and price. This indicator contains Daily VWAP and MIDAS' VWAP, which means you are able to anchor the beggining of MIDAS' calculations and, therefore you will be able to use this methodology to study price versus volume moves after anchor point. You will be able to anchor up to 3 HIGH MIDAS VWAP's and 3 LOW.
Wish
FREE

Advanced Indicator Scanner is a multi-symbol multi-timeframe scanner that works with hundreds of custom indicators available across the web including mql5 website market and codebase indicators.
Advanced Indicator Scanner features:
Scans your indicator in 28 customizable instruments and 9 timeframes. Monitors up to 2 lines(buffers) of an indicator. Showing of indicator value on buttons. You can choose between 3 alert modes: Single symbol and timeframe Multiple timeframes of a symbol Multiple
The Channel Sgnals ProfRoboTrading Indicator for MT5 is an effective Forex trading tool designed to track market movements. The MT5 signal point indicator effectively detects trend reversals after they have already occurred. This Indicator is a fully automated technical tool that includes a number of parameters to track market trends. It automatically examines the ever-changing price dynamics of the market, compares the information with earlier data and generates a trading signal. Because
FREE

This indicator is based on the Parabolic SAR indicator. It helps the user identifying whether to buy or sell. It comes with an alert that will sound whenever a new signal appears. It also features an email facility. Your email address and SMTP Server settings should be specified in the settings window of the "Mailbox" tab in your MetaTrader 5. Blue arrow up = Buy. Red arrow down = Sell. Line = Trailing Stop. You can use one of my Trailing Stop products that automatically move the Stop Loss and i
FREE
Indicador com regra de coloração para estratégias que utilizam Inside Bar! Quando rompe a barra inside, se for para cima, compra e posiciona o stop loss na mínima da barra inside. Se romper para baixo, vende e posiciona o stop loss na máxima da barra inside. Pode ser aliada a tendências de outros tempos gráficos e outros filtros.
Grupo de sinais gratuito no telegram: https://t.me/InsideBarRST
FREE

Taking orders, now on MT5 the TPX Dash Needle is everything you need to find the famous Didi Needles on several timeframes and in several pairs at the same time. These are the simultaneous meeting of the 3, 8 and 20 averages that, aligned with the ADX indicator, are synonymous with large and strong movements in the market. Now with the new Heiken Aish filter, the name of the pair shows the direction of the Heiken Aish you choose, it can be weekly or daily, all signals will appear on the screen,

When prices breakout resistance levels are combined with momentum oscillator breaks out its historical resistance levels then probability emerges to record farther higher prices. It's strongly encouraged to confirm price breakout with oscillator breakout since they have comparable effects to price breaking support and resistance levels; surely, short trades will have the same perception. Concept is based on find swing levels which based on number of bars by each side to confirm peak or trough
FREE

MACD Support–Resistance Candle Analyzer — Professional This indicator enhances the classic MACD by combining momentum analysis with dynamic Support & Resistance detection , giving traders a clearer view of breakout strength and market structure. It transforms price action into color-coded MACD candles , highlights SnR break levels , and provides clean visual confirmation of trend continuation or reversal. Ideal for scalpers, intraday traders, and swing traders who rely on fast, structured trend
FREE
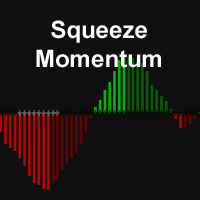
The Squeeze Momentum Indicator, identifies periods of low volatility ("squeeze") when Bollinger Bands are inside the Keltner Channel, marked by black crosses on the midline. This suggests the market is preparing for a significant move.
Gray crosses indicate a "squeeze release," signaling potential breakout. To use it, wait for the first gray cross after a black cross, then enter a trade in the direction of momentum (long if above zero, short if below). Exit when momentum shifts (color change i
FREE

DiverX is a powerful and versatile divergence indicator developed for the MetaTrader 5 platform. It detects both Regular and Hidden Divergences based on five popular technical indicators: RSI (Relative Strength Index) , RVI (Relative Vigor Index) , Stochastic Oscillator, CCI (Commodity Channel Index) , and MACD (Moving Average Convergence Divergence) and ATR Plus (author’s proprietary indicator, product page >> ) . The indicator plots results directly on the main chart, providing visual lines
FREE
Engulfing Pattern is a free indicator available for MT4/MT5 platforms, its work is to provide "alerts" when a "Bullish" or "Bearish engulfing pattern forms on the timeframe. This indicator comes with alerts options mentioned in the parameter section below. Join our MQL5 group , where we share important news and updates. You are also welcome to join our private channel as well, contact me for the private link. Engulfing Pattern Indicator MT4 Other Products Try our Martini EA with 2 years of liv
FREE

Heikin Ashi Candlestick Indicator for MT5 This custom Heikin Ashi indicator provides a smooth visual representation of market trends by filtering out short-term noise, making it easier to identify potential reversals and trend continuations. Unlike regular candlesticks, Heikin Ashi candles are calculated using averages, resulting in more stable and readable chart patterns. Key Features: Clear and smoothed visualization of price action. Compatible with all timeframes and instruments. Lightwe
FREE

Excellent tracking performance and minimal noise! This trend detection indicator that avoids whipsaws and uncertain market noise and is also agile enough to react to changes in trend.
It is also designed to adapt to dynamic markets.
Functions mainly as a filter to help you trade in the direction of the trend.
Features.
Simple and easy to use. Low load and easy to try out The excellent tracking performance and smooth lines that make it ideal for market analysis Can be used as a trend filter for
FREE

When trading price action or using price action triggers such as Pbars, Inside Bars, Shaved Bars, etc. it is important to always wait for the bar/candle to close more than anything else.It is often the case (whether it’s the 4H, hourly, etc) that price action will be dominant in one direction for the majority of the candle only to reverse strongly at the end of the candle. Institutional traders know retail traders are less disciplined than they are. They know a good trading candle pattern coul
FREE

Probability emerges to record higher prices when RVi breaks out oscillator historical resistance level. It's strongly encouraged to confirm price breakout with oscillator breakout since they have comparable effects to price breaking support and resistance levels; surely, short trades will have the same perception. As advantage, a lot of times oscillator breakout precedes price breakout as early alert to upcoming event as illustrated by last screenshot. Furthermore, divergence is confirmed in
FREE
Engulfing Zone Sniper MT5 — Multi-Timeframe Signal & Zone Indicator The Engulfing Zone Sniper MT5 is a technical analysis tool designed to highlight engulfing candlestick patterns in combination with adaptive support/resistance zones. It provides visual markers and optional alerts to assist traders in identifying market structure reactions across multiple timeframes. Key Features Multi-Timeframe Detection – Option to scan higher timeframe engulfing setups with lower timeframe confirmation. Su
Le MetaTrader Market offre un lieu pratique et sécurisé pour acheter des applications pour la plateforme MetaTrader. Téléchargez des versions démo gratuites de Expert Advisors et des indicateurs directement depuis votre terminal pour les tester dans le testeur de stratégie.
Testez les applications dans différents modes pour surveiller les performances et effectuez un paiement pour le produit que vous souhaitez en utilisant le système de paiement MQL5.community.
Vous manquez des opportunités de trading :
- Applications de trading gratuites
- Plus de 8 000 signaux à copier
- Actualités économiques pour explorer les marchés financiers
Inscription
Se connecter
Si vous n'avez pas de compte, veuillez vous inscrire
Autorisez l'utilisation de cookies pour vous connecter au site Web MQL5.com.
Veuillez activer les paramètres nécessaires dans votre navigateur, sinon vous ne pourrez pas vous connecter.