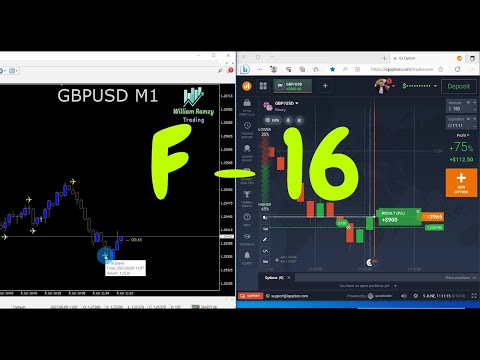
F 16 Plane Indicator

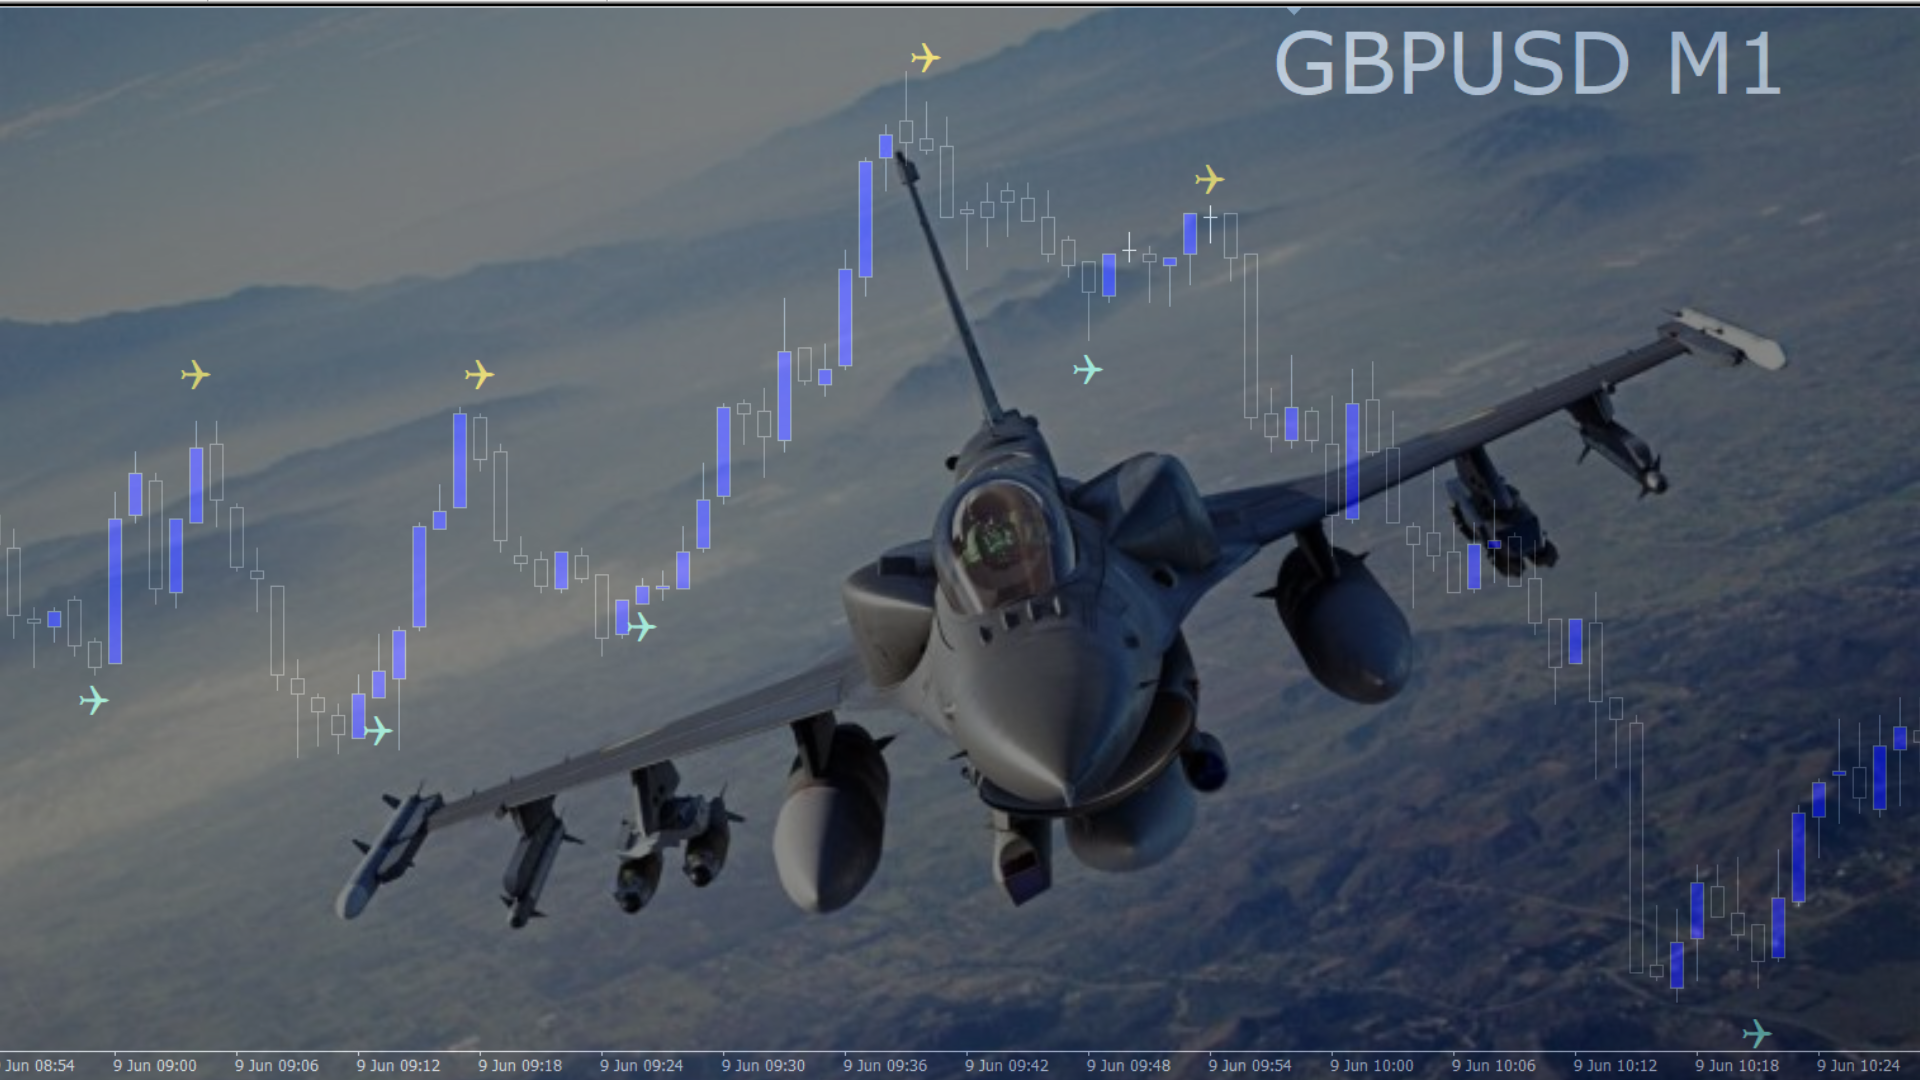
F-16 비행기 지표를 소개합니다. 이것은 귀하의 거래 경험을 혁신하도록 설계된 최첨단 MT4 도구입니다. F-16 전투기의 비할 데 없는 속도와 정밀성에 영감을 받아이 지표는 고급 알고리즘과 최첨단 기술을 결합하여 금융 시장에서 압도적인 성능을 제공합니다.

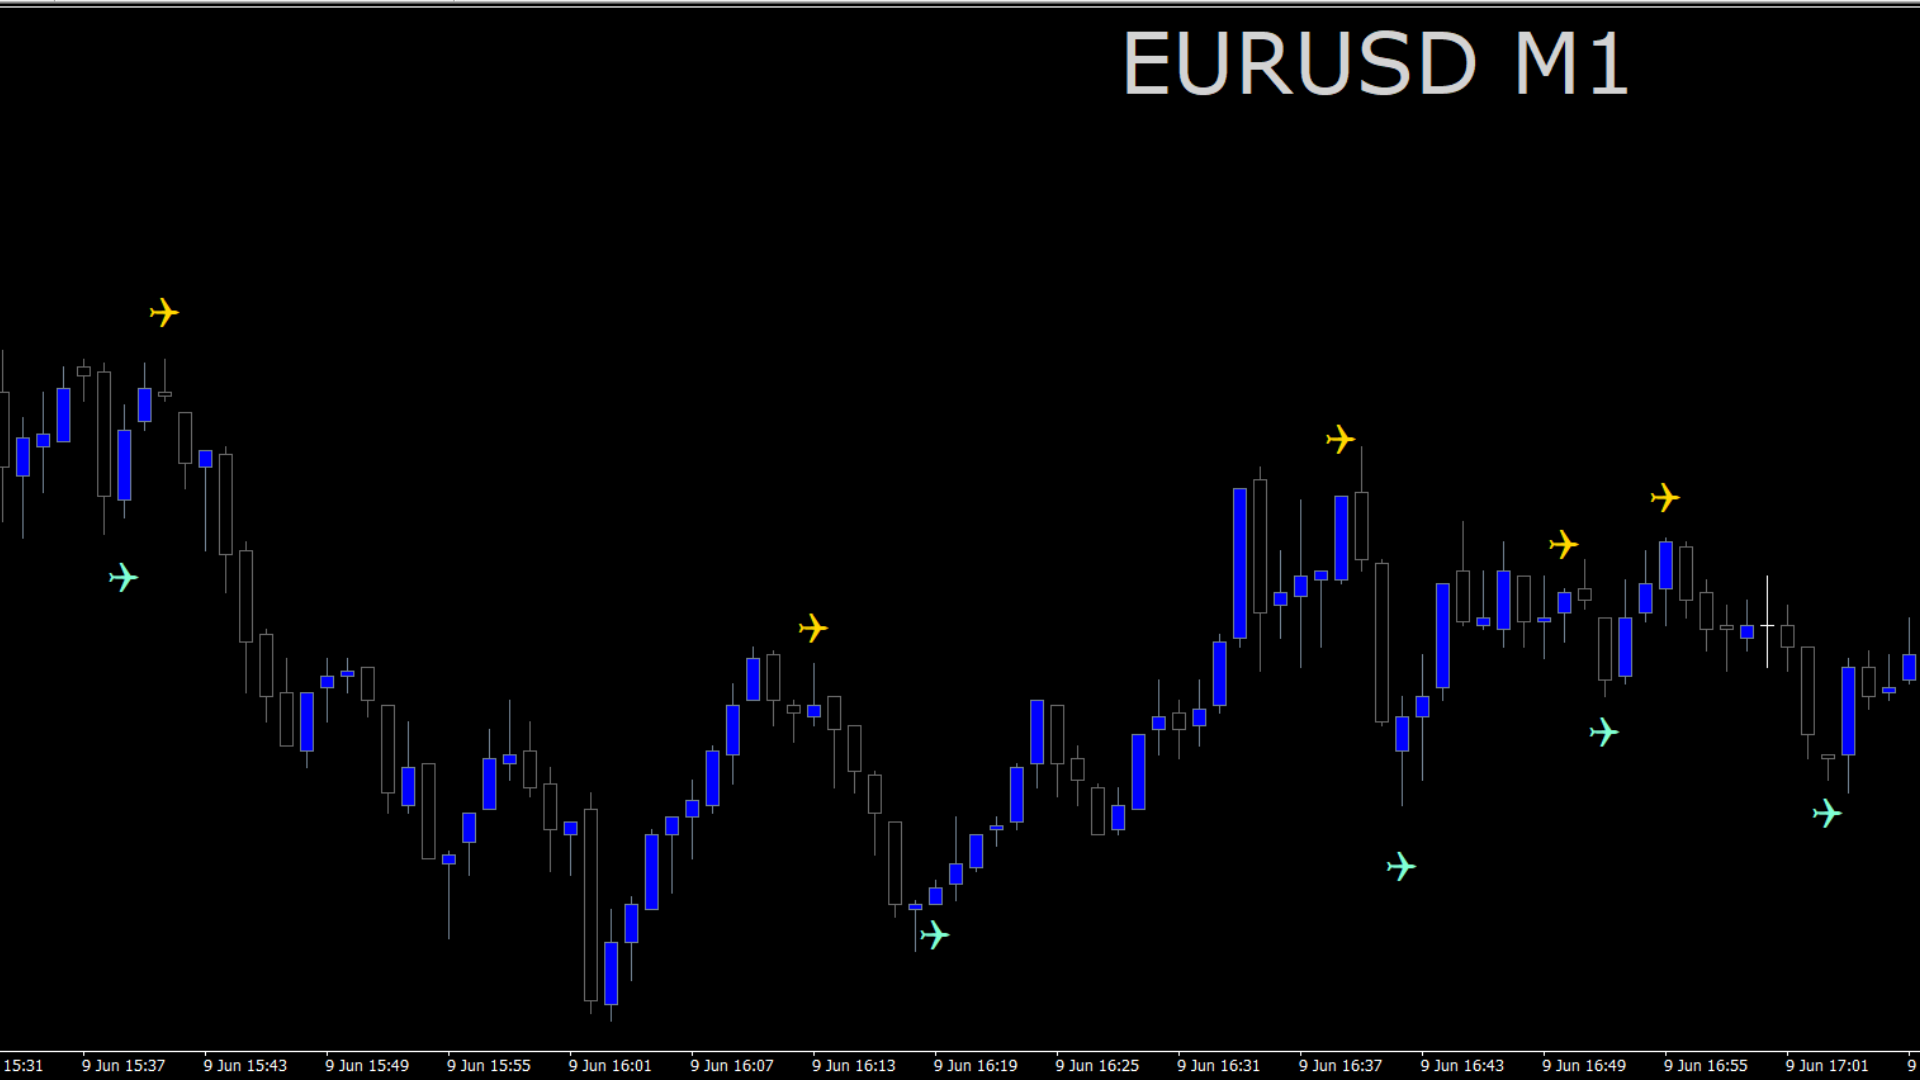
F-16 비행기 지표를 사용하면 실시간 분석을 제공하고 매우 정확한 거래 신호를 생성하여 경쟁을 앞서갈 수 있습니다. 다양한 자산 클래스에서 수익 기회를 식별하는 데 필요한 동적 기능을 갖추고 있어 확신을 가지고 정보에 근거한 결정을 내릴 수 있습니다.

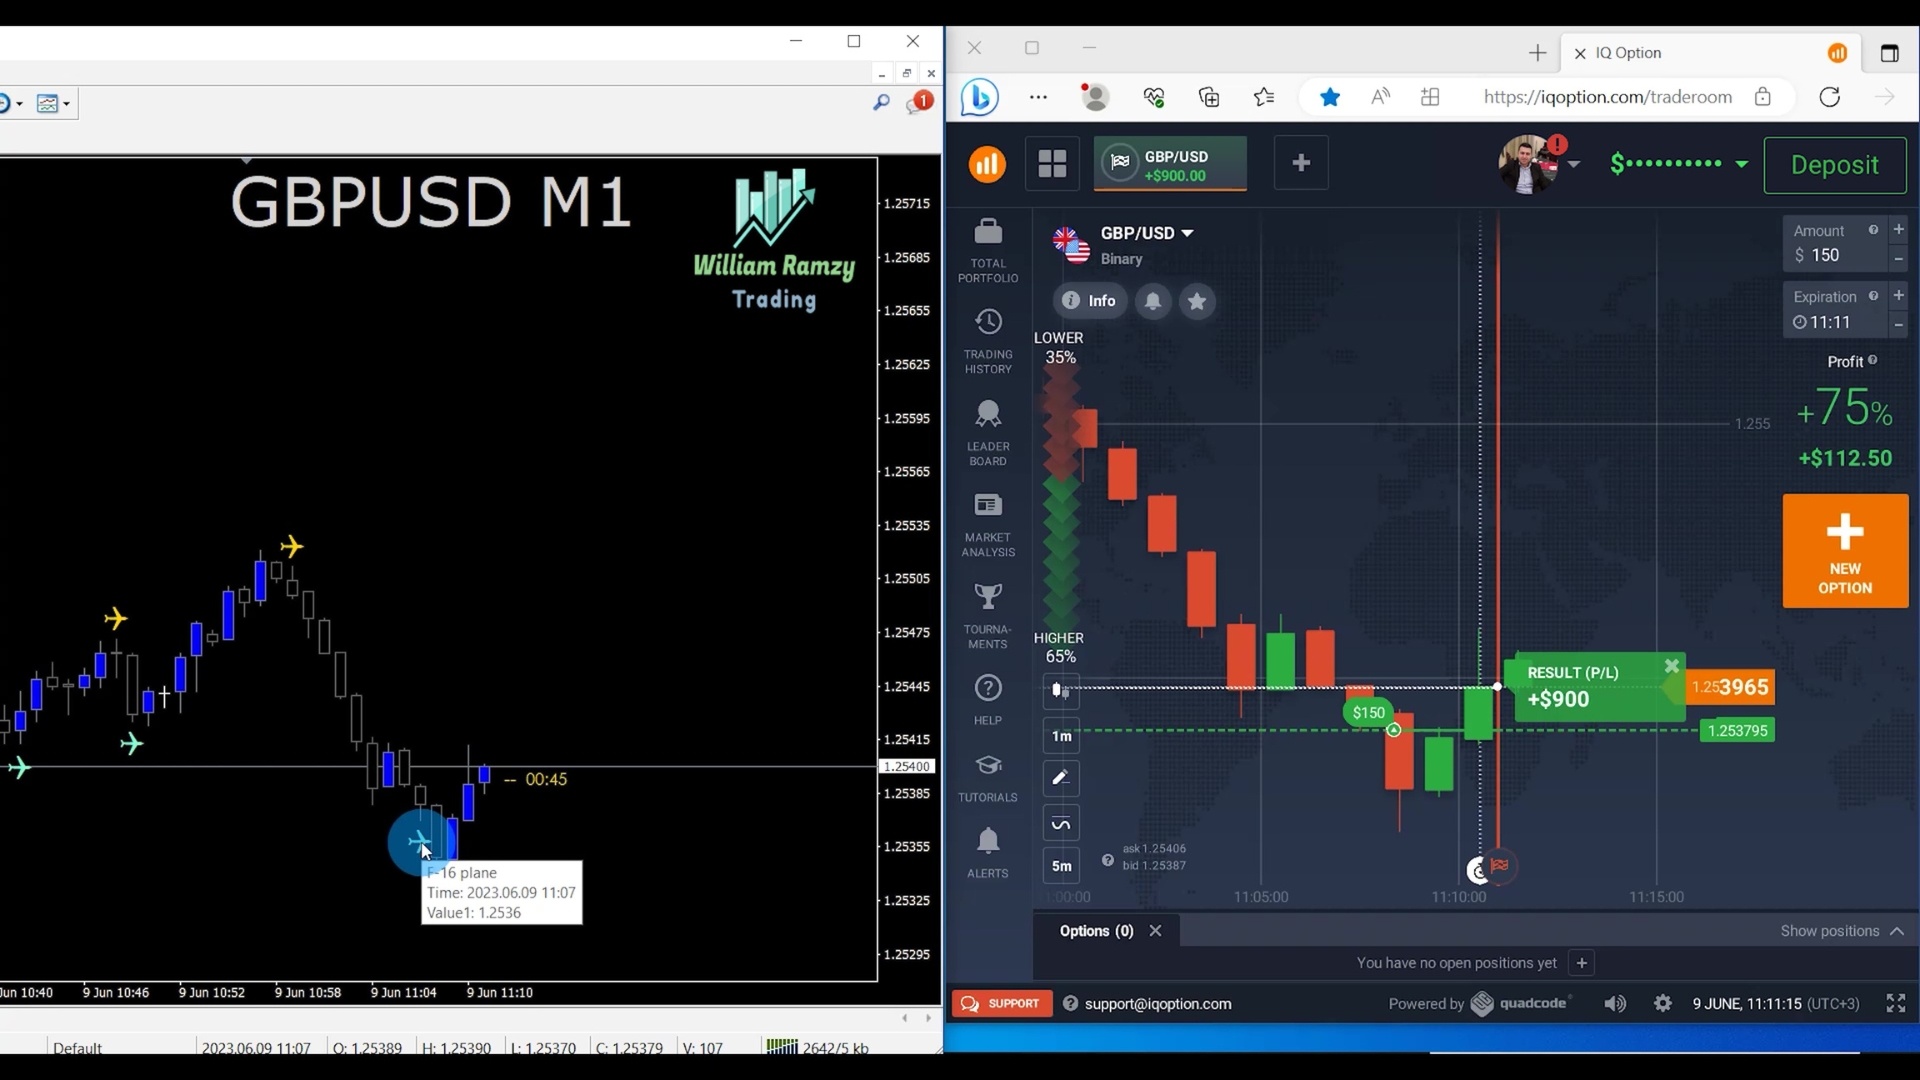
사용자 친화적인 인터페이스로 구성된 F-16 비행기 지표는 인기있는 MetaTrader 4 플랫폼과 완벽하게 통합되어 원활하고 효율적인 거래 과정을 보장합니다. 초보자 트레이더든 경험 많은 전문가든 이 지표를 쉽게 사용자 정의하여 고유한 거래 스타일과 선호도에 맞출 수 있습니다.

F-16 비행기 지표의 강력함을 경험해 보세요. 이 지표는 시장 트렌드를 정확하고 민첩하게 탐색하며 진행합니다. 고급 차트 기능을 통해 최적의 타이밍을 위한 주요 진입 및 탈출 지점을 감지하여 항상 선배를 유지할 수 있습니다. F-16 비행기 지표와 함께 거래 여정을 주도하고 일관된 수익을 창출하는 잠재력을 발휘하세요.

이 우수한 MT4 지표와 함께 이륙에 준비하고 거래 성과를 새로운 높이로 끌어올리세요. F-16 비행기 지표는 금융 시장 세계에서 귀하의 궁극적인 공동 조종사로서 속도, 정확성 및 자신감을 통해 성공을 달성할 수 있도록 도와줍니다.


추천 제품
Owl smart levels
Sergey Ermolov
4.24 (37)
MT5 버전  |   FAQ Owl Smart Levels Indicator 는   Bill Williams 의 고급 프랙탈, 시장의 올바른 파동 구조를 구축하는 Valable ZigZag, 정확한 진입 수준을 표시하는 피보나치 수준과 같은 인기 있는 시장 분석 도구를 포함하는 하나의 지표 내에서 완전한 거래 시스템입니다. 시장과 이익을 취하는 장소로. 전략에 대한 자세한 설명 표시기 작업에 대한 지침 고문-거래 올빼미 도우미의 조수 개인 사용자 채팅 ->구입 후 나에게 쓰기,나는 개인 채팅에 당신을 추가하고 거기에 모든 보너스를 다운로드 할 수 있습니다 힘은 단순함에 있습니다! Owl Smart Levels   거래 시스템은 사용하기 매우 쉽기 때문에 전문가와 이제 막 시장을 연구하고 스스로 거래 전략을 선택하기 시작한 사람들 모두에게 적합합니다. 전략 및 지표에는 눈에 보이지 않는 비밀 공식 및 계산 방법이 없으며 모든 전략 지표는 공개되어 있습니다. Owl Smart Leve
Shark Deal Book
Philip Pankaj Suthagar
4 (3)
Term  "shark"  in the business world denotes a high volume investor who just made a good investment in a highly Potential business deal.So, sharks are the ones who make the market move. In our case, if an American shark bought a Japanese company, he/she has to convert American dollars into Japanese yen to make the deal. So, the demand for the Japanese yen will increase sharply. Thus USD/JPY will go short rapidly if the deal was from the shark. Another example, In the case of forex, if fed increa
Stepping Trend
Mpendulo Chiliza
The Stepping Trend Indicator     The Steppi ng Trend indicator uses the  average true range  (ATR indicator) in its calculation. This gives you control to set your own average true range period, I set the Default as 10.   Indicator Details. Green Arrow Up: This means you are at the starting point of a new bullish trend, it’s time to buy.   Red  Arrow  Down : This means you are at the starting point of a new  bearish  trend, it’ s time to sell .   What if you miss the Arrow Signal?   No prob
Blahtech Market Profile
Blahtech Limited
4.53 (15)
Was: $249  Now: $99   Market Profile defines a number of day types that can help the trader to determine market behaviour. A key feature is the Value Area, representing the range of price action where 70% of trading took place. Understanding the Value Area can give traders valuable insight into market direction and establish the higher odds trade. It is an excellent addition to any system you may be using. Blahtech Limited presents their Market Profile indicator for the MetaTrader community. Ins
Gold Titan King Scalper
Dodong Christian Arnon
Indicator Description GOLD TITAN KING SIGNAL INDICATOR High-Precision Gold Scalping Buy/Sell Signals – Manual Trading Assistant Overview The Gold Titan King Signal Indicator is a manual trading assistant tool designed for high-frequency scalping on Gold (XAUUSD) and other major pairs. It generates clear BUY/SELL signals with precise entry levels, along with adjustable Stop Loss and Take Profit levels displayed directly on the chart. ️ This tool is NOT an EA. It does not execute trades
Trendiness Index
Libertas LLC
5 (3)
"The trend is your friend" is one of the best known sayings in investing, because capturing large trendy price movements can be extremely profitable. However, trading with the trend is often easier said than done, because many indicators are based on price reversals not trends. These aren't very effective at identifying trendy periods, or predicting whether trends will continue. We developed the Trendiness Index to help address this problem by indicating the strength and direction of price trend
SMC Venom Model BPR 지표는 Smart Money(SMC) 개념 내에서 일하는 트레이더를 위한 전문 도구입니다. 가격 차트에서 두 가지 주요 패턴을 자동으로 식별합니다. FVG (공정 가치 갭)는 3개의 캔들의 조합으로, 첫 번째와 세 번째 캔들 사이에 갭이 있습니다. 이는 볼륨 지원이 없는 레벨 사이에 구역을 형성하여 종종 가격 수정으로 이어집니다. BPR (균형 가격 범위)은 두 개의 FVG 패턴의 조합으로, "브리지"를 형성합니다. 이는 가격이 낮은 볼륨 활동으로 움직일 때 브레이크아웃과 레벨로의 복귀 구역으로, 캔들 사이에 갭을 생성합니다. 이러한 패턴은 거래자가 차트에서 거래량과 가격 역학을 분석하여 주요 지지/저항 수준, 돌파 구역 및 진입 지점을 식별하는 데 도움이 되며, 여기서 대형 시장 참여자와 일반 참여자 간의 상호 작용이 발생합니다. 이 지표는 사각형과 화살표 형태로 패턴을 시각화하며 유연한 경고 설정도 지원합니다. 주요 특징: 패턴 표시 모드:
Super Reversal Pattern
Parfait Mujinga Ndalika
Super Reversal Pattern Indicator Unlock the power of advanced pattern recognition with our Super Reversal Pattern Indicator. Designed for traders seeking precision and reliability, this indicator identifies one of the most effective reversal patterns in technical analysis, offering a significant edge in your trading strategy. Key Features: Non-Repainting Accuracy: Enjoy the confidence of non-repainting technology. Once a Super Reversal Pattern is detected, it remains static, providing consiste
Trend Ray
Andriy Sydoruk
The indicator shows the potential trend direction by cyclical-wave dependence. Thus, all the rays of the intersection will be optimal rays, in the direction of which the price is expected to move, taking into account the indicator period. Rays can be used as a direction for potential market movement. But we must not forget that the approach must be comprehensive, the indicator signals require additional information to enter the market.
Power Renko MT4
Pierce Vallieres
Power Renko is an indicator which plots Renko bricks underneath the chart using a histogram. You can select the brick size and the timeframe of the Renko bricks as well as whether or not to use the close price or the high/low price of the candles. Renko bricks are based on price alone, not time, therefor the Renko bricks will not be aligned with the chart's time. They are extremely useful for trend trading and many different strategies can be formed from them. Buffers are provided allowing you t
Infinity Trend Pro
Yaroslav Varankin
1 (1)
This is a trend indicator without redrawing Developed instead of the binary options strategy (by the color of the Martingale candlestick) Also works well in forex trading When to open trades (binary options) A signal will appear in the place with a candle signaling the current candle It is recommended to open a deal for one candle of the current timeframe M1 and M5 When a blue dot appears, open a deal up When a red dot appears, open a trade down. How to open trades on Forex. When a signal is rec
Auto Fibo Pro m
DMITRII GRIDASOV
"Auto FIBO Pro" Crypto_Forex 지표 - 거래에 유용한 보조 도구입니다! - 지표는 자동으로 Fibo 수준과 로컬 추세선(빨간색)을 계산하여 차트에 배치합니다. - Fibonacci 수준은 가격이 반전될 수 있는 주요 영역을 나타냅니다. - 가장 중요한 수준은 23.6%, 38.2%, 50%, 61.8%입니다. - 역전 스캘핑이나 존 그리드 거래에 사용할 수 있습니다. - Auto FIBO Pro 지표를 사용하여 현재 시스템을 개선할 수 있는 기회도 많습니다. - Info Spread Swap Display가 있습니다. 현재 Spread와 Swap이 부착된 외환 쌍을 표시합니다. - 디스플레이에는 계정 잔액, 자본 및 마진도 표시됩니다. - 차트의 어느 모서리에서나 Info Spread Swap Display를 찾을 수 있습니다. 0 - 왼쪽 상단 모서리, 1 - 오른쪽 상단, 2 - 왼쪽 하단, 3 - 오른쪽 하단. 여기를 클릭하여 고품질 트레이딩 로봇과
Alpha Trend sign has been a very popular trading tool in our company for a long time. It can verify our trading system and clearly indicate trading signals, and the signals will not drift. Main functions: Based on the market display of active areas, indicators can be used to intuitively determine whether the current market trend belongs to a trend market or a volatile market. And enter the market according to the indicator arrows, with green arrows indicating buy and red arrows indicating se
PipFinite Trend PRO
Karlo Wilson Vendiola
4.88 (2248)
Breakthrough Solution For Trend Trading And Filtering With All Important Features Built Inside One Tool! Trend PRO's smart algorithm detects the trend, filters out market noise and gives entry signals with exit levels. The new features with enhanced rules for statistical calculation improved the overall performance of this indicator. Important Information Revealed Maximize the potential of Trend Pro, please visit www.mql5.com/en/blogs/post/713938 The Powerful Expert Advisor Version Automatin
Forex Gump
Andrey Kozak
2.4 (5)
Forex Gump is a fully finished semi-automatic trading system. In the form of arrows, signals are displayed on the screen for opening and closing deals. All you need is to follow the instructions of the indicator. When the indicator shows a blue arrow, you need to open a buy order. When the indicator shows a red arrow, you need to open a sell order. Close orders when the indicator draws a yellow cross. In order to get the most effective result, we recommend using the timeframes H1, H4, D1. There
PinBar Pattern mk
DMITRII GRIDASOV
MT4용 Crypto_Forex 지표 PINBAR 패턴, 재도색 및 지연 없음. - "PINBAR 패턴" 지표는 가격 변동 거래에 매우 강력한 지표입니다. - 이 지표는 차트에서 다음과 같은 핀바를 감지합니다. - 상승 핀바 - 차트에 파란색 화살표 신호(그림 참조). - 하락 핀바 - 차트에 빨간색 화살표 신호(그림 참조). - PC, 모바일 및 이메일 알림 기능 제공. - "PINBAR 패턴" 지표는 지지/저항 레벨과 결합하기 매우 좋습니다. ................................................................................ 여기를 클릭하여 고품질 트레이딩 로봇과 지표를 확인하세요! MQL5 웹사이트에서만 제공되는 오리지널 상품입니다.
Smart Price Action Concepts
Issam Kassas
4.75 (12)
우선적으로, 이 거래 도구는 전문적인 거래에 이상적인 비-다시 그리기 및 지연되지 않는 지표입니다.  온라인 강좌, 사용자 매뉴얼 및 데모. 스마트 가격 액션 컨셉트 인디케이터는 신규 및 경험 많은 트레이더 모두에게 매우 강력한 도구입니다. Inner Circle Trader Analysis 및 Smart Money Concepts Trading Strategies와 같은 고급 거래 아이디어를 결합하여 20가지 이상의 유용한 지표를 하나로 결합합니다. 이 인디케이터는 스마트 머니 컨셉트에 중점을 두어 대형 기관의 거래 방식을 제공하고 이동을 예측하는 데 도움을 줍니다.  특히 유동성 분석에 뛰어나 기관이 어떻게 거래하는지 이해하는 데 도움을 줍니다. 시장 트렌드를 예측하고 가격 변동을 신중하게 분석하는 데 탁월합니다. 귀하의 거래를 기관 전략에 맞추어 시장의 동향에 대해 더 정확한 예측을 할 수 있습니다. 이 인디케이터는 시장 구조를 분석하고 중요한 주문 블록을 식별하고 다양한
The Th3Eng PipFinite indicator is based on a very excellent analysis of the right trend direction with perfect custom algorithms. It show the true direction and the best point to start trading. With StopLoss point and Three Take Profit points. Also it show the right pivot of the price and small points to order to replace the dynamic support and resistance channel, Which surrounds the price. And Finally it draws a very helpful Box on the left side on the chart includes (take profits and Stop loss
Magic Balance
Daniil Evstratenko
The indicator shows which trading pairs, strategies, robots and signals that you use are profitable and which are not. The statistic of trades and balance graph are displayed in the account currency and pips - to switch simply click on the graph. button "$"(top left) - minimize/expand and move the indicator panel button ">"(bottom right) - stretching and resetting to the original size Statistic of trades 1 line - account balance, current profit and lot of open trades; 2 line - the number of all
MT4용 Crypto_Forex 지표 "WPR 및 2개 이동 평균", 리페인트 없음. - WPR 자체는 스캘핑에 가장 적합한 오실레이터 중 하나입니다. - "WPR 및 2개 이동 평균" 지표를 사용하면 WPR 오실레이터의 빠른 이동 평균과 느린 이동 평균을 확인할 수 있습니다. - 지표는 가격 조정을 매우 조기에 파악할 수 있는 기회를 제공합니다. - 이 지표는 매개변수를 통해 매우 쉽게 설정할 수 있으며, 모든 시간대에서 사용할 수 있습니다. - 그림에서 매수 및 매도 진입 조건을 확인할 수 있습니다. - 매수 신호 조건을 고려하세요. (1) - 빠른 이동 평균이 느린 이동 평균을 상향 교차하고 WPR 값이 -50 미만인 경우: 매수 포지션을 개시합니다. (2) - WPR 값이 -20 이상의 과매수 구간에 있는 경우: 매수 포지션을 청산합니다. (3) - 매도 포지션의 경우 그 반대입니다. // 훌륭한 트레이딩 로봇과 지표는 여기에서 확인하실 수 있습니다: https://ww
Trend PA
Mikhail Nazarenko
5 (3)
The Trend PA indicator uses   Price Action   and its own filtering algorithm to determine the trend. This approach helps to accurately determine entry points and the current trend on any timeframe. The indicator uses its own algorithm for analyzing price changes and Price Action. Which gives you the advantage of recognizing, without delay, a new nascent trend with fewer false positives. Trend filtering conditions can be selected in the settings individually for your trading style. The indicator
Next level of trend trading here. Possibility 75%, the indicator analyzes the current market to determine short (small dot), middle (circle with a dot inside) and long (cross with a circle and a dot inside) trends.  Wingdings characters of  Aqua color represents the beginning of the UP trend. Wingdings characters of  Orange color represents the beginning of the DOWN trend. Possibility 75% Indicator will improve your trading in the world of forex, commodities, cryptocurrencies and indices.
ZhiBiCCI MT4
Qiuyang Zheng
[ZhiBiCCI] indicators are suitable for all cycle use, and are also suitable for all market varieties. [ZhiBiCCI] Green solid line is a reversal of bullish divergence. The green dotted line is a classic bullish divergence. [ZhiBiCCI] The solid line to the red is a reverse bearish divergence. The red dotted line is a classical bearish divergence. [ZhiBiCCI] can be set in the parameters (Alert, Send mail, Send notification), set to (true) to send instant signals to the alarm window, email, insta
Noize Absorption Index MT4
Ekaterina Saltykova
5 (1)
Noize Absorption Index - is the manual trading system that measures the difference of pressure between bears forces and bulls forces. Green line - is a noize free index that showing curent situation. Zero value of index shows totally choppy/flat market.Values above zero level shows how powerfull bullish wave is and values below zero measures bearish forces.Up arrow appears on bearish market when it's ready to reverse, dn arrow appears on weak bullish market, as a result of reverse expectation. S
Renko, Heiken Ashi, Ticks Bar, Range Bar.    Easy switching, easy setup, all in one window.        Place the Custom Chart indicator and view Renko, Heiken Ashi, Tick bar, Range bar charts in real time at real chart.    Position the offline chart window so that the indicator control panel is visible.    Switch the chart mode by click of a button.    Connect to the output chart any indicator, expert advisor without any restrictions.    No, it doesn't work in the tester.    Yes, you can use an
For sure, this indicator has become very popular amongst traders. Through coding this indicator will give you the most accurate levels possible for your trading analysis. We have also added in the ability for you to receive alerts when the price breaks above or below a Support or Resistance lines! HOW TO USE The red rectangles represent your resistance/supply zone. The green rectangles represent your support/demand zone.  BONUS FEATURES We coded this indicator with the ability to switch between
Easy Trade indicator
Felipe Carvalho De Queiroz
Easy Trade Indicator – Your Path to Profitable Trades! Work any Time Frame! Maximize your profits with precise and assertive trades! ️ Trade with comfort – the indicator does the analysis and you only open the order in the direction in which the indicator shows you!  Exclusive panel with past trade counter and accuracy tracking! Simplify your analysis, boost your performance, and trade with confidence! Get it now and take your trading to the next level
PABT Pattern Indicator - it's classical system one of the signal patterns. Indicator logic - the Hi & Lo of the bar is fully within the range of the preceding bar, look to trade them as pullback in trend. In the way if indicator found PABT pattern it's drawing two lines and arrow what showing trend way.  - First line - it's entry point and drawing at: 1. On the high of signal bar or on middle of the signal bar (depending from indicator mode) for buy; 2. On the low of signal bar or on middle of t
QuantumEdge Trader
Hossam Ali Ahmed Ali
QuantumEdge Trader v1.0 AI-Powered Precision Signals for Serious Traders QuantumEdge Trader is a smart and reliable indicator that delivers accurate BUY and SELL signals using advanced market analysis and trend detection. Designed for M1 to M60 timeframes, it's ideal for scalping and intraday strategies. --- Key Features: No Repaint – Signals never change after appearing Smart trend filters to reduce noise Adjustable sensitivity and alerts Perfect for XAUUSD, EURUSD, and m
FreqoMeterForecast
Stanislav Korotky
The main idea of this indicator is rates analysis and prediction by Fourier transform. Indicator decomposes exchange rates into main harmonics and calculates their product in future. You may use the indicator as a standalone product, but for better prediction accuracy there is another related indicator - FreqoMaster - which uses FreqoMeterForecast as a backend engine and combines several instances of FreqoMeterForecast for different frequency bands. Parameters: iPeriod - number of bars in the ma
이 제품의 구매자들이 또한 구매함
Meravith
Ivan Stefanov
5 (1)
이 인디케이터는 각 지점에서 볼륨을 분석하고 해당 볼륨에 대한 시장의 피로 레벨을 계산합니다. 이 인디케이터는 세 개의 라인으로 구성됩니다: 강세 볼륨 피로 라인 약세 볼륨 피로 라인 시장 추세를 나타내는 라인. 이 라인은 시장이 강세인지 약세인지에 따라 색이 변합니다. 원하는 시작 지점에서 시장을 분석할 수 있습니다. 볼륨 피로 라인에 도달하면 다음 분석을 시작할 새 지점을 식별하세요. 트렌드와 수정 모두 분석할 수 있습니다. 좋은 접근 방법은 트렌드 라인에 도달하거나 고점 또는 저점에 도달할 때마다 인디케이터를 이동시키는 것입니다. 트렌드 라인과 볼륨 피로 라인 간의 거리가 클수록 해당 방향의 볼륨이 더 큽니다. 트렌드 라인은 주문을 열기 위한 장소로 사용할 수 있으며, 피로 라인은 수익을 얻는 데 사용됩니다. 이 시스템은 정말 독특하지만 매우 직관적입니다. 시장에는 비슷한 제품이 없습니다. 사용에 제한이 없습니다. 모든 시장과 모든 시간 프레임에서 적용할 수 있습니다. 중요:
BinaryIndicator
Andrey Spiridonov
BinaryIndicator is a highly accurate indicator for trading binary options. It shows excellent results in scalping. This indicator is based in multifactor analysis of trend indicators, as well as confirmation oscillators, which in the end gives an increased accuracy of signals. Advantages of the indicator Increased accuracy of signals. Excellent results when trading binary options with a short expiration time from M30 to M1 . It works on any timeframes. Works with any trade symbols. Parameters
BinaryUniversal
Andrey Spiridonov
BinaryUniversal is a signal indicator for binary options and Forex. In its work, the indicator uses a complex algorithm for generating signals. Before forming a signal, the indicator analyzes volatility, candlestick patterns, important support and resistance levels. The indicator has the ability to adjust the accuracy of the signals, which makes it possible to apply this indicator for both aggressive and conservative trading. The indicator is set in the usual way, it works on any time period and
This indicator is a multifunctional technical analysis tool based on the combination of an adaptive exponential moving average and volatility filters calculated through the Average True Range (ATR). It is designed to accurately identify the current price direction, highlight key trend reversal areas, and visualize potential turning zones. The algorithm is built upon the dynamic construction of a trend ribbon using two levels of volatility — outer and inner ranges. The outer boundaries serve as i
MACD Currency Meter
Emir Revolledo
4.6 (35)
MACDneun gajang ingi issneun momenteom mich chuse jipyo jung hanaibnida. tonghwa gangdo cheugjeong-gineun yeoleo tonghwaleul giban-eulo haneun chuse jipyoigido habnida. MACD tonghwa gangdo cheugjeong-gineun MACD mich tonghwa gangdo cheugjeong-giui algolijeum-eul gajin hanaui chateu jipyoibnida. ttohan won keullig gineung-i iss-eo daesibodeue 28gaeui juyo ssang-gwa bojo ssang-i pyosidoemyeo teugjeong ssang-eul keullighamyeon chateuga jadong-eulo seontaeghan chateulo byeongyeongdoebnida. jepum ja
#EasyWayTradePanel indicator for #MetaTrader4 , is trade assistants for manual trading in any #currency in #FOREX , #CRYPTOCURRENCY as #Bitcoin , #Ethereum , #Lightcoin and more. Also is EasyWay to use for #COMMODITY as #Gold , #Silver , #Oil , #Gas ...... and #CFDs . When installed on the chart in your chosen time frame and trading tool, the indicator automatically draws the following custom indicators used in the EasyWayTradePanel trading strategy. 1) Zigzag_Extreme_Indicator, 2) Regression_C
Rtc ML Ai Predictor MT4
Muhammad Faisal Sagala
Rtc ML Ai | Predictor CORE MACHINE LEARNING ENGINE Adaptive ML Market Predictor – Multi-Bar Trend & Candle Forecast What This Indicator Does This indicator is a  real-time market prediction engine  designed to analyze price behavior and estimate  future market tendencies . Unlike conventional indicators, this system  does not rely on static parameters or historical curve-fitting , but adapts its internal state dynamically during live market operation. Instead of using static rules, the indic
This is a mini One pair version of Advanced Detector of Trend Reversal and Continuance known as TrueTrendStarM(TTSm25). It is a sensitive and Predictive indicator of Price Trends for Professional traders.  ( ATTENTION BUYERS:-Now the indicator is available for UNLIMITED TIME ONE TIME buy of just $500 ). Avail the Opportunity.    It detects high odds changes in Price Trend direction long before other indicator detects it. I have been working on it since 2019.    This is possible due to fractal
FFx Engulfing Setup Alerter gives trade suggestions with Entry, Target 1, Target 2 and StopLoss. Below are the different options available: Entry suggestion - pips to be added over the break for the entry 3 different options to calculate the SL - by pips, by ATR multiplier or at the pattern High/Low 3 different options to calculate the 2 TPs - by pips, by ATR multiplier or at Risk/Reward Offset the dashboard - any place on the chart Remove the suggestion once the price reached the SL line Lines
FFx InsideBar Setup Alerter gives trade suggestions with Entry, Target 1, Target 2 and StopLoss. Below are the different options available: Entry suggestion - pips to be added over the break for the entry Minimum candle size - to avoid too close buy/sell entry suggestions 3 different options to calculate the SL - by pips, by ATR multiplier or at the pattern High/Low 3 different options to calculate the 2 TPs - by pips, by ATR multiplier or at Risk/Reward Offset the dashboard - any place on the c
FFx OutsideBar Setup Alerter gives trade suggestions with Entry, Target 1, Target 2 and StopLoss. Below are the different options available: Entry suggestion - pips to be added over the break for the entry. 3 different options to calculate the SL - by pips, by ATR multiplier or at the pattern High/Low. 3 different options to calculate the 2 TPs - by pips, by ATR multiplier or at Risk/Reward. Offset the dashboard - any place on the chart. Remove the suggestion once the price reached the SL line.
FFx PinBar Setup Alerter gives trade suggestions with Entry, Target 1, Target 2 and StopLoss. Below are the different options available: Entry suggestion - pips to be added over the break for the entry Minimum candle size - to avoid too small candles 3 different options to calculate the SL - by pips, by ATR multiplier or at the pattern High/Low 3 different options to calculate the 2 TPs - by pips, by ATR multiplier or at Risk/Reward Offset the dashboard - any place on the chart Remove the sugges
Lineverse Trendlines
Arkady Segal
5 (1)
Automatic, live & interactive picture of all trendlines. Assign push, email and sound alerts to the lines of your choice and be informed about price rollback, breakout, rollback after breakout, number of rollbacks, line expiration by double breakout. Correct, drag or delete the lines and interactively tune the line system. https://youtu.be/EJUo9pYiHFA . Chart examples https: //www.mql5.com/en/users/efficientforex Price Interaction Events All events are effective immediately and only after one
FFx MACD Divergences
Eric Venturi-Bloxs
The purpose of this new version of the MT4 standard indicator provided in your platform is to display in a sub-window multiple timeframes of the same indicator with its divergences. See the example shown in the picture below. But the display isn't like a simple MTF indicator. This is the real display of the indicator on its timeframe. Here's the options available in the FFx divergences indicator: Select the timeframes to be displayed (M1 to Monthly) Define the width (number of bars) for each tim
FFx RSI Divergences
Eric Venturi-Bloxs
The purpose of this new version of the MT4 standard indicator provided in your platform is to display in a sub-window multiple timeframes of the same indicator with its divergences. See the example shown in the picture below. But the display isn't like a simple MTF indicator. This is the real display of the indicator on its timeframe. Here's the options available in the FFx divergences indicator: Select the timeframes to be displayed (M1 to Monthly) Define the width (number of bars) for each tim
FFx CCI Divergences
Eric Venturi-Bloxs
The purpose of this new version of the MT4 standard indicator provided in your platform is to display in a sub-window multiple timeframes of the same indicator with its divergences. See the example shown in the picture below. But the display isn't like a simple MTF indicator. This is the real display of the indicator on its timeframe. Here's the options available in the FFx divergences indicator: Select the timeframes to be displayed (M1 to Monthly). Define the width (number of bars) for each ti
The FFx Dashboard MTF alerter will show you on a single chart all the timeframes (M1 to Monthly) with their own status for the indicator. 2 Alert Options: Single timeframe: each selected timeframe alert separately when a signal occurs Multi timeframes: all selected timeframes must agree for an alert to be triggered Both options have an input to select the timeframes to be used for the alert(s). How to Understand the Status: Green/Red square: histogram above/below 0 line Green square + Red bord
The FFx Dashboard MTF alerter will show you on a single chart all the timeframes (M1 to Monthly) with their own status for the indicator. 2 Alert Options: Single timeframe: each selected timeframe alert separately when a signal occurs Multi timeframes: all selected timeframes must agree for an alert to be triggered Both options have an input to select the timeframes to be used for the alert(s). How to understand the status: Green/Red square: RSI above/below 50 line Green square + Red border: R
The FFx Dashboard MTF alerter will show you on a single chart all the timeframes (M1 to Monthly) with their own status for the indicator. 2 Alert Options: Single timeframe: each selected timeframe alert separately when a signal occurs Multi timeframes: all selected timeframes must agree for an alert to be triggered Both options have an input to select the timeframes to be used for the alert(s). How to understand the status: Green/Red square: Stoch above/below 50 line Green square + Red border:
The FFx Dashboard MTF alerter will show you on a single chart all the timeframes (M1 to Monthly) with their own status for the indicator. 2 Alert Options: Single timeframe: each selected timeframe alert separately when a signal occurs Multi timeframes: all selected timeframes must agree for an alert to be triggered Both options have an input to select the timeframes to be used for the alert(s). How to understand the status: Green/Red square: Price above/below Cloud (Kumo) Green square + Red bo
The FFx Dashboard MTF alerter will show you on a single chart all the timeframes (M1 to Monthly) with their own status for the indicator. 2 Alert Options: Single timeframe: each selected timeframe alert separately when a signal occurs Multi timeframes: all selected timeframes must agree for an alert to be triggered Both options have an input to select the timeframes to be used for the alert(s). How to understand the status: Green/Red square: MA pointing Up/Down Green square + Red border: MA po
The FFx Dashboard MTF alerter will show you on a single chart all the timeframes (M1 to Monthly) with their own status for the indicator. 2 Alert Options: Single timeframe: each selected timeframe alert separately when a signal occurs. Multi timeframes: all selected timeframes must agree for an alert to be triggered. Both options have an input to select the timeframes to be used for the alert(s). How to understand the status: Green square: Price above PSAR Red square: Price below PSAR Options
The FFx Dashboard MTF alerter will show you on a single chart all the timeframes (M1 to Monthly) with their own status for the indicator. 2 Alert Options: Single timeframe: each selected timeframe alert separately when a signal occurs Multi timeframes: all selected timeframes must agree for an alert to be triggered Both options have an input to select the timeframes to be used for the alert(s). How to understand the status: Green/Red square: CCI above/below levels (ie. 100/-100) Grey square: C
The FFx Dashboard MTF alerter will show you on a single chart all the timeframes (M1 to Monthly) with their own status for the indicator. 2 Alert Options: Single timeframe: each selected timeframe alert separately when a signal occurs Multi timeframes: all selected timeframes must agree for an alert to be triggered Both options have an input to select the timeframes to be used for the alert(s). How to understand the status: Green/Red square: ADX above level Grey square: ADX below level Red bor
The FFx Dashboard MTF alerter will show you on a single chart all the timeframes (M1 to Monthly) with their own status. 2 Alert Options: Single timeframe: each selected timeframe alert separately when a signal occurs Multi timeframes: all selected timeframes must agree for an alert to be triggered Both options have an input to select the timeframes to be used for the alert(s). How to understand the status: Green/Red square: bullish/bearish candle Options available in the FFx Dashboard Alerter
THE GRAFF III
Antonin Skaryd
The [GRAFF] III manual trading system is based on multiple MetaTrader (MT4) indicators. Together, the entire PACK of GRAFF III indicators makes an advanced trading tool. The system consists of over 20 different custom-built indicators which have been carefully selected and tested in the long term to produce strong and efficient trading signals. The particular indicators are based on different mathematical formulas, so the entire system is calibrated to remove false signals from its own indicator
This indicator allows you to see the strength of the trend on all timeframes. It can be used for all currency pairs. The indicator can be displayed in the form of a column (from left to right): status buy / sell / strong buy / strong sell, strength of the trend in percentage, pips last candle, body candle now, remaining time, and the timeframe of M1 to MN. Information contained below (from left to right): total trend percent, sell percent, buy percent.
FFx Universal Strength Meter PRO is more than a basic strength meter. Instead of limiting the calculation to price, it can be based on any of the 19 integrated strength modes + 9 timeframes. With the FFx USM, you are able to define any period for any combination of timeframes. For example, you can set the dashboard for the last 10 candles for M15-H1-H4… Full flexibility! Very easy to interpret... It gives a great idea about which currency is weak and which is strong, so you can find the best pai
제작자의 제품 더 보기
Green Frog EA
Ramzi Abuwarda
제목: 최고의 프로페셔널 EA 전문가 - 그린 프로그 EA 외환 거래의 세계에서는 시장이 빠르고 결정적으로 움직이기 때문에 신뢰할 수 있는 동반자가 있으면 큰 차이를 만들 수 있습니다. 그린 프로그 EA를 소개합니다. 최고의 프로페셔널 전문가 어드바이저(EA)로, 뛰어난 정확성과 효율성으로 트레이더들을 지원합니다. 그린 프로그 EA는 최첨단 기술적 발전과 외환 산업에서의 경험을 결합한 결과물입니다. 경험 많은 트레이더들과 소프트웨어 엔지니어들로 구성된 팀에 의해 개발되었으며, 꾸준한 결과를 제공하고 상당한 수익을 창출합니다. 그린 프로그 EA의 차별점은 변화무쌍한 시장 상황에 대응할 수 있는 능력입니다. 정교한 알고리즘과 실시간 데이터 분석을 기반으로, 이 EA는 신속하게 수익성 있는 기회를 식별하고 높은 정밀도로 거래를 실행합니다. EA의 지능적인 트레이딩 전략은 트렌드, 변동성이 큰 시장, 그리고 레인지 시장과 같은 다양한 시장 상황에서도 최적의 성과를 보장합니다. 그린
믿을 수 없는 이진 옵션 지표를 사용하고 실수신호로 인해 손실과 좌절을 겪으신 적이 있으신가요? MT4 거래 플랫폼에서 사용 가능한 최고의 바이너리 옵션 지표, CLOCK INDICATOR를 찾으십시오! 고급 알고리즘과 강력한 기술적 분석 도구를 갖춘 CLOCK INDICATOR는 초보자와 숙련된 트레이더 모두에게 최고의 거래 도구입니다. 시장 트렌드를 정확히 예측하고 수익성 있는 거래 기회를 식별하여 이익을 극대화하고 손실을 최소화하는 데 도움이 됩니다. 다른 복잡하고 사용하기 어려운 이진 옵션 지표와 달리, CLOCK INDICATOR는 설치와 사용자 정의가 쉽습니다. 개별 거래 기호에 맞게 설정을 조정할 수 있으며, 모든 주요 통화 쌍과 시간대에서 원활하게 작동합니다. CLOCK INDICATOR의 뛰어난 특징 중 하나는 다시 그리지 않는 특성입니다. 신호가 생성되면 차트에 남아 있으므로 정확한 정보를 기반으로 한 투자 결정을 내리고 있다는 확신을 가질 수 있습니다.
SCALPER EA를 소개합니다. 급격한 인기를 끌고 있는 혁신적인 전문가 어드바이저(EA)로, 외환 거래 세계를 휩쓸었습니다. 2023년에는 SCALPER EA가 가장 수익성이 뛰어나는 EA로 등장하여, 트레이더들이 외환 시장에 접근하는 방식을 혁신적으로 바꾸었습니다. 단기 시장 변동을 활용하도록 설계된 SCALPER EA는 고급 알고리즘과 첨단 기술을 활용하여 신속한 정확도로 고성과 거래 기회를 식별합니다. 뛰어난 성과로 인해, 경험 많은 트레이더와 큰 수익을 추구하는 초보자들 모두에게 필수 도구로 평가받고 있습니다. 스마트한 자동화를 통해 SCALPER EA는 항상 경쟁자들을 앞섭니다. 변동성이 큰 시장 조건에서도 놀라운 수익을 창출하며, 신속하고 효율적으로 거래를 실행하여 수익 가능성을 최대화합니다. 이익 기회를 놓치지 않도록 해 주어 트레이더들에게 빠르게 변화하는 외환 거래 환경에서 경쟁 우위를 제공합니다. SCALPER EA를 다른 EA와 구별하는 점은 그 적응성입니다.
기적적인 외환 지표 소개: 정확한 트레이딩의 힘을 발휘하세요 모든 시간대에서 뛰어난 결과를 제공하는 최고의 외환 지표를 찾는데 지친 적이 있나요? 더 이상 찾을 필요가 없습니다! 기적적인 외환 지표가 도래하여 귀하의 트레이딩 경험을 혁신하고 수익을 새로운 고도로 끌어올립니다. 최첨단 기술과 수년간의 정성스런 개발을 토대로 기적적인 외환 지표는 외환 시장에서의 힘과 정확성의 정점으로 떠오릅니다. 이 탁월한 도구는 모든 수준의 트레이더의 요구를 충족시키고 지속적인 수익을 추구하는 데에서 비길 데 없는 우위를 제공하기 위해 설계되었습니다. 기적적인 외환 지표의 가장 큰 장점은 그 뛰어난 적응성에 있습니다. 당신이 데이 트레이더, 스윙 트레이더이든 장기 포지션을 선호하든, 이 지표는 모든 시간대에서 뛰어난 결과를 제공하기 위해 최적화되었습니다. 그러나 그 정확성과 시장의 복잡한 움직임을 포착하는 능력이 참으로 빛을 발하는 것은 1시간 기간대에서 사용할 때입니다. 기적적인 외환 지표의 정확성
MT4 "독수리 눈 지표"로 바이너리 옵션 거래의 가능성을 극대화하세요 메타트레이더 4(MT4)용 "독수리 눈 지표"를 활용하여 바이너리 옵션 거래의 혁명적인 세계에 도약해 보세요. 이 혁신적인 도구는 수술적인 정확성과 비교할 수 없는 수익성을 제공하여 거래 경험을 변화시킬 준비가 되어 있습니다. 잠재력의 경계가 깨지고 수익이 극대화되는 세계로 뛰어들어 보세요. 독수리 눈 지표의 뛰어난 정확성과 흔들림 없는 신뢰성 덕분에 시장의 숨겨진 비밀을 해결할 수 있습니다. 세심한 세부 사항에 주의를 기울여 개발된 이 최첨단 지표는 고급 알고리즘, 철저한 기술적 분석, 실시간 시장 데이터를 결합하여 탁월한 거래 이점을 제공합니다. 독수리 눈 지표는 시장의 포인트를 정확하게 파악하여 통찰력 있는 신속한 결정을 돕습니다. 직관적인 인터페이스와 사용하기 쉬운 디자인을 통해 초보 트레이더도 쉽게 바이너리 옵션의 복잡성을 탐색하고 이 도구의 엄청난 힘을 최대한 활용할 수 있습니다. 추측과 감정에 기반한
Swing X Black
Ramzi Abuwarda
SWING X Black은 Binary Options와 Forex 거래를 조화롭게 연결하여 두 시장에서 강력한 통찰력을 활용할 수 있는 유연성을 제공합니다. 이 상호 호환성은 거래자들이 선호하는 거래 스타일에 관계없이 정보에 입각한 결정을 내릴 수 있도록 보장하여 성공의 기회를 높이는 데 도움이 됩니다. SWING X Black의 핵심 강점은 탁월한 신호 생성 기능에 있습니다. 고급 알고리즘을 기반으로 하는 이 지표는 잠재적인 추세 반전, 지지 및 저항 영역, 그리고 돌파구를 정확하게 식별하여 거래자들에게 명확한 진입 및 퇴출 지점을 제공합니다. 이 정밀도는 거래자들이 최소한의 위험으로 수익성 있는 기회를 포착하는 데 큰 도움이 됩니다. 빠르게 변화하는 거래 환경을 잘 이해하여 설계된 SWING X Black은 15분의 타임프레임에서 가장 빛을 발합니다. 이 짧은 시간 동안 거래자들은 시장 움직임을 신속하게 분석하여 시장 조건의 변화에 ​​신속하게 대응할 수 있습니다. 15분의 만기
Market Secret
Ramzi Abuwarda
세계적인 바이너리 옵션 거래에서는 정확한 시장 분석과 전략적인 의사 결정이 핵심입니다. 수익성 있는 기회를 찾아내는 뛰어난 거래 지표를 찾는 여정은 끝이 없습니다. 비밀 지표(Secret Indicator)가 등장합니다 - 최고이며 강력한 MT4 바이너리 옵션 거래 도구로서의 명성을 얻은 주목할 만한 도구입니다. 비밀 지표는 경험있는 트레이더와 전문 프로그래머들로 구성된 팀에 의해 수년간의 세심한 연구, 개발 및 테스트를 통해 만들어졌습니다. 독특한 알고리즘과 고급 수학적 모델은 바이너리 옵션의 빠른 속도로 변동하는 세계에서 트레이더에게 무적의 이점을 제공하기 위해 정교하게 조정되었습니다. 비밀 지표를 다른 거래 지표와 구분 짓는 특징은 놀라운 정확도로 수익성 있는 거래 기회를 발견하는 능력입니다. 이 신호는 강력한 기술적 지표, 가격 행동 분석 및 시장 감성 평가의 조합에서 유도됩니다. 이 다각적 접근법은 비밀 지표가 단기 변동과 장기 추세 모두를 포착하여 트레이더에게 시장의
**바이너리 스마트 시스템 소개: 귀하의 궁극적인 트레이딩 파트너** 바이너리 스마트 시스템은 단순히 인디케이터가 아닙니다. 이는 정교한 트레이딩 도구로, 다양한 시장에서 핀포인트 정확도와 적시의 신호를 제공하여 트레이더에게 성공을 이끌어주는 데 주안점을 둔 것입니다. 혁신적인 알고리즘과 다양한 기술적 지표의 철저한 컬렉션을 기반으로 구축된 이 시스템은 트레이딩 성공을 얻기 위한 열쇠입니다. **인디케이터 구성 요소:** 1. **이동 평균 비율 (MAP):** 이 구성 요소는 다양한 이동 평균의 가중 평균을 계산하여 추세 식별을 위한 강력한 기준을 형성합니다. MAP은 시장 상황에 동적으로 적응하여 현재 추세 방향을 파악하는 정보를 제공합니다. 2. **상품 채널 지수 (CCI):** 평균 가격으로부터의 편차를 분석함으로써 CCI는 과매수 및 과매도 조건을 판단합니다. 바이너리 스마트 시스템의 CCI 통합은 잠재적인 반전 지점을 식별하는 종합적인 접근을 보장합니다. 3.
소개: 바이너리 옵션과 외환 거래의 빠르게 변화하는 세계에서, 성공과 실패의 차이를 만들 수 있는 도구와 전략을 갖추는 것이 중요합니다. 이러한 도구 중 하나는 BBB 블랙 블루 바이너리 옵션 지표 시스템으로, 차트 패턴, 이동 평균, 거래량을 결합하여 거래자가 정보에 입각한 결정을 내릴 수 있도록 하는 혁신적인 접근 방식입니다. 이 포괄적인 가이드에서는 BBB 시스템의 세부 사항을 설명하고, 작동 방식, 언제 사용해야 하는지, 그리고 어떻게 하면 거래 성과를 향상시킬 수 있는지 설명합니다. BBB 지표 시스템 설명: BBB 블랙 블루 바이너리 옵션 지표 시스템은 바이너리 옵션과 외환 거래의 최적의 진입 및 퇴출 지점을 식별하는 데 도움이 되는 정교한 기술적 분석 도구입니다. 이 시스템은 "블랙"과 "블루"라는 주요 신호를 나타내는 기본 구성 요소에서 이름을 따왔습니다. 차트 패턴: BBB 시스템은 거래 차트의 계산된 부분을 분석하여 시작합니다. 이는 가격 행동에서 특정 패턴이나 형
메트로 역": 성공적인 자동 거래로의 길 "메트로 역"은 첨단 기법과 지능적인 알고리즘의 교차점에서 작동하는 선두주의적인 MT4 자동 거래 신호로, 정밀 거래의 세계로 진입할 수 있습니다. "메트로 역"은 이동 평균(MA), 상대 강도 지수(RSI), 스토캐스틱 오실레이터, 모멘텀 및 평균 방향 지수(ADX)의 힘을 활용하여 웰 인포메드 거래 신호를 생성합니다. 이는 지도를 찾는 초보 트레이더와 거래 과정을 간소화하려는 숙련된 트레이더 모두를 위해 설계되었습니다. "메트로 역"의 기능 핵심에는 이러한 중요한 기술적 지표를 결합하는 독특한 전략이 있으며, 데이터 기반 인사이트의 조화로운 수렴을 야기합니다. 이동 평균은 기본적인 트렌드 분석을 제공하며, 시장 소음을 걸러내고 가격 움직임의 실제 방향을 드러냅니다. 시장이 과매수 상태인지 과매도 상태인지 판단함으로써 RSI와 스토캐스틱 오실레이터는 가능한 반전이나 계속에 대한 예측을 돕는 추가적인 확증 수준을 제공합니다. 한편 모멘텀은 "
Forex 및 바이너리 옵션 성공을 위한 궁극적인 가이드: 비 다시 그리는 XY 트렌드 지표 공개 서론: Forex 및 바이너리 옵션 거래의 역동적인 세계에서 한발 앞선다는 것은 가장 중요합니다. 거래자들은 지속적으로 경쟁력 있는 우위를 제공할 수 있는 도구를 찾고 있으며, 거래 커뮤니티에서 파장을 일으키고 있는 그러한 강력한 도구 중 하나는 "비 다시 그리는 XY 트렌드" 지표입니다. 지표 이해: 비 다시 그리는 XY 트렌드 지표를 다른 지표와 구별하는 핵심 기능 중 하나는 정확성에 대한 약속입니다. 과거 신호를 다시 그려 거래자에게 신뢰할 수 없는 데이터를 남길 수 있는 다른 많은 지표와 달리 이 지표는 무결성을 유지합니다. 거래자는 생성되는 신호에 대해 자신감을 가질 수 있으며 이러한 신호가 과거 가격 움직임을 정확하게 반영하고 있음을 알 수 있습니다. XY 트렌드 지표는 고급 알고리즘을 사용하여 가격 데이터를 분석하고 시장의 트렌드를 식별합니다. 노련한 거래자든 초보 거래자든
빠르게 변화하는 금융 시장에서 모든 초는 중요하며 모든 결정은 거래를 성사시키거나 망칠 수 있습니다. 바이너리 해커 지표(Binary Hacker Indicator)는 분 단위로 가격 움직임을 분석하는 방식을 혁신할 준비가 된 획기적인 도구입니다. 거래의 정밀도 밝히기: 바이너리 해커 지표는 일반적인 거래 도구가 아닙니다. 실시간 분석기 역할을 하며 차트의 각 분을 분석하여 트레이더에게 귀중한 통찰력을 제공합니다. 광범위한 수동 분석이 필요한 기존 지표와 달리 바이너리 해커는 거래 전략에서 추측 작업을 제거하고 순수 데이터에 기반한 계산된 접근 방식을 제공합니다. 매 분의 힘: 거래의 매 분을 분석하고 매수와 매도 압력 사이의 복잡한 균형을 이해할 수 있다고 상상해보세요. 바이너리 해커를 통해 이러한 비전이 현실이 됩니다. 이 독창적인 지표는 시장을 지속적으로 모니터링하고 매 분마다 상승 틱과 하락 틱의 수를 계산하여 가격 액션의 본질을 쉽게 이해할 수 있는 정보로 정제합니다. 독특
제목: GOLDEN SUN 123 TREND_Dashboard_With_Alert MT4 지표 공개 끊임없이 변화하는 금융 시장에서 트레이더들은 지속적으로 경쟁력 있는 우위를 제공하는 도구를 찾고 있습니다. 정확성과 수익성을 추구하는 과정에서 GOLDEN SUN 123 TREND_Dashboard_With_Alert MT4 지표는 기회의 표지로 빛을 발합니다. MetaTrader 4 플랫폼을 위해 설계된 이 놀라운 지표는 추세 추종 기능과 경고 메커니즘을 통해 전략적 거래의 정수를 담고 있습니다. 추세의 힘 활용하기: GOLDEN SUN 123 TREND_Dashboard_With_Alert MT4 지표는 시장 추세를 식별하고 활용하기 위한 정교한 도구입니다. 트레이더들은 추세가 수익성 있는 거래의 핵심임을 이해하며, 이 지표는 바로 그러한 역할을 위해 정교하게 제작되었습니다. 이 지표는 시장을 끊임없이 검사하여 상승, 하락 또는 범위 추세인지 여부를 즉시 인식합니다. 명확성의 대시
Elon Musk EA는 MACD 수준, MACD 다이버전스, 숨겨진 MACD 다이버전스 및 지능형 마틴게일 전략을 기반으로 한 혁신적인 트레이딩 도구입니다. 이전과는 다른 트레이딩 경험을 준비하셨나요? Elon Musk EA를 함께 사용하면 MACD 수준, 다양한 MACD 다이버전스, 숨겨진 MACD 다이버전스 및 뛰어난 지능형 마틴게일 시스템의 잠재력을 발휘할 수 있습니다. 이러한 탁월한 요소들을 활용하여 이 EA는 야심찬 트레이더에게 완벽한 파트너가 될 것입니다. 제한을 깨고 가능성을 재정의하며 전례없는 금융적 성공을 향한 여행을 준비하세요. Elon Musk EA의 탁월한 점은 정확성과 적응성에 있습니다. 첨단 알고리즘과 철저한 시장 분석을 통해 MACD 수준을 탁월한 정확도로 감지하여 수익을 얻을 수 있는 최적의 타이밍을 포착할 수 있습니다. MACD 다이버전스 및 숨겨진 다이버전스를 활용하여 수익성이 높은 진입 및 청산 포인트를 식별하여 항상 경쟁자보다 한 발 앞설 수 있
T-REX_EA 는 MT4용으로 설계된 강력한 인공지능 기반의 트레이딩 로봇으로, 다양한 고급 전략을 결합하여 꾸준한 수익을 제공합니다. 이 EA는 AI 기술과 돌파 전략, 캔들 패턴, 볼륨 프로파일, 수요 및 공급 영역을 사용하여 시장을 분석하고, 트레이드 진입과 출구 시점을 최적화합니다. 주요 특징: 멀티 전략 접근법 : AI 분석과 전통적인 돌파 전략, 캔들 패턴 인식을 결합하여 강력한 트레이딩 우위를 제공합니다. 볼륨 프로파일과 수요/공급 구역 : 볼륨 데이터를 사용하여 높은 확률의 트레이드를 정확하게 식별합니다. 터보 모드 : 변동성이 큰 시장 상황에서 트레이드 빈도와 잠재적 수익을 높이는 특별한 기능입니다. 다양한 통화쌍 거래 가능 : EA는 모든 통화쌍에서 거래할 수 있지만, 특히 EUR/USD, GBP/USD, USD/JPY와 같은 주요 통화쌍에서 높은 수익을 기대할 수 있습니다. 유연한 거래 설정 : 최소 $500 의 잔액으로 거래를 시작할 수 있으며, 이는 작은 계
AI TRADING SYSTEM for MT4 - 당신의 궁극적인 AI 구동 이익 기계! AI TRADING SYSTEM 으로 거래의 미래를 해방하십시오. 이것은 최첨단 전문가 어드바이저(EA)로, 강력한 AI 구동 전략을 사용하여 모든 통화 쌍의 이익을 극대화합니다. 다양성을 위해 설계되었지만, EUR/USD, GBP/USD, USD/JPY와 같은 주요 쌍 에서 뛰어난 성능 을 발휘하여 시장에서 앞서 나갈 수 있습니다. AI TRADING SYSTEM 에는 두 가지 별개의 거래 모드 가 있어 거래 스타일과 수익 목표에 맞게 조정할 수 있습니다. BACIS 모드 - 최소한의 위험으로 꾸준하고 안정적인 이익을 위해 균형 잡힌 접근 방식을 찾는 거래자에게 완벽합니다. TURBO 모드 - 공격적인 고수익 전략으로 이익을 높이고 싶은 사람들에게 이상적이며, 시장 모멘텀을 포착하는 데 적합합니다. 주요 기능: 사용자 정의 설정 : 수익 실현(TP), 손절(SL), 로트 크기 및 마틴게일 옵션
Binary Smart Eye
Ramzi Abuwarda
"Binary Smart Eye" MT4 지표는 바이너리 옵션 및 외환 시장 모두에 거래 신호를 제공하도록 설계되었으며, M1에서 W1까지 광범위한 시간 프레임에서 작동합니다. 추세 수준, 지능형 이동 평균 및 최적화된 거래 기간을 결합한 독점적인 전략을 사용하여 잠재적인 진입점을 식별합니다. 주요 기능에 대한 분석은 다음과 같습니다. 다중 시간 프레임 분석: 지표의 다용도성은 트레이더가 다양한 시간 프레임에서 이를 활용하여 M1의 스캘핑부터 W1의 장기 추세 추종까지 다양한 거래 스타일에 맞출 수 있도록 합니다. 독점 전략: "Binary Smart Eye"의 핵심은 다음을 활용하는 고유한 전략에 있습니다. 추세 수준: 이러한 수준은 주요 시장 추세 및 잠재적인 반전 지점을 식별하는 데 도움이 됩니다. 지능형 이동 평균: 시장 변동성에 적응하고 정확한 추세 방향을 제공하는 사용자 정의 이동 평균입니다. 스마트 거래 기간: 지표는 최적의 시장 조건을 포착하기 위해 특정 시간 기간을
Miraculous Indicator – Gann Square of Nine 기반 100% 비리페인트 Forex 및 바이너리 도구 이 영상은 Miraculous Indicator 를 소개합니다. 이 지표는 Forex 및 바이너리 옵션 트레이더를 위해 특별히 개발된 매우 정확하고 강력한 트레이딩 도구입니다. 이 지표가 독특한 이유는 전설적인 **Gann Square of Nine(Gann 9의 사각형)**과 **Gann's Law of Vibration(Gann 진동의 법칙)**에 기반을 두고 있기 때문입니다. 이는 현대 트레이딩에서 가장 정밀한 예측 도구 중 하나로 손꼽힙니다. Miraculous Indicator는 완전히 비리페인트(non-repaint) 됩니다. 즉, 캔들이 마감된 후에도 신호가 변경되거나 사라지지 않습니다. 보이는 것이 곧 결과입니다. 이는 트레이더가 자신감을 가지고 거래에 진입하고 청산할 수 있는 신뢰할 수 있고 일관된 기반을 제공합니다. 주요 특징: Gann
Traffic Signal
Ramzi Abuwarda
혁신적인 MT5 지표 '트래픽 신호'를 소개합니다 - 성공적인 트레이딩 세계로의 문을 열어드립니다! 정확성과 전문지식을 바탕으로 설계된 이 혁신적인 지표는 RSI, 스토캐스틱, CCI 및 모든 시간프레임의 트렌드 분석에 기반한 특별한 전략으로 가장 정확한 진입 신호를 생성합니다. 트래픽 신호는 무적의 자신감으로 시장을 탐색할 수 있도록 최상의 정확성을 제공합니다. 트래픽 신호를 통해 가장 수익성 높은 트레이딩 기회를 감지하기 위해 정밀하게 조정된 주요 기술적 지표의 철저한 분석에 접근할 수 있습니다. 불확실성에 작별을 고하고 정보 기반의 의사 결정의 새로운 시대를 맞이하세요. RSI, 스토캐스틱, CCI 및 트렌드의 잠재력을 트래픽 신호 내에서 완벽하게 융합하여 전례없는 시장의 역학을 생생하게 그려냅니다. 트래픽 신호를 통해 시장의 트렌드와 패턴을 쉽게 탐색하면서 모든 시간프레임을 주시할 수 있습니다. 단기적인 고조 또는 장기적인 전략적 플레이를 선호하든지, 이 뛰어난 지표는 여러분
Forex RoadMap
Ramzi Abuwarda
ROADMAP: 완벽한 거래 실행을 위한 귀하의 궁극적인 MT5 Forex 인디케이터! Forex 시장에서 지속적인 불확실성과 추측 작업에 지쳤나요? 정확한 진입 지점, 매수 및 매도 구간을 식별하거나 정확한 손실 제한과 이익 실현 수준을 설정하는 것이 어려운가요? 더 이상 찾지 마세요! ROADMAP은 혁신적인 MT5 Forex 인디케이터로 귀하의 거래 전략을 혁신할 수 있도록 지원합니다. ROADMAP은 특별한 전략으로 설계되어 Forex 시장을 돌파하는 데 필수적인 통찰력과 정확한 계산을 제공합니다. 이 탁월한 인디케이터는 Fibonacci(FIBO) 레벨을 포함한 고급 기술의 조합을 활용하여 최적의 거래 결정을 돕습니다. ROADMAP을 통해 뛰어난 정확성으로 시장 역학을 종합적으로 파악할 수 있으며, 이상적인 진입 영역을 정확하게 식별할 수 있습니다. 이는 수익성이 높은 기회를 놓치지 않고 조기에 거래에 참여할 수 있음을 의미합니다. 이 인디케이터의 창의적인 알고리즘은 시장
통화 마술사 매트릭스 인디케이터란 무엇인가요? 통화 마술사 매트릭스 인디케이터는 통화의 강도를 보여주는 그래픽 도구입니다. 일반적인 인디케이터는 보통 다른 통화와의 상대적인 강도를 보여줍니다. 그러나 일부 계산을 통해 각 개별 통화의 절대 강도를 찾아낼 수 있습니다. 따라서 통화 마술사 매트릭스 인디케이터(또는 미터)는 통화의 절대적인 강도를 표현하기 위한 도구로, 이 강도를 다른 통화의 강도와 비교할 수 있습니다. 통화의 절대 강도를 계산하는 방법은 여러 가지가 있지만, 일반적으로 다른 인디케이터의 모든 값들을 고려하여 추출하려고 합니다. 다시 말해, 예를 들어 JPY의 강도를 계산하기 위해 알고리즘은 JPY를 포함하는 모든 통화쌍에서 동일한 인디케이터의 값들을 분석합니다. 이 개념은 통화 마술사 매트릭스에 처음 접하는 경우에는 약간 혼란스러울 수 있지만, 걱정하지 마세요. 계속 읽다보면 이해하게 될 것입니다. 통화 마술사 매트릭스는 8개 주요 통화의 강도를 측정하기 위해 개발된
Darwin Assistant
Ramzi Abuwarda
혁신적인 MT5 지표인 DARWIN Assistant   을 소개합니다. 성공적인 거래의 세계로 가는 궁극적인 관문입니다! 정확성과 전문성으로 설계된 DARWIN Assistant   은 RSI, 스토캐스틱, CCI 및 추세와 같은 고급 기술 지표의 힘을 모든 시간대에 걸쳐 활용하는 특별한 전략에 따라 운영됩니다. 이 최첨단 지표는 진입을 위한 가장 정확한 신호를 제공하므로 비교할 수 없는 확신을 가지고 시장을 탐색할 수 있으므로 특별한 거래 경험에 대비하십시오. DARWIN 트래픽을 사용하면 가장 수익성이 높은 거래 기회를 감지할 수 있도록 세심하게 보정된 중요한 지표에 대한 포괄적인 분석에 액세스할 수 있습니다. 불확실성에 작별을 고하고 정보에 입각한 의사 결정의 새로운 시대를 맞이하십시오. RSI, Stochastics, CCI 및 Trends가 DARWIN Assistant   내에서 원활하게 수렴되어 전례 없는 시장 역학을 생생하게 보여줍니다. DARWIN Assist
필터:
리뷰 없음
리뷰 답변