Price CD HTB
- ユーティリティ
- バージョン: 1.24
- アップデート済み: 24 7月 2024
- アクティベーション: 7

Description
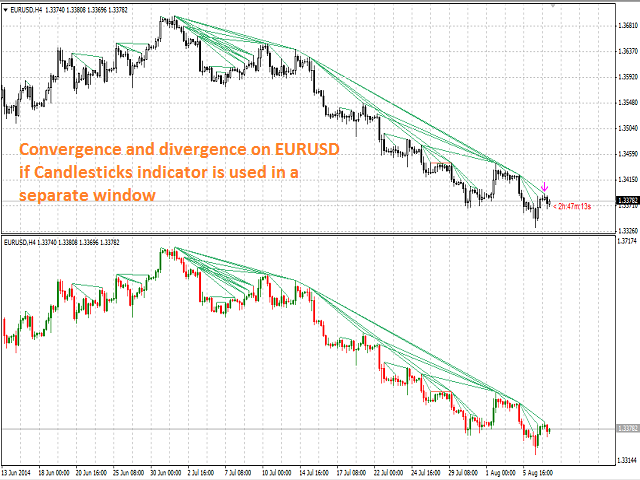
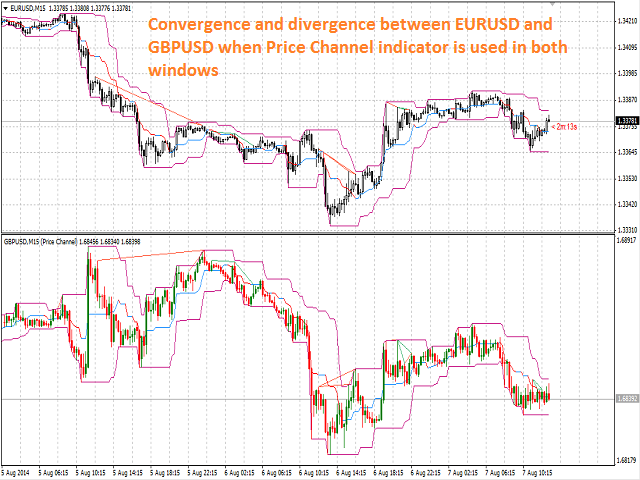
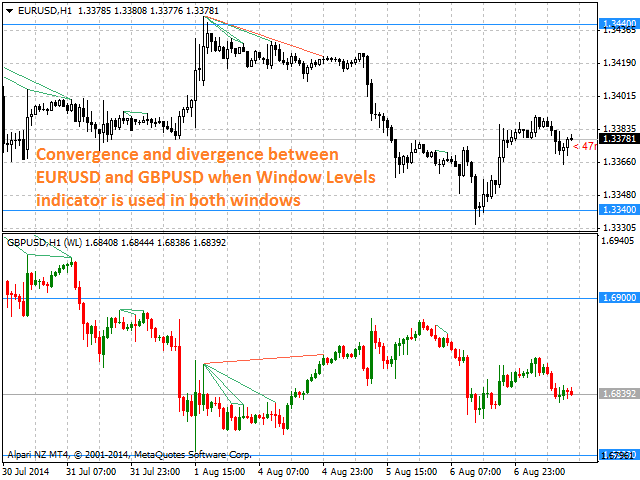
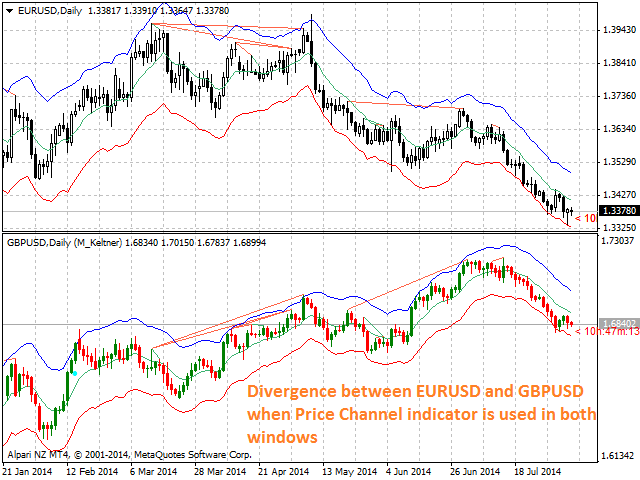
Price CD HTB (Price Convergence/Divergence High Top Bottom) is a innovative universal analytical bears indicator of convergence/divergence between financial instruments. The indicator is the first out of the two possible versions (HBT and HTB) of the bearish convergence/divergence origins.
Due to its multiple use feature, the indicator allows you to find convergences/divergences between the price of main financial instrument and other financial instruments simultaneously.
Users can select the sell graphical symbol and its width, as well as the color of convergence/divergence lines.
The indicator may be used with any broker, irrespective of the name of the financial instrument since it is necessary to manually enter the name as an input parameter. If you enter a non-existent or incorrect name of a financial instrument, you will receive an error message that this financial instrument is unknown (does not exist).
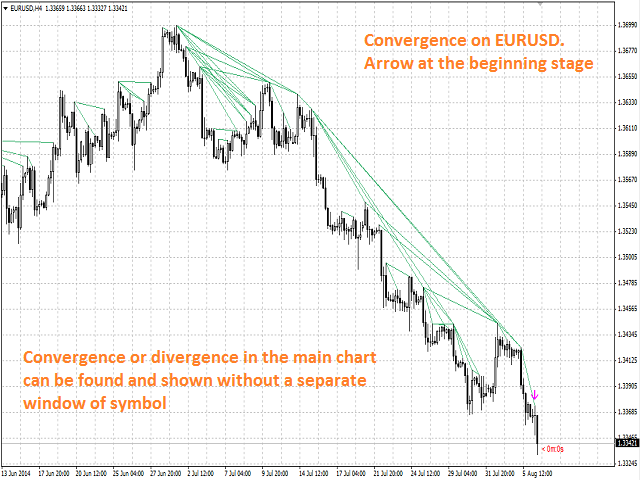
The indicator is not a lagging one. It works by ticks and is able to show convergence/divergence in the symbol's window even if there is no separate window with another financial instrument used for search. This allows you to open additional windows with any other indicators for a joint analysis.
As an option, the indicator can notify of a new signal using the graphical sell symbol instead of convergence/divergence lines.
In most cases, convergence/divergence is considered to be confirmed if it takes the form of a line with a graphical symbol remaining on the chart.
Searching of convergence/divergence on one financial instrument means searching of levels of support/resistance!
Attention: Since the indicator is downloaded, graphical symbols are displayed in the main window only after a new convergence/divergence signal appears (unlike convergence/divergence lines). Graphical symbols are not displayed for the past periods (before the indicator was downloaded).
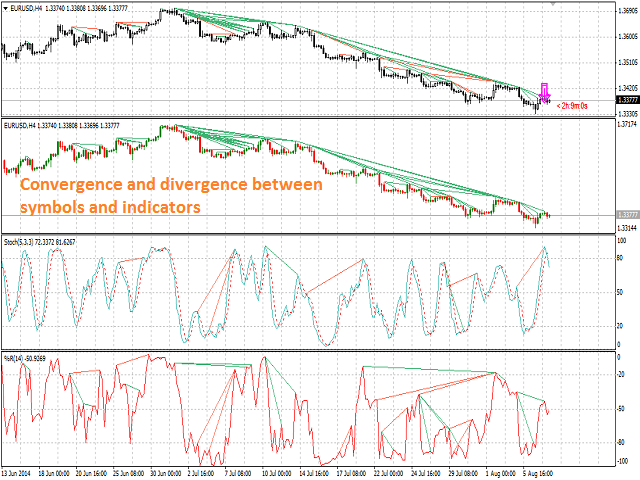
For plotting of lines of convergence/divergence in a separate window the indicator identifies one of any eleven custom indicators (pls. see input parameters) in the presence.
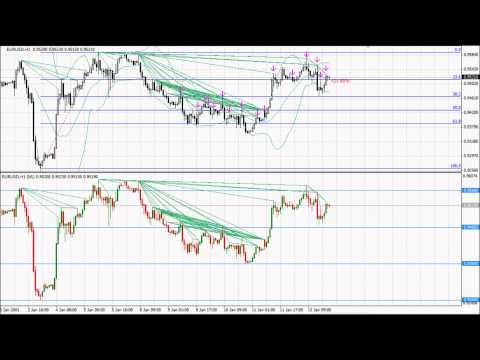
The indicator's operation is displayed in the attached video with sharing of indicators: Bollinger Bands, Fibo Levels, Price Levels.
The indicator can notify of the appearance of a formed signal by playing an audio signal and sending an e-mail, as well as display the time remaining until the end of the formation of the current bar in the format of <d:h:m:s, where:
- < - the current bar.
- d - days.
- h - hours.
- m - minutes.
- s - seconds.
Example of the e-mail notification:
- Subject: Price CD HTB Signal
- Message: Signal,M1 - Bearish Convergence between EURUSD and EURUSD - 2014.08.07 12:38:27
Purpose
The indicator can be used for manual or automated trading within an Expert Advisor. For automated trading, use the indicator buffer of the double type:
- Sell signal - buffer 0, must not be zero.
Input Parameters
- Currency_Name - name of financial instrument.
- Bars_Number - number of bars for calculation.
- Base_Indicator - basic indicator code (the parameter will be activated and used in case of custom indicator presence):
- 0 - Candlesticks.
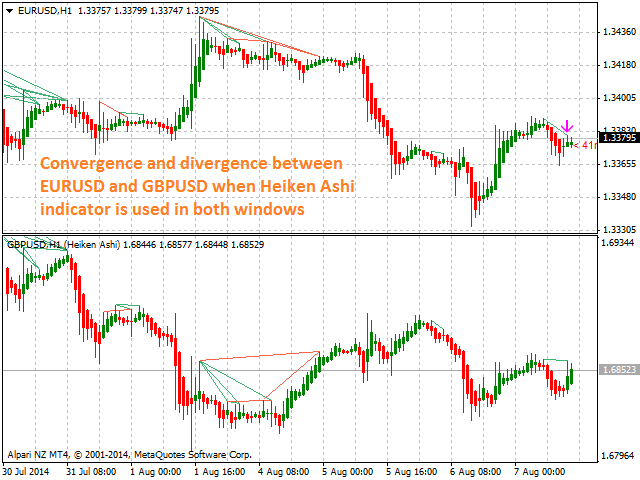
- 1 - Heiken Ashi Multicurrency.
- 2 - Window Price Channel.
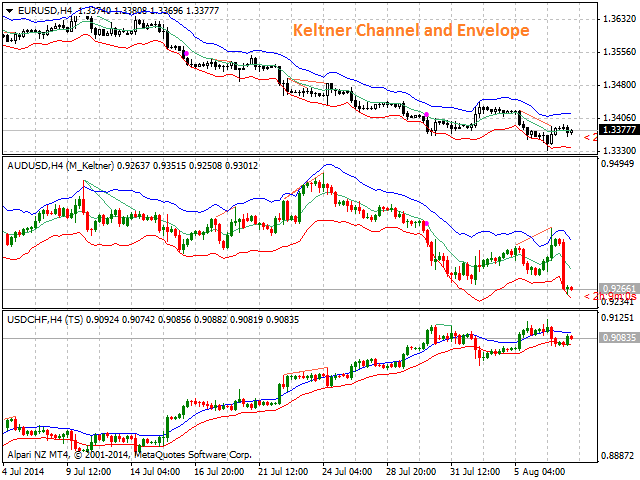
- 3 - Keltner Channel Multicurrency.
- 4 - Tools Standard.
- 5 - Window Levels.
- 6 - Heiken Ashi Levels.
- 7 - Pivot System.
- 8 - Heiken Ashi Pivot.
- 9 - Fibo Levels Multicurrency.
- 10 - Heiken Ashi Fibo Levels.
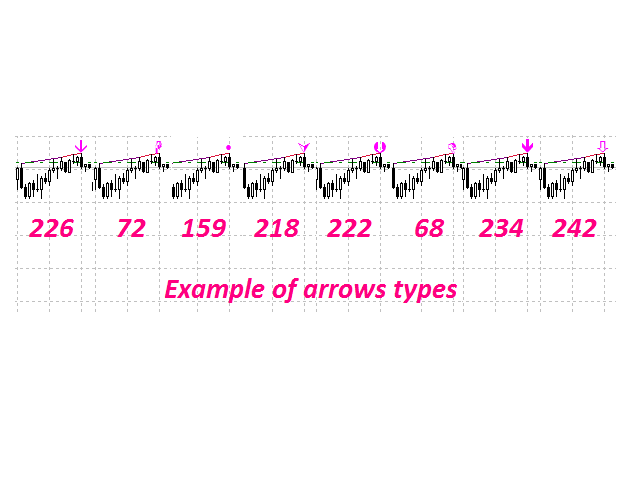
- Arrow_Symbol - graphical sell symbol type (recognizes one of the eight user-defined symbols, see the screenshot):
- 68
- 72
- 159
- 218
- 222
- 226 (by default)
- 234
- 242
- Arrow_Width - graphical symbol width (allowable values - 1, 2, 3, 4 and 5).
- Sound_Mail_Numbers - number of sound and e-mail notification on two last bars.
- DrawLine - display of convergence/divergence line.
- true - draw the lines (by default).
- false - do not draw the lines.
- Convergence - calculating convergence or divergence:
- true - convergence (by default).
- false - divergence.
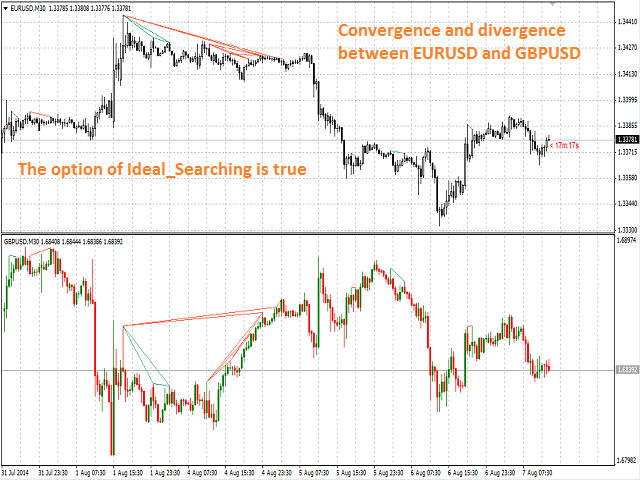
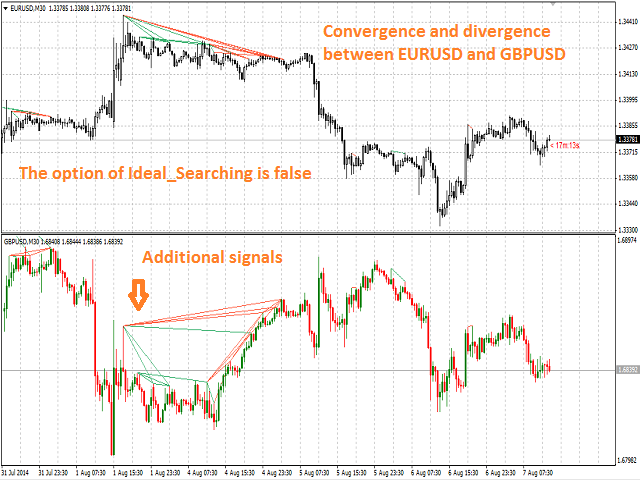
- Ideal_Searching - searching convergence/divergence in non-ideal conditions:
- true - ideal search conditions (by default).
- false - non-ideal search conditions.
- Play_Sound - enable/disable sound notification.
- Show_Time - displaying time remaining until the formation of the current bar.
- Send_Mail - enable/disable e-mail notification.
- ConvLevelColor_1 - color of the convergence line in the main window.
- ConvLevelColor_2 - color of the convergence line in the additional indicator window.
- DivLevelColor_1 - color of the divergence line in the main window.
- DivLevelColor_2 - color of the divergence line in the additional indicator window.
Recommendations
Except above-mentioned basic indicators for confirmation of force of a signal of the indicator, and also definition of a financial instrument for open/close position, the indicator is recommended to be used together with any other analytical tools, for example such as: Reversal Bars, Inside Bar, Long and Short Candlesticks, Main Candlesticks, Impulse System, Bearish Convergence/Divergence HBT, Bearish Convergence/Divergence HTB, Bollinger Bands and others.