Market Mood Multicurrency

Description

A colored multicurrency/multisymbol oscillator of the market mood.

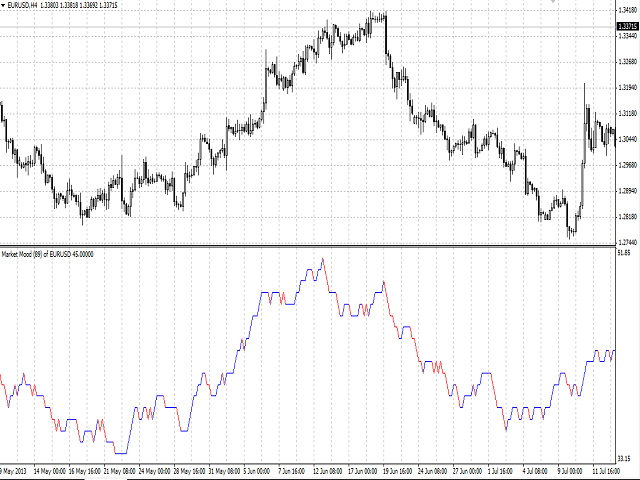
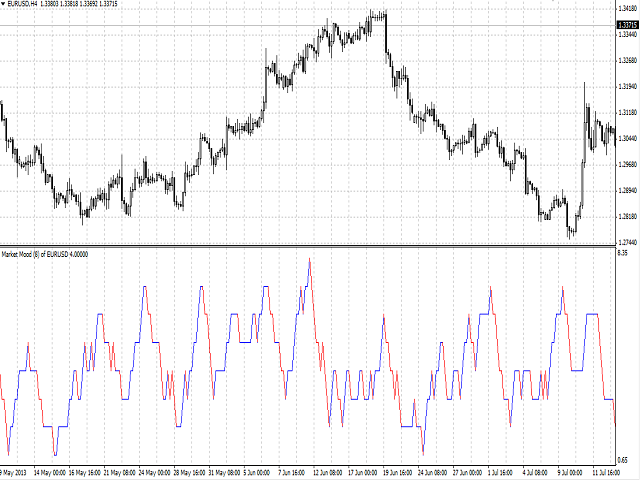
The oscillator is designed for detecting the continuation or change of the market mood prior to its occurrence. An excellent example is the screenshots that show all the features of the oscillator.

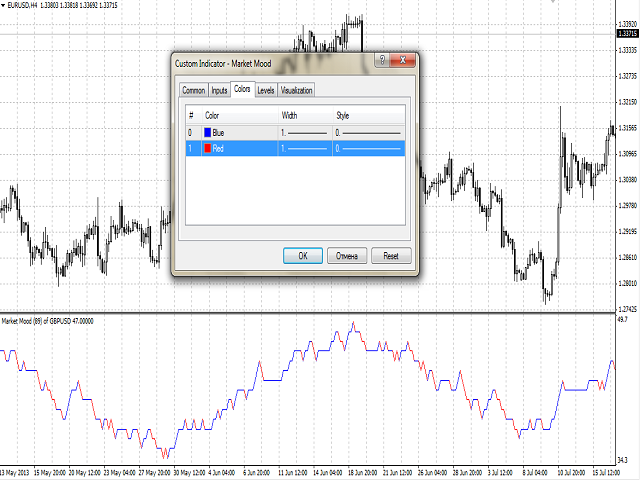
The oscillator may be used with any broker, irrespective of the name of the financial instrument since it is necessary to manually enter the name as an input parameter. If you enter a non-existent or incorrect name of a financial instrument, you will receive an error message that this financial instrument is unknown (does not exist). 

The bullish and bearish mood can be colored.


Inputs

  1. Currency_Name - the name of the financial instrument.
  2. Ind_Period - oscillator calculation period.

It is recommended to choose the period of oscillator calculation among the Fibonacci numbers: 8, 13, 21, 34, 55, 89 etc.  


Purpose

The oscillator can be used for manual or automated trading in an Expert Advisor. Values of indicator buffer of the double type can be used for automated trading: 

  1. The main line of the oscillator - buffer 2.
  2. The bullish line of the oscillator - buffer 0, must not be equal to 0.
  3. The bearish line of the oscillator - buffer 1, must not be equal to zero.
おすすめのプロダクト
This Indicator will notified you when time to entry into the market, build with double william percent range strategy.  --> Buy Notification will flag with the blue arrow --> Sell Notification will flag with the red arrow After Flag Appear, the market usually explode but carefully you must performs double check because weakness of this indicator when in the end of the trend
Smart Trend Forecasting Slope-Based Trend Analysis Indicator with Alert Support Overview Smart Trend Forecasting is a slope-based trend analysis indicator derived from a classic moving average trend model originally developed by Wizard Serg and referenced in Forex Magazine #104. The indicator is designed to monitor: Trend direction Momentum shifts Trend transition conditions Moving average slope behavior It includes visual markers and configurable alert notifications for trend state changes. Ma
矢印インジケーター「クールボリューム」は、Mt4のティックボリュームに基づいています。 インジケータ自体は、一定期間(時間枠の選択)で購入または売却するボリュームの数を追跡します。 そして、売り手または買い手の量が異常に過剰になると、それは売るか買うためのシグナルを与えます。 色付きのヒストグラムは下のウィンドウに描かれており、緑色は現時点での買い手の優位性を示しています。これは、この価格帯で増加する可能性のある即時の逆転を意味します。 逆に、赤い色は売り手の優位性を示しており、これは潜在的な即時の下向きの逆転を意味します。 また、視覚的な利便性のために、矢印がメインチャートウィンドウに直接追加されました。 ユーザーの便宜のために、外部変数には、信号の周波数と履歴(HistoryBars)上のそれらの数の設定変数が含まれています。 ただし、値を1000を超えるように設定することはお勧めしません。 これの多くはあなたの端末のパフォーマンスを遅くします。 また、"===<<矢印設定>>>==="セクションでは、任意の矢印とヒストグラムパラメータを自分で設定することができます。
Dynamic Range Indicator for MQL4 Introducing our cutting-edge Dynamic Range Indicator , specifically designed for 5-minute charts, featuring a proven back-testing record to ensure reliable performance. Key Features: Blue and Red Lines: The indicator uses two dynamic lines to represent market volatility. Calculation Method: The lines are constructed using the last 14 days' average absolute movement of 5-minute closing prices, multiplied by today's session open price. Indicator Formula: Today's op
Universal adaptable indicator. It determines the estimated trading range for the current day based on the available history a real data, and displays the area of the probable price rollback on the chart. All this thanks to the built-in algorithm that automatically adapts to any behavior models of the market quotes. With the parameters adjusted, the indicator shows its effectiveness on most of the currency pairs, that have a rollback from the reached extremums during the current or the next tradi
PM Redefine : Is Simply, Simple, Straight and Direct in opening orders and closing of orders; PM Redefine : Can be run in all type of instrument.{Forex, Commodity ,Stock, or Cryptocurrencies}. PM Redefine : Can be run in all type of TimeFrame,{M1,M5,M15,M30 , H60, H240, D, W, M}. PM Redefine : can be used for scalping and day trading. Input Parameters typeFrom_0_to_9: type in between 0 and 9 ; upper_levelAlert: if line cross this predefine level up , Arrow Buy show if : showArrow =true: lower_l
Description A universal colored multicurrency/multi-symbol indicator RAVI. Was proposed by T. Chand as a trend indicator. RAVI means Range Action Verification Index. The indicator may be used with any broker, irrespective of the name of the financial instrument since it is necessary to manually enter the name as an input parameter. If you enter a non-existent or incorrect name of a financial instrument, you will receive an error message that this financial instrument is unknown (does not exist).
It's a variation of mid of HH and LL since it compares the higher of HH or LL against a period and twice the number of bars back to avoid whipsaws. I used to display this against lines on a chart, but made a histogram out of it and it looks interesting. It looks good at gauging trend strength and general turns (see image below). The name of the indicator is BAM, which is an acronym for "Below and Above Mid". Ways to use it: 1. To see general trend on longer TFs (more than 30 bars back).
Top Gun Oscillators
Safwan Rushdi Khalil Arekat
5 (2)
Note : New in 1.6: the indicator now exports the trade signal (but not displayed). Go long with light blue. Go short with red. Exit otherwise. Signal to be imported to your EA using iCustom. This indicator provides Best of the Best linear filter momentum oscillators that I am aware of (Low Pass Differentiators, LPD's) . All of them are  recent developments by this developer, or other researchers. The oscillator line is the first buffer of the indicator, and can be called  in other indicators or
FREE
Description A universal colored indicator of moving averages: Moving Average, Double Moving Average, Triple Moving Average . The indicator provides various opportunities for the analysis of prices based on different ways of constructing moving averages in the window of the main financial instrument. You can color bullish and bearish moods. Inputs MA_Type - type of multiplicity: Moving Average. Double Moving Average. Triple Moving Average. MA_Period - the MA period. MA_Method - the averaging met
Quatre is a trend indicator, it indicates well the points of the beginning of the trend and its completion or reversal. This indicator is characterized by the following behavior: After a trend movement appears on the market, the indicator sends a signal of its beginning in the form of arrows. Quatre is a mathematical averaging of prices, and based on this, one can assume the direction of price movement (trend) in the future. Against the background of insignificant fluctuations, it is possible t
Stable Helper – Keep Your Trading Connection Uninterrupted! Ensure your MT4 stays connected and stable automatically! Stable Helper works silently in the background, monitoring your connection, rescanning servers, and even restarting MT4 if necessary—all without manual intervention. Designed to minimize downtime and optimize server performance , Stable Helper protects your trades from unexpected disconnections and latency issues. Key Features: 1️⃣ Real-Time Connection Monitoring Constantly
FREE
This Dashboard displays signals in grid view for the 28 major fx currency pairs. It is Mainly used for forex scalping in between 10 to 20 pips maximum and can be used on major trend market decisions. It Uses mainly Moving average and does not give false signal. All you need to note is the point in the grid where the signal occurs.  A beep sound is heard whenever there is a new signal and it will be displayedat the top of the chart.
A   rocket   (from   Italian :   rocchetto ,   lit. 'bobbin/spool') [nb 1] [1]   is a   projectile   that   spacecraft ,   aircraft   or other   vehicles   use to obtain   thrust   from a   rocket engine . Rocket engine exhaust is formed entirely from   propellant   carried within the rocket. [2]   Rocket engines work by   action and reaction   and push rockets forward simply by expelling their exhaust in the opposite direction at high speed, and can therefore work in the   vacuum   of space. In
CANDLE TIMER: 直感的なキャンドル締め切り通知通知 CANDLE TIMERは、トレーダーが現在のチャートのキャンドルが終了するまでの残り時間をリアルタイムで確認するのに役立つ重要な補助指標です。特に、ダンタの売買やボラティリティの高い市場での正確な参入と清算のタイミングを把握するのに非常に便利です。 ※レビューとコメントスコアをいただくとプログラムを作業するのに大きな力になります。ありがとうございます。 コア機能: リアルタイムカウントダウン:現在のキャンドルの締め切りまで残った分と秒をリアルタイムで表示します。 動的位置調整:現在の価格に沿って移動してチャートの読みやすさを最大化します。 キャンドルカラーインターロック:キャンドルの性質(養蜂/陰棒)に応じて、カウントダウンボックスの背景色が自動的に変更され、視覚的な地図が上がります。 養蜂(上昇):緑色の背景で白い文字 陰茎(下落):赤の背景に白い文字 CANDLE TIMERを使用する利点: 心理的安定感:キャンドルの締め切りを正確に把握することで、急な進入を防ぎ、心理的安定を維持することができ
FREE
ChopEx
Joshua Iyanuoluw Adedeji
The Chop Exploder indicator is a custom indicator that has a long run, tight chop, short chop, and band colour. This indicator has MT4 alert notification,mobile notification, and email notification. The default indexing of all arrays and indicator buffers is left to right. The index of the first element is always equal to zero. Thus, the very first element of an array or indicator buffer with index 0 is by default on the extreme left position, while the last element is on the extreme right posit
Zero hour runner
Cosmas Akamadu Nwachukwu
Buy the unlimited version and get free 6 Months Zero hour Runner Expert Advisor valued at $99,  here:  https://www.mql5.com/en/market/product/176118   Introducing: ZERO HOUR RUNNER NON-REPAINT indicator    SHORT     PRECISE  &  NOISELESS A system engineered around one principle: Clarity + Timing + Discipline = Consistency  What Makes ZERO HOUR RUNNER Different? No Repainting. No Tricks. Signals do NOT repaint, redraw, or recalculate What you see is exactly what you get—even after refresh
Indi RBO
Syarief Azman Bin Rosli
Input: Range Start Time : The starting time of the range creation Range End Time : The ending time of range creation Trade End Time : The time where the line of range zone high/low will be extended to Minimum Size : The minimum size of the range in point Maximum Size : The maximum size of the range in point If the range size is between the minimum and maximum, indicator will print the 1st color (blue).
The  Complete Smart Market Concepts  indicator is your all-in-one institutional-grade tool designed to decode  Smart Money Concepts (SMC)  and reveal how the "big players" — banks, hedge funds, and institutions — truly move the forex markets. Built specifically for traders who want to trade like the smart money, this  indicator automatically identifies and plots the most essential SMC elements directly on your charts, giving you crystal-clear insights without manual drawing or guesswork.  
非常に頻繁に、金融シリーズの研究でそれらの平滑化を適用します。平滑化を使用すると、高周波成分を除去することができます - それらはランダムな要因によって引き起こされているため、無関係であると考えられています。平滑化には常に、データを平均化する何らかの方法が含まれます。この方法では、時系列のランダムな変化が相互に吸収します。ほとんどの場合、この目的のために、指数平滑法と同様に単純または加重移動平均法が使用されます。 これらの方法にはそれぞれ、長所と短所があります。したがって、単純な移動平均は単純で直感的ですが、その適用には時系列の周期成分と傾向成分の​​相対的な安定性が必要です。さらに、信号遅延は移動平均の特性です。指数平滑法はラグ効果がありません。しかし、ここでも欠陥があります - 指数平滑化は、系列をランダムな異常値と整列させる場合にのみ有効です。 単純平均と指数平均の間の妥当な妥協点は、加重移動平均の使用です。しかしながら、特定の重量値を選ぶという問題がある。これをまとめてみましょう。 それで、最初に私達が平滑化手順から達成したいことを定義します: •まず、価格系列からランダムな
Crypto_Forex MT4用インジケーター「ハンマー&ハンギングマンパターン」。リペイント不要、遅延なし。 - インジケーター「ハンマー&ハンギングマン」は、プライスアクショントレードに非常に強力なインジケーターです。 - このインジケーターは、チャート上で強気のハンマーパターンと弱気のハンギングマンパターンを検出します。 - 強気パターンのハンマー:チャート上に青い矢印シグナルを表示します(画像参照)。 - 弱気パターンのハンギングマン:チャート上に赤い矢印シグナルを表示します(画像参照)。 - PC、モバイル、メールアラート機能搭載。 - インジケーター「ハンマー&ハンギングマン」は、サポートレベル/レジスタンスレベルと組み合わせるのに最適です。 高品質のトレーディングロボットとインジケーターをご覧になるにはここをクリックしてください! これは、このMQL5ウェブサイトでのみ提供されるオリジナル製品です。
Description A colored universal multicurrency/multi-symbol indicator MACD Line Smart (the indicator moving average convergence divergence is displayed as a histogram) based on double or triple moving average .  Comparing to the standard MACD this indicator is more sensitive to what allows generating advance signals. he indicator may be used with any broker, irrespective of the name of the financial instrument since it is necessary to manually enter the name as an input parameter. If you enter a
Introducing the   “Symbol Cost Info MT4”   indicator – your ultimate tool for staying ahead in the forex market! This innovative indicator is designed to empower traders with real-time cost information, directly on their charts. Here’s why every trader needs the “Symbol Cost Info MT4” in their arsenal: Real-Time Spread Monitoring : Keep a close eye on the spread for any currency pair, ensuring you enter the market at the most cost-effective times. Pip Value at Your Fingertips : Instantly know t
FREE
マルチプルMA MAP(移動平均線マップ)指標は単に線を描くのではなく、複数のタイムフレームの傾向を一目で読むための戦略的ダッシュボードとして機能します。 これまでトレーディングのためにモニターを3つ4つ6つずつ広げて、視線があちこちを行き来してトレンドを把握したら、今では1画面で複数の時間帯のトレンドを一目で把握できるようになりました。イ・ピョンソンだけを活用しても最高のトレーディングが可能になります。 あなたのレビューとコメントのスコアは、継続的にプログラムを作業する力になります。ありがとうございます。 マルチプルMA MAP (Multiple Moving Average Map) 詳細ガイド この指標の核心は、「現在のチャートで上位時間帯の二平線の流れを同時に把握すること」です。 1.主なコンポーネント マルチタイムフレーム(MTF)エンジン:M5、M15、H1など、異なる時間帯のMA(移動平均線)値をリアルタイムで計算して現在のチャートに投影します。 ダイナミック水平線:ダイナミックH線:各タイムフレームのMA位置に点線または実線を表示して、サポート/抵抗線
Telegram Ultimate Manager MT4 Use Cases: Manager Order (open, close, modify order) Publish open and close order to Telegram Channel Open trade based on Forex Factory News Requirement: Telegram Chat ID Telegram Bot API Token Telegram Channel ID Please read the guide This tools can not be backtested Free n8n workflow template to : 1. Import Forex Factory news to Google Calendar 2. Send chat to Telegram bot about news release. Is it good or bad for the currency Inputs: Telegram Bot Token : your T
History Exporter can help to export your orders history from MT4 account. After that you can use another data analysis tools to get what you want.  File format is .csv file, the content such as below OrderID,Symbol,Type,Lots,OpenTime,OpenPrice,StopLoss,TakeProfit,CloseTime,ClosePrice,Commission,Swap,MagicNo,Comment,ProfitUSD,ProfitPips,NetProfit,Duration,(Days),(HH:MM:SS), 21520206,EURCHF,buy,0.05,2020.03.10 08:06:15,1.06304,0.00000,0.00000,2020.03.11 13:37:38,1.06015,-0.60,-0.05,28282888,RedRab
FREE
説明 Triangle Breakout Retest Dashboard Pro Multi Symbol は、マーケットストラクチャーに基づいたブレイクアウトおよびリテスト取引のために設計されたマルチ通貨ペア対応のインスティテューショナル型インジケーターです。 複数の通貨ペアを自動的にスキャンし、三角持ち合いパターンを検出し、ブレイクアウトの方向を特定し、リテストが確認されるまでエントリーシグナルを生成しません。 このツールは、マーケット構造に基づいた確認エントリーに集中することで、フェイクブレイクアウトを回避するために設計されています。 主な機能 三角形パターン検出 上昇三角形を自動検出 下降三角形を自動検出 対称三角形を自動検出 視覚的確認のためにトレンドラインを描画 ブレイクアウト検出エンジン 有効な構造ブレイクアウトを検出 市場の方向性(上昇または下降)を決定 ブレイクアウトレベルを記録 リテスト確認システム 価格がブレイクアウトレベルに戻るのを待機 価格反応を確認してからエントリー フェイクシグナルを大幅に削減 買いリテスト確認シグナルを生成 売りリテスト確認シグナルを生
Indicator of tick volumes with the ability to monitor sudden and significant changes in the prices of bars relative to the specified coefficient - Change Factor - to the average value of volumes for a certain period of time - Period Signal. The color of the indicator's histogram characterizes the changes in volume of a bar relative to the previous session and the signal line. Indicator Inputs Period Signal - period of the signal line; Change Factor – volume change factor. By default, the indica
RQL_BOX Indicator — English Description (How to Use) What it does RQL_BOX   is a   manual range box tool   controlled by two draggable vertical lines: LEFT handle (v-line):   selects a candle on a chosen timeframe and sets the box   High/Low to that candle’s wicks . RIGHT handle (v-line):   defines   how far to extend   the box to the right (projection end). It then draws: the main box (range), optional   top/bottom 20% zones , an optional   50% midpoint line , and an on-chart   info panel   wit
FREE
Femade Indie
Opengates Success International
Femade Indie Vs 1.0 is a simple but multi-currency monitoring Indicator created to instantly notify the trader when an attached currency pair is ready to buy, sell or give signal when such currency pair is getting ready for a big move either up or down. It does this by visual aids on the screen charts, sound and pop-up alerts. If it shows " Medium ", this means that the so called currency signal is almost gone but can still be traded provided the trader will not need a lot of pips which can be b
このプロダクトを購入した人は以下も購入しています
Gann Made Easy は、ミスター・ギャンの理論を使用した取引の最良の原則に基づいた、プロフェッショナルで使いやすい外国為替取引システムです。 W・D・ガン。このインジケーターは、ストップロスとテイクプロフィットレベルを含む正確な買いと売りのシグナルを提供します。 PUSH通知を利用して外出先でも取引可能です。 ご購入後、取引方法の説明と優れた追加インジケーターを無料で入手するには、私にご連絡ください! おそらく、ギャンの取引手法についてはすでに何度も聞いたことがあるでしょう。通常、ギャンの理論は初心者のトレーダーだけでなく、すでにある程度の取引経験がある人にとっても非常に複雑なものです。なぜなら、ギャンの取引手法は理論的にはそれほど簡単に適用できるものではないからです。私はその知識を磨き、最良の原則を私の外国為替インジケーターに組み込むために数年を費やしました。 このインジケーターは非常に簡単に適用できます。必要なのは、それをチャートに添付し、簡単な取引推奨事項に従うだけです。このインジケーターは常に市場分析の仕事を行い、取引の機会を探します。適切なエントリーポイントを検出す
Scalper Inside PRO – Since 2020. An exclusive indicator that utilizes an innovative algorithm to swiftly and accurately determine the market trend. The indicator automatically calculates opening, closing, and profit levels, providing detailed trading statistics. With these features, you can choose the most appropriate trading instrument for the current market conditions. Additionally, you can easily integrate your own arrow indicators into Scalper Inside Pro to quickly evaluate their statistics
M1 SNIPER は使いやすいトレーディングインジケーターシステムです。M1時間足向けに設計された矢印インジケーターです。M1時間足でのスキャルピングのためのスタンドアロンシステムとして、また既存のトレーディングシステムの一部としても使用できます。このトレーディングシステムはM1時間足での取引に特化して設計されていますが、他の時間足でも使用できます。元々、この手法はXAUUSDとBTCUSDの取引用に設計しましたが、他の市場においても役立つと考えています。 インジケーターのシグナルは、トレンドの方向と逆方向に取引できます。インジケーターのシグナルを利用して両方向に取引するのに役立つ特別な取引テクニックをご紹介します。この手法は、特別な動的なサポートとレジスタンスの価格帯を利用することに基づいています。 ご購入後、M1 SNIPER矢印インジケーターをすぐにダウンロードできます。さらに、M1 SNIPERツールのすべてのユーザーに、以下のスクリーンショットに表示されているApollo Dynamic SRインジケーターを無料で提供しています。この2つのインジケーターを組み合わせることで
The indicator is built on a non-standard Zig Zag, it draws accumulations after which if the price leaves this zone and a test of this zone occurs, then a sound signal is given and an arrow appears - after the test candle closes.The indicator does not redraw its signals, it is very easy to use, there are only three settings 1- this is the zig zag parameter 2- this is the minimum price exit from the zone 3- this is the maximum price exit from the zone. The lower the parameter for Zig Zag, the more
PRO Renko Systemは、特別にRENKOチャートを取引するために設計された高精度の取引システムです。 これは、様々な取引商品に適用することができる普遍的なシステムです。 システムは効果的に正確な逆転信号へのアクセスを与えるいわゆる市場の騒音を中和する。 表示器は非常に使いやすく、信号の生成に責任がある1つの変数だけがあります。 あなたは簡単にお好みの任意の取引ツールとレンコバーのサイズにツールを適応させることができます。 私はいつもあなたが私のソフトウェアで収益性の高い取引を支援するために余分なサポートを提供する準備ができています! 私はあなたに幸せで収益性の高い取引をしたいです! ご購入後にご連絡ください! 私はあなたに私のレンコチャートジェネレータを送信します。 私はまた、私の個人的な推奨事項やシステムの他のモジュールを無料で共有します!
Auto Optimized Parabolic RSI: 高度な3Dモメンタムエンジン ほとんどのリテール向けインジケーターは、市場のボラティリティが変化した瞬間に破綻する静的な入力値に依存しているため、失敗に終わります。Auto Optimized Parabolic RSIは、自らの数学的優位性を継続的に再計算することで「インジケーターの陳腐化」問題を解決し、機関投資家レベルの定量的適応力をMT5ターミナルに直接もたらします。 最大の強み: カスタムインメモリ3D最適化   標準的な自動最適化ツールは、インジケーターの呼び出しで端末に過負荷をかけるため、頻繁にMT5プラットフォームをフリーズさせます。本ツールは、このボトルネックを完全に回避しています。RAMベースのカスタムネイティブ計算機を内蔵した内部エンジンは、チャートを読み込んだりタイムフレームを変更したりするたびに、超高速の3Dグリッド探索を実行します。RSI期間(頻度)、SARステップ(加速度)、SAR最大値(制限速度)を同時にスイープし、プラットフォームを遅延させることなく、数万通りものパラメーターの組み合わせを絶対的
After purchase, contact me privately to receive 1 month of free testing with EA Forex Proton! This advanced MT4 trading robot automatically executes signals from any MT4 indicator, including Market Makers. The latest version also includes AI integration, allowing each trade signal to be analyzed using Artificial Intelligence. Live Signal with EA Forex Proton: Click here Market Makers is a powerful price action trading system designed to identify high-probability Buy and Sell opportunities based
ご紹介     Quantum Breakout PRO は 、ブレイクアウト ゾーンの取引方法を変革する画期的な MQL5 インジケーターです。 13年以上の取引経験を持つ経験豊富なトレーダーのチームによって開発された Quantum Breakout PROは 、革新的でダイナミックなブレイクアウトゾーン戦略により、あなたの取引の旅を新たな高みに押し上げるように設計されています。 クォンタム ブレイクアウト インジケーターは、5 つの利益ターゲット ゾーンを備えたブレイクアウト ゾーン上のシグナル矢印と、ブレイクアウト ボックスに基づいたストップロスの提案を提供します。 初心者トレーダーにもプロのトレーダーにも適しています。 量子EAチャネル:       ここをクリック MT5バージョン:   ここをクリック 重要!購入後、インストールマニュアルを受け取るためにプライベートメッセージを送ってください。 推奨事項: 時間枠: M15 通貨ペア: GBPJPY、EURJPY、USDJPY、NZDUSD、XAUUSD アカウントの種類: ECN、Raw、またはスプレッドが非
まず第一に、この取引インジケーターは再描画されず、再描画されず、遅延しないことを強調する価値があります。これにより、手動取引とロボット取引の両方に理想的なものになります。 ユーザーマニュアル:設定、入力、戦略。 アトミックアナリストは、価格の強さとモメンタムを利用して市場でより良いエッジを見つけるためのPA価格アクションインジケーターです。ノイズや誤ったシグナルを除去し、取引ポテンシャルを高めるための高度なフィルターを備えています。複雑なインジケーターの複数のレイヤーを使用して、アトミックアナリストはチャートをスキャンし、複雑な数学的計算をシンプルなシグナルと色に変換します。これにより、どのような初心者トレーダーでも理解して使用し、一貫した取引の決定を行うことができます。 「アトミックアナリスト」は、新規および経験豊富なトレーダー向けにカスタマイズされた包括的な取引ソリューションです。プレミアムインジケーターとトップノッチの機能を1つの取引戦略に組み合わせ、すべてのタイプのトレーダーにとって汎用性のある選択肢にします。 デイリートレーディングとスキャルピング戦略:高速で正確な
Apex Edge No Repaint MT4対応、プロ仕様のリペイントしないトレーディングインジケーター Apex Edge No Repaintは、リペイントする矢印の煩わしさから解放され、明確なシグナルを求める真剣なFXおよび仮想通貨トレーダー向けに設計された、高品質でクリーンかつ信頼性の高いトレーディングツールです。 主な機能: 100% リペイントなし – チャートに表示されたシグナルは固定されたままです デュアルシグナルシステム:早期のチャンスを提供するRAWシグナルと、高確率で確定したエントリーを提供するCONFシグナル シンプルなワンクリック切り替えボタン:RAW ON/OFFとCONF ON/OFF トレンド、強度パーセンテージ、シグナルステータスを表示するプロフェッショナルなリアルタイムダッシュボード インスタントアラート:ポップアップ、サウンド、メール通知 すべてのCONFシグナルにTP1、TP2、ストップロスレベルを自動描画 視覚的に分かりやすい、色分けされた矢印: ライムグリーン → CONF買い 赤 → CONF売り ドジャーブルー → RAW買
このインジケーターは、反転ポイントと価格戻りゾーンを正確に表示します。     主要プレーヤー 。新たなトレンドが形成される場所を把握し、最大限の精度で意思決定を行い、すべての取引をコントロールします。 TREND LINES PRO インジケーターと組み合わせることで、その潜在能力を最大限に発揮します。 VERSION MT5 インジケーターが示す内容: 新しいトレンドの始まりに活性化する反転構造と反転レベル。 リスクと報酬の比率を最小限に抑えた利益 確定 と 損失停止の レベルの表示     RR 1:2   。 インテリジェントな削減ロジックによるストップロス。 指定されたインジケーターから 2 つのトレンド タイプの反転パターンを表示します。 指標: トレンドを追う   TREND LINES PRO   (世界的なトレンドの変化) TREND PRO   (クイックトレンド変更) シンプルで効果的   スキャナー   リアルタイムトレンド(新機能)。 マルチタイムフレームのインストゥルメント フィルタリング。 画面   利益     LOGIC AI信号の後。 当日プラス方
このインジケーターは、エリオット波動理論と組み合わせて作動し、2つの方法で使用されます: 自動モード: このモードでは、インジケーターがチャート上の全ての5つのモーティブ波を自動的に検出し、予測とポテンシャルな逆転ゾーンを提供します。また、アラートやプッシュメッセージを生成する能力も備えています。この自動機能により、エリオット波動パターンの識別と分析のプロセスが効率化されます。 手動モード: このオプションは、エリオット波動理論を手動で扱いたいトレーダー向けです。9つの段階を使用して波を描画することができます。各段階は、表示された後に描画されたラインを調整して個別に定義できます。この機能により、手動で波を描画するプロセスがより効率的になります。重要な点として、すべての描画データが将来の参照のためにプラットフォームのデータフォルダに保存されることに注意してください。 パラメータ: Name: インジケーターの名前。 Use_System_Visuals: インジケーターのテーマを有効または無効にして、取引プラットフォーム全体の外観に合わせます。 Explain_Comment: 波の番号
Please send me Direct message on MQL5 CHAT after purchasing the Indicator for Training and Installation Support There are some additional files that is important to use with the Indicator . So be sure to contact me after purchasing the Indicator So that I can add you for training and support . If you find any difficulty with installation then send me Direct message here So that I can connect with you via Anydesk or Teamview for the product installation. " Smart Order Block Indicator " to find m
ゴールドラッシュ・トレンド・アロー・シグナル ゴールドラッシュ・トレンド・アロー・シグナル 指標は、XAU/USDにおける高速・短期スキャルパー向けに最適化された、正確でリアルタイムのトレンド分析を提供します。 1分足専用に設計されたこのツールは、明確なエントリーポイントを示す方向矢印を表示し、スキャルパーが変動の激しい市場状況でも自信を持って取引できるよう支援します。 この指標は、PRIMARY(主要)とSECONDARY(補助)のアラート矢印で構成されています。PRIMARYシグナルは、トレンドの方向転換を示す白と黒の方向矢印であり、SECONDARYシグナルは、PRIMARY矢印が示す方向を確認し、潜在的なエントリーポイントを示す青と赤の矢印です。 注意:トレンド方向の変化後にPRIMARYアラート矢印が1つだけ表示される場合、複数のSECONDARY青/赤矢印が表示される点に注意が必要です。SECONDARYシグナルは、シグナル基準を満たす任意のローソク足後に表示されます。したがって、長期的なトレンド移動の場合、画面に多くのSECONDARY矢印が表示されます(添付の
このインジケーターを購入すると、プロ仕様のトレードマネージャーを無料で差し上げます。 まず第一に、このトレーディングシステムがノンリペイント、ノンリドロー、ノンラグのインジケーターであることを強調する価値がある。これにより、手動取引とロボット取引の両方に理想的なものになっています。 オンラインコース、マニュアル、プリセットのダウンロード。 「スマートトレンドトレーディングシステム MT5」は、新規および経験豊富なトレーダー向けにカスタマイズされた包括的なトレーディングソリューションです。10以上のプレミアムインジケーターを組み合わせ、7つ以上の堅実なトレーディング戦略を備えており、多様な市場状況に対応する多目的な選択肢となっています。 トレンドフォロー戦略:トレンドを効果的に乗り越えるための正確なエントリーとストップロス管理を提供します。 リバーサル戦略:潜在的なトレンドの反転を特定し、トレーダーがレンジ相場を活用できるようにします。 スキャルピング戦略:高速で正確なデイトレードおよび短期取引のために設計されています。 安定性:すべてのインジケーターはノンリペイント、ノンリドロー、ノ
現在40%オフ! 初心者やエキスパートトレーダーに最適なソリューション! このインジケータは、独自の機能と秘密の数式を組み込んだ、ユニークで高品質かつ手頃な価格のトレーディングツールです。たった1枚のチャートで28の通貨ペアのアラートを表示します。新しいトレンドやスキャルピングチャンスの引き金となるポイントを正確に把握することができるので、あなたのトレードがどのように改善されるか想像してみてください! 新しい基本的なアルゴリズムに基づいて構築されているため、潜在的な取引の特定と確認がより簡単になります。これは、通貨の強さや弱さが加速しているかどうかをグラフィカルに表示し、その加速のスピードを測定するためです。加速すると物事は明らかに速く進みますが、これはFX市場でも同じです。つまり、反対方向に加速している通貨をペアにすれば、利益を生む可能性のある取引を特定することができるのです。 通貨の勢いを示す縦の線と矢印は、あなたの取引の指針となるでしょう。 ダイナミックマーケットフィボナッチ23レベルはアラートトリガーとして使用され、市場の動きに適応します。もしインパルスが黄色のトリガ
「 Dynamic Scalper System 」インジケーターは、トレンド波の中でスキャルピング取引を行う手法のために設計されています。 主要通貨ペアと金でテスト済みで、他の取引商品との互換性があります。 トレンドに沿った短期的なポジションオープンのシグナルを提供し、追加の価格変動サポートも提供します。 インジケーターの原理 大きな矢印はトレンドの方向を決定します。 トレンド波の中では、小さな矢印の形でスキャルピングシグナルを生成するアルゴリズムが機能します。 赤い矢印は強気方向、青い矢印は弱気方向です。 トレンドの方向には敏感な価格変動ラインが描かれ、小さな矢印のシグナルと連動します。 シグナルは次のように機能します。適切なタイミングでラインが現れるとエントリーシグナルが形成され、ラインが開いている間はポジションが保持され、完了すると取引が終了します。 推奨される動作時間枠はM1~H4です。 矢印は現在のローソク足に形成され、次のローソク足が開いている場合は、前のローソク足の矢印は再描画されません。 入力パラメータ Trend Wave Period - トレンド方向
トレンドトレーディング は、タイミングのプルバックとブレイクアウトにより、市場で起こっているトレンドから可能な限り利益を得るように設計された指標です。確立されたトレンドの中で価格が何をしているかを分析することにより、取引の機会を見つけます。 [ インストールガイド | 更新ガイド | トラブルシューティング | よくある質問 | すべての製品 ] 自信を持って効率的に金融市場を取引する むち打ちにならずに確立されたトレンドから利益を得る 収益性の高いプルバック、ブレイクアウト、早期の逆転を認識する この指標は、独自の品質とパフォーマンスを分析します 複数時間枠のダッシュボードを実装します インジケーターは再描画されていません 電子メール/音声/視覚アラートを実装します 確立されたトレンドは多くの取引機会を提供しますが、ほとんどのトレンド指標はそれらを完全に無視しています。インジケーターの解釈はかなり簡単です: (1) トレンドの変化 (2) トレンドの方向への後退 (3) トレンドの方向へのブレイクアウト 赤いダッシュ は下降トレンド中の修正です 青いダッシュ は上昇トレンド中
GOLD Impulse with Alert
Bernhard Schweigert
4.67 (12)
このインディケータは、当社の2つの製品 Advanced Currency IMPULSE with ALERT  +   Currency Strength Exotics . のスーパーコンビネーションです。 このインジケーターは全ての時間枠で作動し、8つの主要通貨と1つのシンボルの強弱のインパルスをグラフで表示します。 このインジケータは、金、エキゾチックペア、商品、インデックス、先物など、あらゆるシンボルの通貨強度の加速度を表示することに特化されています。金、銀、原油、DAX、US30、MXN、TRY、CNHなどの通貨強度の加速度(インパルスまたは速度)を表示するために、任意のシンボルを9行目に追加できる、この種の最初のものです。 新しいアルゴリズムに基づいて構築され、潜在的な取引の特定と確認がさらに容易になりました。これは、通貨の強さや弱さが加速しているかどうかをグラフィカルに表示し、その加速の速度を測定するためです。加速すると物事は明らかに速く進みますが、これはFX市場でも同じです。つまり、反対方向に加速している通貨をペアリングすれば、潜在的に利益を生む取引を特定
デイトレーダーマスターは、デイトレーダーのための完全なトレーディングシステムです。システムは2つのインジケーターで構成されています。 1つの指標は売買する矢印信号です。それはあなたが得る矢印インジケーターです。 2つ目のインジケーターを無料で提供します。 2番目のインジケーターは、これらの矢印と組み合わせて使用​​するために特別に設計されたトレンドインジケーターです。 インジケーターは繰り返さず、遅れないでください! このシステムの使用は非常に簡単です。 2色の線で表示されている現在のトレンドの方向に矢印信号をたどる必要があります。青は買いの傾向です。赤い色は売りの傾向です。青い矢印は買いシグナルです。赤い矢印は売りの合図です。トレンドラインの色と一致するように、矢印の色と信号の方向が必要です。 矢印インジケーターは、主に時間間隔M5とM15での日中取引のために作成されました。ただし、技術的には、システムは他の時間間隔で使用できます。 インジケータには、PUSHメッセージ機能を備えたポップアップアラートが装備されています。 購入後、必ず私に書いてください!私はあなたにシステムとの取引の
Advanced Supply Demand
Bernhard Schweigert
4.91 (300)
現在40%オフ 初心者にもエキスパートトレーダーにも最適なソリューション このインジケーターは独自の機能と新しい公式を多数内蔵しており、ユニークで高品質かつ手頃な取引ツールです。このアップデートでは、2つの時間枠ゾーンを表示できるようになります。より長いTFだけでなく、チャートTFとより長いTF(ネストゾーンを表示)の両方を表示できます。すべてのSupply Demandトレーダーの皆さんのお気に召すはずです。:) 重要情報の公開 Advanced Supply Demandの可能性を最大化するには、 https://www.mql5.com/ja/blogs/post/720245 にアクセスしてください。   エントリーまたはターゲットの正確なトリガーポイントを正確に特定できれば取引がどのように改善されるか想像してみてください。新しい基盤となるアルゴリズムに基づいて構築されているため、買い手と売り手の間の潜在的な不均衡をさらに簡単に特定できます。これは、最も強い需要と供給のゾーンと、過去のパフォーマンス(古いゾーンを表示)がグラフィカルに表現されるためです。これらの機能は、最適な
サポート線と抵抗線のプロットにうんざりしていませんか? サポートレジスタンス は、非常に興味深いひねりを加えてチャート内のサポートとレジスタンスラインを自動検出およびプロットするマルチタイムフレームインジケーターです。価格レベルは時間とともにテストされ、その重要性が高まるにつれて、ラインは太くなり、暗くなります。 [ インストールガイド | 更新ガイド | トラブルシューティング | よくある質問 | すべての製品 ] 一晩でテクニカル分析を強化 チャートを閲覧せずに重要な価格レベルを検出 一目ですべての価格レベルの相対的な強さを認識する すべての取引で最大30時間のプロットラインを節約 インジケーターは、すべての価格レベルの年齢を表示します インジケーターは再描画されていません 過去および現在の価格レベルは近接によって崩壊し、現在の市場行動に合わせて調整されます。動作は、必ずしもピークではない場所に線が引かれます。 価格レベルは、時間とともに拒否されるにつれて、より暗く、より広くなります ノイズを避けるために、重要でない価格レベルは定期的にクリアされます カスタマイズ可能な時間枠の
Trend Screener
STE S.S.COMPANY
4.79 (95)
トレンドインジケーター、1つのツールに組み込まれたすべての重要なトレンド機能を備えたトレンドトレーディングとフィルタリングのための画期的なユニークなソリューション! これは、すべてのシンボル/商品(外国為替、商品、暗号通貨、インデックス、株式)で使用できる100%再描画されていないマルチタイムフレームおよびマルチ通貨インジケーターです。 期間限定オファー: サポートおよびレジスタンス スクリーナー インジケーターは、たった 65 ドルで永久的にご利用いただけます。(元の価格 250 ドル) (オファー延長) トレンドスクリーナーは、チャート内のドットで矢印トレンドシグナルを提供するインジケーターに続く効率的なインジケーターです。 トレンド分析インジケーターで使用できる機能: 1.トレンドスキャナー。 2.最大利益分析を備えたトレンドライン。 3.トレンド通貨強度メーター。 4.アラート付きのトレンド反転ドット。 5.アラート付きの強いトレンドドット。 6.トレンド矢印 毎日の分析例、毎日のシグナルパフォーマンス...など、トレンドスクリーナーインジケーターを使用して、ここで見つけること
Super Signal – Skyblade Edition プロ仕様のノンリペイント / ノーラグ・トレンドシグナルシステム。卓越した勝率を実現 | MT4 / MT5 対応 1分足、5分足、15分足などの低い時間足で最も効果を発揮します。 主な特徴: Super Signal – Skyblade Edition は、トレンド取引に特化したスマートなシグナルシステムです。マルチレイヤーのフィルターロジックを用いて、明確な方向性と実際のモメンタムに支えられた強力なトレンドのみを検出します。 このシステムは 天井や底を予測するものではありません 。次の3つの条件がすべて満たされた場合にのみシグナルを発生させます: 明確なトレンド方向 モメンタムの増加 健全なボラティリティ構造 市場セッションに基づく流動性分析と組み合わせることで、シグナルの精度とタイミングがさらに向上します。 シグナルの特性: すべての矢印シグナルは 100% 非リペイント / 遅延なし 一度出現したシグナルは固定され、点滅・消失しません チャート上の矢印、情報パネル、ポップアップ通知、音声アラート、プッシュ通知
They say history repeats itself. What if you could prove it in real-time? The Propfolio Ghost Pattern is an advanced algorithmic pattern-matching engine. It empowers you to select any current price action structure on your chart and instantly scan thousands of historical candles to find the exact moment in the past where the market did the exact same thing. Once it finds the highest probability match, it projects the historical outcome into the future as "Ghost Candles"—giving you a highly calcu
現在26%OFF! このインディケータは、当社のメインインディケータ( Advanced Currency Strength 28   &  Advanced Currency IMPULSE with ALERT )の両方のスーパーコンビネーションです。28の外国為替ペアのTICK-UNITSとアラートシグナルの通貨強度の値を示しています。11種類のTick-Unitが使用可能です。1、2、3、4、5、6、10、12、15、20、30秒の11種類です。サブウィンドウのTick-Unitバーは、秒単位のタイマーに1ティック以上含まれる場合に表示され、左側にシフトされます。 たった1枚のチャートで、28のFXペアをスキャルピングできます。スキャルピングのチャンスとなるトリガーポイントを正確に把握することで、スキャルピングが上達することを想像してみてください。 1分足よりも短い期間で動作する市場初の通貨強度インジケーターです! このインジケータは、素早いインとアウトを行い、小さなピップを切り取ることを望む高速スキャルパーのためのものです。 ユーザーマニュアル: ここをクリック h
NextCandlePredictor インジケーター NextCandlePredictorは、再描画しない、色が変わらない、動かない、消えない、遅延がないアラート付きのシグナルインジケーターです。あらゆるタイムフレームで次のキャンドルまたはその次のキャンドルの方向を識別するのに役立ちます。ニューヨーク、ロンドン、またはその両方の重なり合う高ボラティリティ市場に特にお勧めです。 主な特徴: タイムフレームの汎用性: M1からH1以上のあらゆるタイムフレームで迅速かつ正確なシグナルを提供します。 明確な買い/売りシグナル: ADXのDI+とDI-ラインを使用して明確な買いと売りのシグナルを生成し、最良のトレード判断を下せるようにします。 直感的な視覚化: シグナルはチャート上に緑色(買い)と赤色(売り)の矢印で直接表示され、迅速かつ簡単に読み取れます。 カスタマイズ可能な設定: 分析するバーの数とアラートオプションを好みとトレード戦略に応じて調整できます。使用するTFに応じた提案表を以下で確認してください。 即時およびオプションのキャンドル終了時アラート: デフォルトでは、ADX条件が
購入後、このインジケーターに基づいたボーナスEAを受け取るためにご連絡ください。 Self Optimizing Double MA Strategyは、パラメータ推測の必要性を排除するために設計されたプロフェッショナルグレードの取引ツールです。組み込みの自動最適化エンジンを搭載し、バックグラウンドで何千ものパラメータの組み合わせをシミュレートすることで、変化する市場状況に継続的に適応し、統計的な優位性を維持します。 静的で時代遅れの設定に依存するのではなく、インジケーターは自身のロジックを動的に更新し、現在の時間枠と取引商品にとって最も収益性の高い構成を見つけ出します。 主な機能 組み込みの自動最適化: 選択した更新頻度に基づいて、システムはFast MA、Slow MA、およびRSIの期間を定期的に再計算し、設定が常に現在の市場のリズムと一致するようにします。 MAダイバージェンスフィルター: 移動平均線が明確に乖離している(広がっている)場合にのみシグナルを検証する、トレンド強度のコア指標です。これにより、移動平均線が収束している相場や平坦なレンジ相場での誤ったエントリーを防ぎ
Send us a message after your purchase to receive more information on how to get your  BONUS  for FREE  that works in great combination with Bull vs Bear ! Bull versus Bear is an easy-to-use Forex indicator that gives traders clear and accurate signals based on clear trend retests . Forget about lagging indicators or staring at charts for hours because  Bull vs Bear provides real-time entries with no lag and no repaint, so you can trade with confidence. Bull vs Bear  helps you enter trades during
現在40%オフ 初心者やエキスパートトレーダーに最適なソリューション! このインジケーターは、独自の機能と新しい計算式を取り入れた、ユニークで高品質、かつ手頃な価格のトレーディングツールです。たった1枚のチャートで28の為替ペアの通貨強度を読み取ることができます。新しいトレンドやスキャルピングチャンスの引き金となるポイントを正確に特定することができるので、あなたのトレードがどのように改善されるか想像してみてください。 ユーザーマニュアルはこちら  https://www.mql5.com/en/blogs/post/697384 これが最初の1本、オリジナルだ! 価値のないクローンを買わないでください。 特別な サブウィンドウの矢印で強い通貨の勢いを表示 GAPがあなたのトレードを導く! 基準通貨や気配値が売られすぎ・買われすぎのゾーン(外相フィボナッチレベル)にあるとき、個別チャートのメインウィンドウに警告表示。 通貨がレンジの外側から反落した場合、プルバック/リバーサルのアラート。 クロスパターンの特別なアラート 複数の時間枠を選択可能で、トレンドを素早く確認できます
作者のその他のプロダクト
The indicator detects the following types of Japanese candlesticks: Doji, Hammer and/or Hanging Man, Shooting Star and/or Inverted Hammer, Spinning Top, Maribozu. The indicator is intended for manual and/or automated trading within an Expert Advisor. There is a possibility to choose colors for bullish and bearish candlesticks. For automated trading, use any indicator buffer of the double type: 0, 1, 2 or 3, whose value is not zero!
The indicator is intended for detecting big (long) and/or small (short) candlesticks. There is possibility of coloring the bullish and bearish candlesticks. The indicator can be used for manual and/or automated trading within an Expert Advisor. The indicator data that can be used for automated trading can be taken from one of four buffers of the double type: 0, 1, 2 or 3. Values must not be equal to zero. 
The indicator of DeMark fractals. The indicator can be drawn on the basis of price data and on the basis of a moving average. There is a possibility to color the up and down fractals. The indicator can be used for manual and for automated trading within an Expert Advisor. For automated trading, use any indicator buffer of the double type: 0 - up fractals, 1 - down fractals! Values of the buffers must not be equal to zero.  A moving average is drawn on the basis of input parameters: Calc_Method 
Description A universal colored indicator Stochastic. The rising and falling lines and the levels of the indicator can be colored.   The indicator can be calculated as the standard one on the basis of a price or as a derivative on the basis of the following nineteen other indicators included in the standard package of the MetaTrader 4 terminal: AD - an indicator of accumulation and distribution of volume. OBV - On Balance Volume. Volume - tick volume indicator. AC - indicator of acceleration. AO
Description A universal colored indicator MACD Histo. The rising and falling of the indicator histogram can be colored.   The indicator can be calculated as the standard one on the basis of a price or as a derivative on the basis of the following twelve other indicators included in the standard package of the MetaTrader 4 terminal: AD - an indicator of accumulation and distribution of volume. OBV - On Balance Volume. Volume - tick volume indicator. Force - Force Index indicator. MFI - Money Flow
Description A colored universal indicator MACD Line (MA convergence-divergence indicator, shown as a histogram). The rising and falling of the indicator histogram can be colored. The indicator can be calculated as the standard one on the basis of a price or as a derivative on the basis of the following twelve other indicators included in the standard package of the MetaTrader 4 terminal: AD - an indicator of accumulation and distribution of volume. OBV - On Balance Volume. Volume - tick volume i
Description A universal indicator RSI together with moving averages based on it. Depending on the need, moving averages can be disabled. You can color the indicator lines and levels: lines of RSI, moving average lines and thresholds of overbought and oversold levels.   The indicator can be calculated as the standard one on the basis of a price or as a derivative on the basis of the following eighteen other indicators included in the standard package of the MT4 terminal: AD - an indicator of accu
Description A universal indicator CCI together with moving averages based on it. Depending on the need, moving averages can be disabled. You can color the indicator lines and levels: lines of CCI, moving average lines and thresholds of overbought and oversold levels.   The indicator can be calculated as the standard one on the basis of a price or as a derivative on the basis of the following eighteen other indicators included in the standard package of the MetaTrader 4 terminal: AD - an indicato
Description A multi-purpose multi-colored/multi-symbol indicator, which is a set of standard tools from the MetaTrader 4 terminal. The difference is that below the basic price chart it allows to calculate and build in a separate window any of the twenty indicators in a colored form, painting bulls and bears in different colors, for any financial instrument in accordance with the list below:  AD - an indicator of accumulation and distribution of volume. OBV - On Balance Volume. Force - Force Inde
Description A colored universal indicator AO (Awesome Oscillator). The rising and falling of the indicator histogram can be colored.   The indicator can be calculated as the standard one or as a derivative on the basis of the following eleven other indicators included in the standard package of the MetaTrader 4 terminal: AD - an indicator of accumulation and distribution of volume. OBV - On Balance Volume. Volume - tick volume indicator. Force - Force Index indicator. MFI - Money Flow Index. ATR
Description A colored universal indicator MACD Classic (MA convergence-divergence indicator) that combines two indicators: MACD Line and MACD Histo. The rising and falling lines, the signal line and the indicator histogram can be colored. The indicator can be calculated as the standard one on the basis of a price or as a derivative on the basis of the following twelve other indicators included in the standard package of the MetaTrader 4 terminal: AD - an indicator of accumulation and distributio
Description The universal colored multicurrency/multisymbol indicator MACD Classic, consisting of two MACD indicators: MACD Line and MACD Histo. The indicator may be used with any broker, irrespective of the name of the financial instrument since it is necessary to manually enter the name as an input parameter. If you enter a non-existent or incorrect name of a financial instrument, you will receive an error message that this financial instrument is unknown (does not exist). Inputs Currency_Nam
Description A colored universal indicator/oscillator based on crossing moving averages. The rising and falling lines of the indicator histogram can be colored. The combined use of the line and the histogram increases the level of the analysis when making a decision to open or close deals. The indicator can be calculated as the standard Price Oscillator or as a derivative on the basis of the following eleven other indicators included in the standard package of the MetaTrader 4 terminal: AD - an i
Description A universal colored multicurrency/multi-symbol indicator RAVI. Was proposed by T. Chand as a trend indicator. RAVI means Range Action Verification Index. The indicator may be used with any broker, irrespective of the name of the financial instrument since it is necessary to manually enter the name as an input parameter. If you enter a non-existent or incorrect name of a financial instrument, you will receive an error message that this financial instrument is unknown (does not exist).
Description The indicator determines the appearance of internal bars on the chart, and paints them in accordance with the bullish and/or bearish mood. The indicator can notify of the appearance of a formed internal bar by playing a beep, as well as display the time remaining until the end of the formation of the current bar in the format of <d:h:m:s, where: < means the current bar. d - days. h - hours. m - minutes. s - seconds. The bullish and bearish mood can be colored. Inputs Sound_Play - a
Description The indicator determines the appearance of the bars that signal of a reversal of current local moods and plays a beep. It also paints these bars in accordance with the bullish and/or bearish priority. You can select the color for bullish and bearish moods. Inputs Sound_Play - a flag that allows the sound notification. Use Detection of the reversal bar can be a signal to perform appropriate trading activities.  The indicator can be used for manual or automated trading in an Expert A
Description The indicator determines the appearance of bars that notify of the reversal of the current trend, and paints them in accordance with the bullish and/or bearish mood. The indicator can notify of the appearance of a formed reversal bar by playing a beep, as well as display the time remaining until the end of the formation of the current bar in the format of <d:h:m:s, where: < means the current bar. d - days. h - hours. m - minutes. s - seconds. You can select the color for bullish and
Description A universal colored multicurrency/multi-symbol indicator of moving averages: Moving Average, Double Moving Average, Triple Moving Average . The indicator is drawn in a separate window, so below the main trading chart a user can see the development of another financial instrument. It is very useful when considering the combined values of various moving averages for different financial instruments below the main trading chart.  The indicator may be used with any broker, irrespective of
Description A universal colored indicator of moving averages: Moving Average, Double Moving Average, Triple Moving Average . The indicator provides various opportunities for the analysis of prices based on different ways of constructing moving averages in the window of the main financial instrument. You can color bullish and bearish moods. Inputs MA_Type - type of multiplicity: Moving Average. Double Moving Average. Triple Moving Average. MA_Period - the MA period. MA_Method - the averaging met
Description A colored universal multicurrency/multi-symbol indicator Bollinger Bands to be drawn in a separate window below the main financial instrument. The rising and falling line of the main indicator and Bollinger Bands can be colored. The indicator can be calculated based on one of the eleven basic indicators included in the standard package of the MetaTrader 4 terminal: AD - an indicator of accumulation and distribution of volume. OBV - On Balance Volume. Force - Force Index indicator. MF
Description A colored universal multicurrency/multi-symbol indicator Channel to be drawn in a separate window below the main financial instrument. The indicator uses the calculation method of the Price Channel indicator. The rising and falling line of the main indicator and the Channel lines can be colored. The indicator can be calculated based on one of the eleven basic indicators included in the standard package of the MetaTrader 4 terminal: AD - an indicator of accumulation and distribution o
Description Keltner's colored channel indicator,also called STARC band, drawn in the main chart window. The indicator uses the calculation technique of the three drawing options: basic, improved and modified . The first two were proposed by Keltner, the third one - by a successful trader L. Rakshe. You can also search for your own best parameters of the indicator. The upper, middle and lower bands can be colored. The indicator includes the basic analytical tool of the market moods by Keltner. Th
Description A colored universal multicurrency/multi-symbol indicator ZigZag to be drawn in a separate window below the main financial instrument. The indicator may be used with any broker, irrespective of the name of the financial instrument since it is necessary to manually enter the name as an input parameter. If you enter a non-existent or incorrect name of a financial instrument, you will receive an error message that this financial instrument is unknown (does not exist).  The indicator can
Description A colored channel indicator Price Channel to be drawn on the main chart of a financial symbol. It can color bullish and bearish moods based on the middle line of the indicator, as well as change the color of the upper and lower lines of the channel. Purpose The indicator can be used for manual or automated trading in an Expert Advisor. Values of indicator buffer of the double type can be used for automated trading:  The middle line of the indicator - buffer 4. The upper line of the
Description Candlesticks is a colored multicurrency/multy-symbol indicator. It shows a financial instrument as a candlestick chart in a separate window below the chart of the main financial symbo. The indicator may be used with any broker, irrespective of the name of the financial instrument since it is necessary to manually enter the name as an input parameter. If you enter a non-existent or incorrect name of a financial instrument, you will receive an error message that this financial instrume
Description Candlestick Tools  is a colored multicurrency/multy-symbol indicator. It shows one of four standard indicators as a candlestick chart in a separate window below the chart of the main financial symbol. The indicator is calculated based on one of two indicators included in the standard package of the МetaТrader 4 terminal: CCI - Commodity Channel Index. RSI - Relative Strength Index. The default indicator is Commodity Channel Index. The indicator may be used with any broker, irrespecti
Description Pivot Pro  is a universal color indicator of the  Pivot Points  levels systems. You can select one of its three versions:  Standard   Old , Standard New  and  Fibo . The system will automatically calculate the  Pivot Point  on the basis of market data for the previous day ( PERIOD_D1 ) and the system of support and resistance levels, three in each. It can also display price tags for each level. You can color the indicator lines. Only a method of calculation of the third level of supp
Description The indicator is intended for labeling the chart using horizontal levels and/or half-round prices. The indicator works on any financial instrument regardless of the name and the number of digits. A user can choose colors for the indicator lines. Input Parameters Calc_Method - method of calculation of the lines: levels of round prices. levels of half-round prices. Digits_Accepted - flag for calculating the levels according to number of decimal places in the quotes of a financial inst
Description A colored universal multicurrency/multi-symbol indicator MACD Line Smart (the indicator moving average convergence divergence is displayed as a histogram) based on double or triple moving average .  Comparing to the standard MACD this indicator is more sensitive to what allows generating advance signals. he indicator may be used with any broker, irrespective of the name of the financial instrument since it is necessary to manually enter the name as an input parameter. If you enter a
Description A colored universal multicurrency/multi-symbol indicator  MACD Histo Smart  (MACD histogram) based on double or triple moving average .  Comparing to the standard MACD Histo this indicator is more sensitive to what allows generating advance signals. he indicator may be used with any broker, irrespective of the name of the financial instrument since it is necessary to manually enter the name as an input parameter. If you enter a non-existent or incorrect name of a financial instrument
フィルタ:
レビューなし
レビューに返信