Fibo Levels

Description 

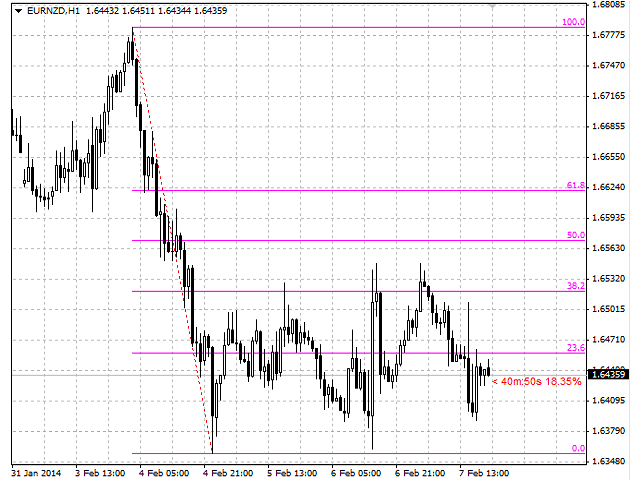
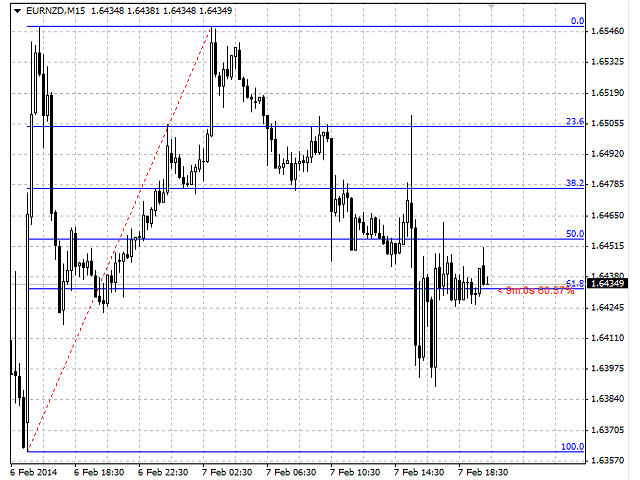
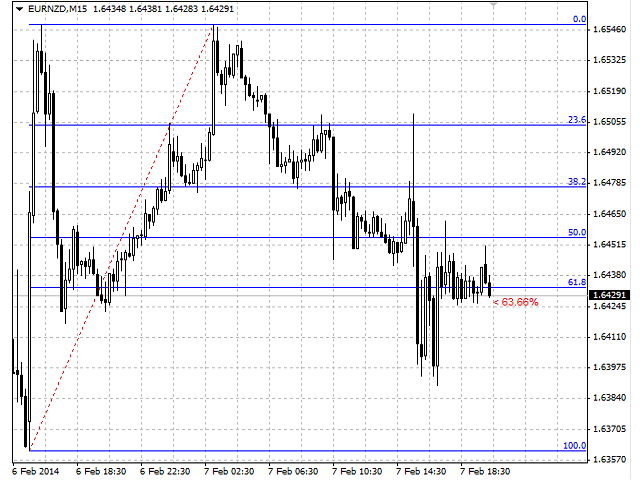
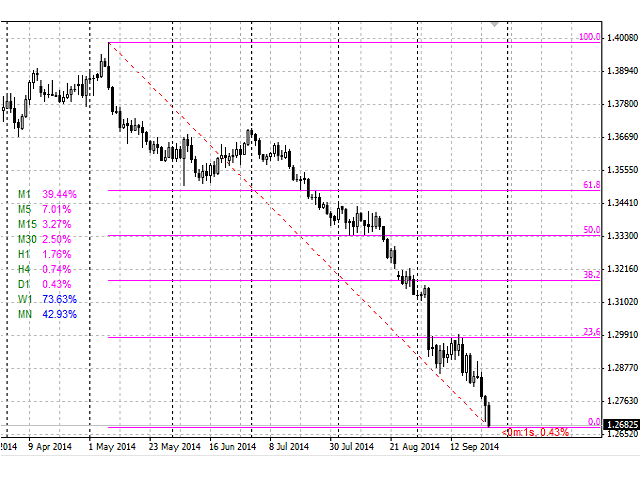
Fibo Levels is an indicator that automatically plots Fibonacci levels.

The levels are calculated and plotted  over a certain interval using the number of bars specified by the user.

When the price achieve one of the target levels (23.6%, 38.2%, 50% or 61.8%) the indicator at the request of the user gives a sound signal and/or sends the message by e-mail.

Example of the e-mail notification:

  • Subject: Fibo Up Signal
  • Message: Signal,H1 - Correction of EURUSD reached 23.6% - 2014.08.06 10:18:00

There is a possibility of obtaining information on correction of the prices on all timeframes at the same time! 

The user can display Fibonacci levels of the bullish and bearish trends in different colors.

Furthermore, the indicator may be set to display the time remaining until the completion of the current bar in <d:h:m:s format, as well as Fibonacci retracements, where:

  • < - an indication of the current bar.
  • d - days.
  • h - hours.
  • m - minutes.
  • s - seconds. 

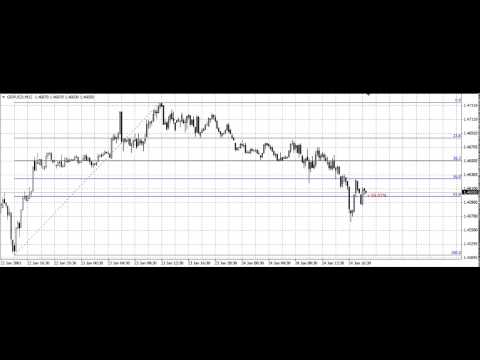
See the below video to check the performance of the indicator.


Purpose

The indicator can be used for manual or automated trading as part of an Expert Advisor. For automated trading, use the indicator buffer of double type: 

  1. Fibonacci retracement of the bullish trend - buffer 0, must not be equal to -1.
  2. Fibonacci retracement of the bearish trend - buffer 1, must not be equal to -1.
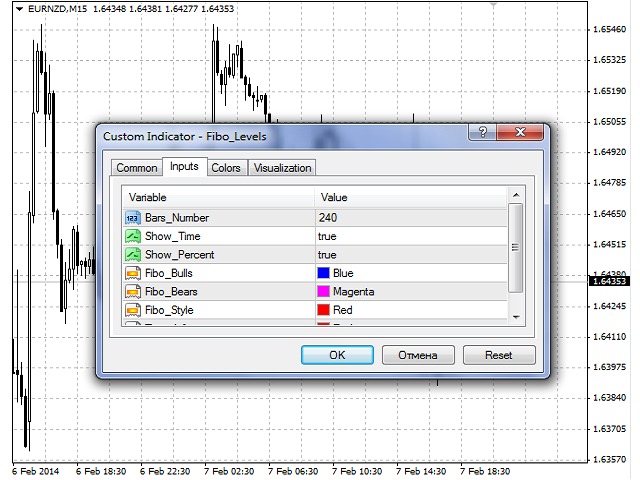
Input Parameters

  1. Bars_Number - number of bars (recommended value is 240).
  2. Corner - угол привязки таблицы на графике:
    • Left upper chart corner.
    • Right upper chart corner.
    • Left lower chart corner.
    • Right lower chart corner.
  3. X_Distance - anchor X-distance table property in pixels.
  4. Y_Distance - anchor Y-distance table property in pixels.
  5. Vertical - a way of display of the table:
    • true - vertical.
    • false - horizontal.
  6. Show_Time - permission to display the time remaining until the completion of the current bar.
  7. Show_Percent - permission to display the current Fibonacci retracement.
  8. Show_Table - permission to display the table of price corrections of all timeframes.
  9. Play_Sound - enable/disable sound notification.
  10. Send_Mail - enable/disable e-mail notification.
  11. Fibo_Bulls - color of Fibonacci levels in the bullish environment.
  12. Fibo_Bears - color of Fibonacci levels in the bearish environment.
  13. Fibo_Style - color of the auxiliary line.
  14. Time_Info - color of the displayed information.
おすすめのプロダクト
Fibonacci retracements can be used to draw support lines, identify resistance levels, place stop-loss orders and set target prices. The Advanced Automatic Fibonacci retracements draws automatically all the levels. You have a lot of options to choose. For exemple you can use the tracements of another time frame (MTF) in the current chart, you can also choose between the closest level or less close to draw the retracements. You can also add 2 levels of your choice. You can add levels extensions o
Like you when I first started trading, It was overwhelming...learning about indicators, about lotsize, leverage and many more things. Its been almost 3 years. I am more knowledgeable in trading. My trading continues to improve as I work on my strategy, technical analysis, trading psychology and trade management. One thing I am not worried about though is being able to close my trades quicky if a trade goes against me or if the trade has reached my take profit level with the help of my Close Tra
ストップロスとテイクプロフィットレベルの自動設定のためのユーティリティ。トレーダーのためにプロのトレーダーによって作成されました。ユーティリティは、トレーダーが手動で、またはアドバイザーを使用して開いたすべての成行注文で機能します。魔法数で取引をフィルタリングできます。ユーティリティは、同時に任意の数の注文を処理できます。 MT5バージョン https://www.mql5.com/en/market/product/56486 ユーティリティでできること: 仮想ストップロスを設定し、1ピップから利益を得る 本当のストップロスと利益を取る 各注文を個別に処理します(ストップロスとテイクプロフィットは各注文に個別に配置されます) 一方向注文のバスケットで作業します(ストップロスとテイクプロフィットはすべての注文に共通に設定され、購入と販売は別々に設定されます) 多方向注文のバスケットで作業します(ストップロスとテイクプロフィットはすべての注文に共通に設定され、一緒に購入と販売します) テストと作業には、チャートのボタンを使用できます。 オプション: STOPLOSS-ピップの
Morning Star PRT インジケーターは、朝のフラットブレイクアウト原理を使用します。インジケーターは朝のフラットレベルを表示し、可能なターゲットを示します。 インジケーターには追加のフィボナッチレベルが追加され、設定で指定された両方のターゲットレベルと夜間のフラットレベルの交差点に関するサウンドアラートも追加されました。 Morning Star PRT インジケーターは、夜の終わりに夜間のフラットチャネルと、上下の 2 つのフィボナッチ価格レベルを構築します。これらのレベルは、ターゲットレベルと反転レベルの両方と見なすことができます。 Morning Star PRT インジケーターはすべての時間枠で機能しますが、M15 間隔で使用するのが最も効果的です。 The Morning Star PRT indicator uses the morning flat breakout principle. The indicator displays morning flat levels and shows possible targets. An additiona
Fibo Bands is an innovative indicator and an analyzer for trading in the current trend direction. The indicator builds a Fibonacci channel (bands), and consists of a trend line (middle line), channel bands, colored bars and reference information. After completion of the current bar, the trend line, the channel and the color of the bar are not redrawn. However, the channel width can be changed after a reset or restart of the indicator depending on volatility. The channel is built in accordance wi
The PUA MultiType Pivot indicator is built on the daily chart of the previous day. The PUA MultiType Pivot indicator is one of the most popular tools in technical analysis, used by traders to identify potential reversal points in financial markets. This indicator constructs three types of Pivot points: Classic, Fibonacci, and Camarilla, each offering its unique approach to market analysis. The advantages of this indicator include: Simplicity and Clarity PUA MultiType Pivot provides clearly defi
StealthTrade Commander is an advanced visual trading panel and risk-management utility designed for manual traders, scalpers, and Prop-Firm challengers. This tool helps you execute trades visually directly from the chart, hide your Stop Loss and Take Profit levels from the broker, and strictly control your daily drawdown—a crucial feature for passing and keeping Prop-Firm funded accounts.  KEY FEATURES:  Risk Guardian (Prop-Firm Protector) Max Daily Loss Limit: Automatically closes all trades an
Description  Fibo Retracement  is an indicator that automatically plots  Fibonacci  levels in the main chart based on Close prices , which distinguishes it from the Fibo Levels indicator that plots levels based on High/Low prices. Thus, using both indicators provides the trader with the opportunity of determining support and resistance zones by Fibonacci! The levels are calculated and plotted over a certain interval using the number of bars specified by the user. The user can display Fibonacci l
If you found this EA, it's probably because you want to get a funded account with a prop firm, but you see a rule that most of traders fear :   Maximum Daily Drawdown.  I've been through this problem myself as   I'm a prop firm trader   and I've made a bot to solve this rule, and you can get it to solve this problem too. How does it work ? When you first setup this EA, you need to input the   initial deposit   which corresponds to the size of your funded account. For exemple if you get a 10k$ f
All Symbols   AND  All Time frames Scan                                                                                                                 Document Introduction   The ABCD is a basic harmonic pattern. The ABCD pattern is a visual, geometric chart pattern comprised of three consecutive price swings. It looks like a diagonal lightning bolt and can indicate an upcoming trading opportu
Crazy Dancing moving RES/SUP Levels Automatic redrawing of moving Supports and resistances levels  to indicate price breaking supports (signal SELL)  or breaking resistance levels (signal BUY) Very simple appearing indicator but very clever and smart too !!!! Main Inputs: # of bars for the support and resistances levels + the initial shift from start + moving average for filter signaling Smaller values for bars /shift inputs when using Higher Time frames (D1-H4) and the reverse higher values for
Bulls CD LBT Global  (Bulls Convergence/Divergence Low Bottom  Top   Global) is an analytical bulls convergence/divergence indicator (C, D or CD) between a financial instrument and 22 MT4 indicators working on all periods simultaneously. The indicator measures the power of CD for indicators and periods and is the first one out of the two possible versions (LBT and LTB). Features The analyzer is not a lagging one. It works by ticks and is able to show CD in the main window even in case the MT4 i
This trading system requires the user to manually add Fibonacci, trend lines, horizontal lines, channel to perform semi-automatic or manual trading. The trading system can also be used in the tester. Trading panel provides: spread information margin information free marging Information The swap information to order for lots (requires your dealer support)
The main function of the indicator is to draw the target lines (support and resistance lines). The lines are plotted according to a special fractal algorithm. The lines are calculated with consideration of the zero bar. A different, more complicated calculation algorithm is used on the zero bar, in contrast to the other bars. This allows reacting to the market situation in real time, but on the other hand, redrawing is possible on the zero bar. If necessary, the zero bar can be omitted from calc
Tester binary indicators by Veles is a tool that checks the signals of any Meta Trader 4 indicator. Main functions: Ability to select buffers of the required indicator to receive BUY and SELL signals. Ability to select the required expiration time based on indicator signals. Possibility to select the operating time range of the required indicator. Possibility to choose the trading verification scheme that is optimal for you (without martingale, martingale by candles, martingale by signal). Abil
Fibonacci theft   is an ultrascalping system that uses Fibonacci levels to launch a scalping system that allows   theft     a few pips from the market. This system allows the use of fibonacci levels, predetermined levels or a level chosen by the user. It also presents the option of using or not volume and impulse filters. Being a very aggressive scalping system, it should only be used in pairs with a low spread and low commissions. This system is suitable for small accounts and can be used wit
このインジケータは、横ばいを検出し、検出された領域を色の付いた四角形で塗りつぶします。 このインディケータの主なアイデアは、価格がチャート上の特定の領域を埋 めたときにフラットを検出することです。 入力パラメータ Color rectangle - 影を付ける矩形の色。 Bars in rectangle - 長方形内のバーの最小許容数。 Density in % - 平坦の密度。矩形の面積に対するパーセンテージで設定。 __________________________________________________________________ __________________________________________________________________
GridBreakTimeSuper
Opengates Success International
GridBreakTimeSuper is a Utility created based on grid trading strategies. It opens any number of Buystops and Sellstops orders respectively as defined by the User with a predetermined gap up and down from the current price as also set by the User. This EA works based on time set by the User for opening and closing of all orders and trades once in a day according to the time set by user. The general idea here is that each currency pair has specific time that breakout is always most likely as ther
Reversal Pattern AI is a groundbreaking advancement in indicator development, combining artificial intelligence algorithms, multi-level market analysis, and classical technical analysis methods. It not only detects reversal patterns but also evaluates market inefficiencies, generating highly accurate trading signals.Thanks to its hybrid model, which utilizes price action analysis, volume, volatility, VWAP, and Volume AVG %, the indicator easily adapts to any market conditions. Reversal Pattern A
Rainbow Price Visualizer v1.21 See where the market really breathes. Turns your MT4 chart into an ultra-precise heatmap that highlights price zones favored by big players. Why it matters 300 price levels at 0.2‑pip resolution — microscopic detail. 8 visual themes (Rainbow, Fire, Ocean…) for instant readibility. Smart opacity: low noise fades, real zones pop. Lightweight rendering with automatic cleanup. Fully customizable: saturation, opacity, resolution, history depth. Bands project into the f
This indicator is a great utilities tools for Fibonacci Trader that draw their chart manually. This indicator do not draw any Fibonacci Retracement or Fibonacci Expansion. It is a utilities tool for modifying the Fibonacci level for Fibonacci object manually drawn on the chart. Just draw using the Fibonacci Retracement or other Fibonacci tool in MT4 as per normal. The select the Fibonacci you have just drawn. Make sure you have only 1 object selected. Then open up this Fibonacci Level Management
BPS Panel Breakout Pro Scalper Solution Panel This indicator is part of the   RPTrade Pro Solutions  systems. BPS Panel   is a daily trend indicator using Price Action, Dynamic Support and Resistances. It's designed to be used by anyone, even the absolute beginner in trading can use it. NEVER repaints . Indications are given   from close to close . Designed to   be used alone , no other indicators are required. Gives you the trend and potential Take Profit at the beginning of the day. How doe
No Demand No Supply
Trade The Volume Waves Single Member P.C.
4.5 (4)
This indicator identifies No Demand –No Supply candles  to your chart and plots volume bars colored according to the signal. It can be applied to all timeframes or to a specific one only. It can also be used as regular volume indicator but with exceptional future of WEIGHTED VOLUME. Furthermore is has an alert notification, sound and email when a signals occurs. The indicator does not repaint but the alert will come on two candles back due to the definition of No Demand No Supply. The VSA (Volum
Description Price CD HTB (Price Convergence/Divergence High Top Bottom) is a innovative universal analytical bears indicator of convergence/divergence between financial instruments. The indicator is the first out of the two possible versions (HBT and HTB) of the bearish convergence/divergence origins. Due to its multiple use feature, the indicator allows you to find convergences/divergences between the price of main financial instrument and other financial instruments simultaneously. Users can s
The   Five Minutes Strategy   EA is designed for trading binary options. EURUSD on the five-minute period is strongly recommended. Trading is performed by the opening prices based on the signals of the   Five Minutes   indicator. It requires at least 100 bars in history to operate. Input Parameters Initial Deposit - initial deposit. Lot Value - lot size. Lot Type - lot type: Fixed - fixed. Variable - variable. Last Lot Value - last lot value (used in cases when the EA is reattached) Day lot typ
YK-Fibo Pivot Indicator: Trade Smarter with Fibonacci Pivot Points The YK-Fibo Pivot Indicator is a powerful technical analysis tool that combines the precision of Fibonacci retracements with the insights of Pivot Points. Whether you're a novice or seasoned trader, this indicator empowers you to spot profitable opportunities in the market with ease. Why Choose YK-Fibo Pivot? Pinpoint Support & Resistance: By calculating Fibonacci levels based on the previous day's high, low, and close prices, y
Automatic fibonacci with alerts is an indicator that automatically plots a fibonacci retracement based on the number of bars you select on the BarsToScan setting in the indicator. The fibonacci is automatically updated in real time as new highest and lowest values appear amongst the selected bars. You can select which level values to be displayed in the indicator settings. You can also select the color of the levels thus enabling the trader to be able to attach the indicator several times with d
Antabod Gamechanger
Rev Anthony Olusegun Aboderin
*Antabod GameChanger Indicator – Transform Your Trading!*   Are you tired of chasing trends too late or second-guessing your trades? The *Antabod GameChanger Indicator* is here to *revolutionize your trading strategy* and give you the edge you need in the markets!   Why Choose GameChanger? *Accurate Trend Detection* – GameChanger identifies trend reversals with *pinpoint accuracy*, ensuring you enter and exit trades at the optimal time.   *Clear Buy & Sell Signals* – No more guesswork! T
Smart Market Structure Simple   is a powerful indicator that helps traders identify   market structure   based on the   Smart Money Concept (SMC) . This indicator automatically detects   Break of Structure (BOS), Change of Character (CHoCH), Fair Value Gaps (FVG), Order Blocks (OB), Liquidity Zones (LQZ),   and key swing points   Higher High (HH), Higher Low (HL), Lower High (LH), Lower Low (LL) . Main Objective:   Assist traders in tracking institutional flow ( Smart Money ) and finding high-p
SMC Venom Model BPR インジケーターは、スマート マネー (SMC) コンセプトで取引するトレーダー向けのプロフェッショナル ツールです。価格チャート上の 2 つの主要なパターンを自動的に識別します。 FVG   (フェアバリューギャップ) は、3 本のローソク足の組み合わせで、最初のローソク足と 3 番目のローソク足の間にギャップがあります。ボリュームサポートのないレベル間のゾーンを形成し、価格修正につながることがよくあります。 BPR   (バランス価格範囲) は、2 つの FVG パターンの組み合わせで、「ブリッジ」を形成します。これは、価格がボリュームアクティビティの少ない動きで動くときに、ブレイクアウトしてレベルに戻るゾーンで、ローソク足の間にギャップを作成します。 これらのパターンは、大規模な市場プレーヤーと一般参加者の相互作用が発生するチャート上のボリュームと価格動向の分析に基づいて、トレーダーが主要なサポート/レジスタンス レベル、ブレイクアウト ゾーン、エントリ ポイントを識別するのに役立ちます。 インジケーターは、長方形と矢印の形でパターンを視
このプロダクトを購入した人は以下も購入しています
Local Trade Copier EA MT4
Juvenille Emperor Limited
4.96 (108)
Local Trade Copier EA MT4 による、驚くほど高速な取引コピーを体験してください。1分で簡単にセットアップできるこの取引コピー機は、同じWindowsコンピュータまたはWindows VPS上の複数のMetaTrader端末間で取引をコピーすることができ、0.5秒未満の高速コピースピードを実現します。 初心者であろうとプロのトレーダーであろうと、 Local Trade Copier EA MT4 には、あなたの特定のニーズに合わせてカスタマイズするための幅広いオプションが用意されています。これは、利益の可能性を高めたい人にとって究極のソリューションです。 今すぐ試してみて、これが市場で最も速くて簡単なトレードコピー機である理由を理解してください。 ヒント: デモアカウントで Local Trade Copier EA MT4 デモバージョンをダウンロードして試すことができます: ここ ダウンロードした無料のデモ ファイルを MT4 >> ファイル >> データ フォルダを開く >> MQL4 >> Experts フォルダに貼り付けて、ターミナルを再起動しま
Trade Assistant MT4
Evgeniy Kravchenko
4.42 (193)
取引 ごとのリスクの 計算、新規注文 の 簡単 な 設置、部分的 な 決済機能 を 持 つ 注文管理、 7 種類 のトレーリングストップなど 、便利 な 機能 を 備 えています 。 追加の資料と説明書 インストール手順 - アプリケーションの手順 - デモアカウント用アプリケーションの試用版 ライン機能 チャート上にオープニングライン、ストップロス、テイクプロフィットを表示します。この機能により、新規注文を簡単に設定することができ、注文を出す前にその特徴を確認することができます。   リスク計算 リスク計算機能は、設定されたリスクとストップロス注文のサイズを考慮して、新規注文のボリュームを計算します。ストップロスの大きさを自由に設定できると同時に、設定したリスクを守ることができます。 Lot calc ボタン - リスク 計算 を 有効 / 無効 にします 。 Risk フィールドでは 、必要 なリスクの 値 を 0 から 100 までのパーセンテージまたは 預金通貨 で 設定 します 。 設定」 タブで 、 リスク 計算 の 種類 を 選択 します :「 $ 通貨」、「 % 残
Trade Manager EAへようこそ。これは、取引をより直感的、正確、そして効率的にするために設計された究極の リスク管理ツール です。これは単なるオーダー実行ツールではなく、包括的な取引計画、ポジション管理、リスク管理のためのソリューションです。初心者から上級者、迅速な実行を必要とするスキャルパーまで、Trade Manager EAはあらゆるニーズに対応し、為替、指数、商品、暗号通貨などさまざまな市場で柔軟に対応します。 Trade Manager EAを使用すると、複雑な計算が過去のものになります。市場を分析し、エントリーポイント、ストップロス、テイクプロフィットのレベルをチャート上のラインでマークし、リスクを設定するだけで、Trade Managerが最適なポジションサイズを即座に計算し、SLとTPをピップ、ポイント、口座通貨でリアルタイムに表示します。すべての取引が簡単かつ効果的に管理されます。 主な機能: ポジションサイズ計算機 :定義されたリスクに基づいて取引サイズを瞬時に決定します。 簡単な取引計画 :エントリー、ストップロス、テイクプロフィットを設定するためのド
Exp COPYLOT CLIENT for MT4
Vladislav Andruschenko
4.65 (66)
MetaTrader4のコピー機を取引します。     それは任意の口座からの外国為替取引、ポジション、注文をコピーします。 それは最高の貿易コピー機の1つです     MT4 - MT4、MT5 - MT4     のために     COPYLOT MT4     バージョン(または     MT4 - MT5  MT5 - MT5     のために     COPYLOT MT5     バージョン)。 MT5のバージョン 完全な説明   +DEMO +PDF 購入する方法 インストールする方法     ログファイルの取得方法     テストと最適化の方法     Expforex のすべての製品 のコピー機 バージョン       MetaTrader 5 ターミナル(   МТ5 - МТ5、МТ4 - МТ5   )-   コピーロットクライアントMT5 独自のコピーアルゴリズムにより、すべての取引がマスターアカウントからクライアントアカウントに正確にコピーされます。 また、動作速度が速いことでも知られています。タフなエラー処理。 強力な機能セット。 プログラムは、複数
Copy Cat More Trade Copier MT4 (コピー猫MT4) は単なるローカル取引コピーツールではなく、現代の取引課題に対応するために設計された完全なリスク管理と実行フレームワークです。Propファームのチャレンジから個人の資産管理まで、強力な実行力、資金保護、柔軟な設定、高度な取引処理を組み合わせ、あらゆる状況に適応します。 このコピーツールは Master(送信側) と Slave(受信側) の両モードで動作し、成行注文や指値注文のリアルタイム同期、取引修正、部分決済、Close By 操作をサポートします。デモ口座・リアル口座の両方に対応し、取引用パスワードまたは投資家パスワードでも利用可能です。Persistent Trade Memory 技術により、EA・ターミナル・VPS が再起動しても復元可能です。複数の Master と Slave を同時に管理でき、ブローカー間の違いはプレフィックス/サフィックスの自動調整やシンボルマッピングで処理されます。 マニュアル/設定: Copy Cat Trading Copier マニュアル Copy Cat Mo
Crystal Trade Manager PRO – MT4向け 高度リスク管理・トレードコントロールシステム 無料版: https://www.mql5.com/en/market/product/150632 概要 Crystal Trade Manager PRO(CTM)は、MetaTrader 4 のために設計された、プロフェッショナル向けのリスク管理および取引管理ユーティリティです。 厳密な執行、強力な資金保護、高度な自動化を必要とするトレーダーのために構築されています。 本システムは、リスク管理、エクイティ保護、日次制限、SL/TP の自動設定を行い、プロレベルの高速ワンクリック取引パネルを提供します。 Prop Firm チャレンジ、デイトレード、スキャルピング、資金運用者に最適です。 MT5版も利用可能です。 主な特徴 1. 高度なリスク・ドローダウン保護 日次ドローダウン上限を 1%〜70% の範囲で設定可能。 上限超過時、 全てのポジションを即時クローズ 。 オプションで 全ての保留注文(Pending Orders)を自動削除 。 日次ロックアウトモード:翌日
Tired of complex order placement and manual calculations? Trade Dashboard is your solution. With its user-friendly interface, placing orders becomes effortless, by a single click, you can open trades, set stop loss and take profit levels, manage trade lot size, and calculate risk to reward ratios, allowing you to only focus on your strategy. Say goodbye to manual calculations and streamline your trading experience with Trade Dashboard. Download  Demo Version  right now. You can find  Details of
Trade copier MT4
Alfiya Fazylova
4.58 (33)
Trade Copierは、取引口座間の取引をコピーして同期するように設計された専門的なユーティリティです。 コピーは、同じコンピューターまたはvps にインストールされている、サプライヤーのアカウント/端末から受信者のアカウント/端末に行われます。 購入する前に、デモ アカウントでデモ バージョンをテストできます。 デモ版 こちら 。 詳細な説明は こちら 。 主な機能と利点: MT5ネッティングアカウントを含む、MT4> MT4、MT4> MT5、MT5> MT4のコピーをサポートします。 高いコピー速度(0.5秒未満)。 ベンダーモードと受信者モードは同じ製品内に実装されています。 チャートから直接リアルタイムでコピーを制御できる、簡単で直感的なインターフェイス。 接続が切断されたり、端末が再起動されたりしても、設定と位置が失われることはありません。 コピーするシンボルを選択できます。また、受信者のシンボルを置き換えることもできます(例:EURUSD> USDJPY)。 バックコピーをサポートします。 特定の注文のみのコピーを有効にする機能。 取引開始価格の最大差と最大遅延時間を
The product will copy all telegram signal to MT4   ( which you are member  ) , also it can work as remote copier.  Easy to set up, copy order instant, can work with almost signal formats, image signal, s upport to translate other language to English Work with all type of channel or group, even channel have "Restrict Saving Content", work with  multi channel, multi MT5 Work as remote copier: with signal have ticket number, it will copy exactly via ticket number. Support to backtest signal. How to
News Filter EA: Advanced Algo Trading Assistant News Filter EA is an advanced algo trading assistant designed to enhance your trading experience. By using the   News Filter EA , you can integrate a Forex economic news filter into your existing expert advisor, even if you do not have access to its source code. In addition to the news filter, you can also specify   trading days   and   hours   for your expert. The News Filter EA also includes   risk management   and   equity protection   features
コピー機->便利で高速なインターフェースインタラクション、ユーザーはすぐに使用できます     ->>>> WindowsコンピュータまたはVPS Windowsでの使用を推奨 特徴: 多様でパーソナライズされたコピー取引設定:1. 異なるシグナルソースに異なるロットモードを設定できます。2. フォワードコピー取引とリバースコピー取引に異なるシグナルソースを設定できます。3. シグナルはコメントで設定できます。4. 契約ロットに応じてロットを調整するかどうか 多様でパーソナライズされたコピー注文設定2:1.品種ごとに異なるロットモードを設定できます2.順方向コピー注文と逆方向コピー注文に異なる品種を設定できます3.コメントでシグナルを設定できます4.契約ロットに応じてロットを調整するかどうか コメントフィルタリング、MAGICフィルタリング、シグナルロットフィルタリング、ローカル製品フィルタリング 勤務時間設定 逆同期SLAVE終了 注文バインド機能: 任意の注文を設定されたシグナルソース注文にバインドできます (テーブルをダブルクリックして編集します) アカウントリスク管理 基本
日ごとおよび週ごとのクローズ取引履歴、現在のオープン取引、および外国為替エクスポージャーを 1 つのチャートで即座に確認できます。ヒートマップを使用して、収益性の高い取引と、取引ポートフォリオ内の現在のドローダウンの位置を特定します。 クイック クローズ ボタン クイック クローズ ボタンを使用すると、1 つのシンボルのすべての取引をクローズしたり、個々の取引を完全にクローズしたり、ボタンをクリックするだけで部分的な利益または損失を取得したりできます。リストで取引を探したり、取引の一部をクローズする方法を考えたりする必要はもうありません。ダッシュボードには、外国為替ペアの取引中に各通貨シンボルの現在のエクスポージャーも表示されるため、主要なニュース イベントの前にエクスポージャーが過剰になっている可能性のある領域を特定するのに役立ちます。ボタンを使用して、ニュースの前にエクスポージャーを即座にすばやく減らすことができます。または、ニュースがすでに発生して利益が出ている場合は、1 回のクリックでその利益をすばやく銀行に預けることができます。 オープン取引ヒートマップ 取引ヒートマッ
Comprehensive on chart trade panel with the unique ability to be controllable from mobile as well. Plus has a library of downloadable configuration, e.g. exit rules, extra panel buttons, pending order setup and more. Please see our product video. Works with all symbols not just currency pairs. Features On chart panel plus controllable from free app for Windows, iPhone and Android Built-in script engine with library of downloadable configuration, e.g. add 'Close All Trades in Profit' button, exit
One tool to protect all your EAs — news filter, equity protection, time filter and more — free demo available Take a Break has evolved from a basic news filter into a comprehensive account protection solution. It pauses your other Expert Advisors during news events or based on custom filters. When trading resumes, it automatically restores your entire chart setup , including all EA settings. Typical use cases: One news filter for all your EAs. Pause trading during news or high volatility — and c
MT4 to Telegram Signal Provider は使いやすく、完全にカスタマイズ可能なツールで、Telegramに信号を送信し、あなたのアカウントを信号提供者に変えることができます。 メッセージのフォーマットは 完全にカスタマイズ可能です! しかし、簡単な使用のために、あらかじめ定義されたテンプレートを選択し、メッセージの特定の部分を有効または無効にすることもできます。 [ デモ ]   [ マニュアル ] [ MT5バージョン ] [ Discordバージョン ] [ Telegramチャンネル ]  New: [ Telegram To MT5 ] セットアップ ステップバイステップの ユーザーガイド が利用可能です。 Telegram APIの知識は必要ありません。開発者が必要なものをすべて提供します。 主要機能 購読者に送信される注文の詳細をカスタマイズする機能 例えばブロンズ、シルバー、ゴールドなど、階層型のサブスクリプションモデルを作成できます。ゴールドサブスクリプションでは、すべての信号が得られますなど。 ID、シンボル、またはコメントによる注文のフ
Ultimate MT4 to Telegram (UMT) sends controlled trades (via symbol, magic, comment) to your telegram channel. It sends open and closed trades, including pending orders and TP/SL modifications, along with chart screenshots, to any telegram channel. Additionally, you can send trade reports of open trades and summary profit/pip reports for day, week, or month. You can customize the design of the trade actions or reports with variables and emoticons.  A beautiful panel allows you to visualize all t
Risk/Reward Toolは、MetaTrader 4でのトレード計画、可視化、執行の方法を革新するために設計されたプロフェッショナルグレードのエキスパートアドバイザーです。精密なリスク管理を重視する裁量トレーダーでも、トレード設定を視覚的にテストする必要のある戦略開発者でも、このツールはエレガントで直感的なインターフェースで必要なすべてを提供します。 基本的なポジション計算機とは異なり、Risk/Reward Toolは視覚的なトレード計画を即時執行機能、リアルタイムの損益モニタリング、包括的なトレード管理機能と組み合わせています。このツールはMT4ストラテジーテスターと完全に互換性があり、実際の資金をリスクにさらすことなくトレード戦略を練習し、アプローチを改善することができます。 ツールの完全なマニュアルはこちら: https://www.mql5.com/en/blogs/post/766244 MT5 version:  https://www.mql5.com/en/market/product/158601 主な機能 視覚的なトレード計画 ドラッグ&ドロップ操作可能
利益追跡機能により、MetaTrader 4で総利益/損失に達した時にポジションをクローズします。 仮想ストップ(個別注文) を有効にできます。 買いと売りのポジションを別々に計算してクローズ(別々の買い/売り) します。 すべてのシンボルまたは現在のシンボルのみをクローズして計算(すべてのシンボル) します。 利益追跡(トレーリング・プロフィット) を有効にします。 預金通貨、ポイント、残高の%で総利益または損失をクローズします。 このアプリケーションは、他のEAと一緒に、または手動取引と組み合わせて、任意のアカウントで使用するために設計されています。 MT5 のバージョン 完全な説明 +DEMO +PDF 購入する方法 インストールする方法 ログファイルの取得方法 テストと最適化の方法 Expforex のすべての製品 取引ペアの全てまたは一部の合計バランスが設定された値以上になった時点で、すべてのポジションがクローズされ、注文が削除されます。 このバージョンは、指定された利益レベルでポジションをクローズできるだけでなく、より良い結果を得るために利益を追跡することも可能です。 C
What is it? Think about it, you can send all the orders/positions info to your telegram channel or group to create your community or VIP signals on telegram. Position info means this EA forward all of your new positions open details (Open price, Open time, Position Type, position Symbol and volume), positions changes ( SL or TP modifying or pending price changes) and position close (Close price, profit or loss, position duration time) and also EA Send NEWS alert (Economic calendar event) on you
VirtualTradePad mt4 Extra
Vladislav Andruschenko
4.86 (59)
ワンクリックで取引できるトレーディングパネル。ポジションと注文の操作!チャートまたはキーボードから取引。 手動取引用の取引パネル。チャート(チャートウィンドウ)またはキーボードから取引できます。開閉、リバース、ロックポジションと注文を処理する МetaТrader4のメインオーダーのトレーディングコントロールパネル:売買、売却、売却、売却、売却、閉じる、削除、修正、トレーリングストップ、ストップロス、takeproft MT5のバージョン 完全な説明   +DEMO +PDF 購入する方法 インストールする方法     ログファイルの取得方法     テストと最適化の方法     Expforex のすべての製品 シンボルウィンドウからの取引とキーボードからの取引! あなたはMetaTrader 4ターミナル - バーチャルコントロールパネルVirtualTradePadのためのユニークなプラグインを持っています。 Description on English 注意!  ストラテジーテスターの 取引方法を学びたい場合は、無料の TesterPad ユーティリティをチェックしてくだ
TradePanel MT4
Alfiya Fazylova
4.85 (92)
Trade Panel は、多機能の取引アシスタントです。このアプリケーションには手動取引用の 50 を超える取引機能が含まれており、ほとんどの取引操作を自動化できます。 注意、アプリケーションはストラテジー テスターでは動作しません。購入する前に、デモアカウントでデモ版をテストできます。デモ版 ここ 。 完全な手順 こちら 。 取引。 ワンクリックで取引操作を実行できます: 自動リスク計算を使用して未決の注文とポジションをオープンします。 ワンクリックで複数の注文とポジションをオープンします。 注文グリッドを開きます。 未決の注文とポジションをグループごとにクローズします。 ポジション反転 (買いを閉じて売りを開く、または売りを閉じて買いを開く)。 ポジションをロックします(買いポジションと売りポジションの量を均等にする追加のポジションをオープンします)。 ワンクリックですべてのポジションを部分的にクローズします。 すべてのポジションのテイクプロフィットとストップロスを同じ価格レベルに設定します。 すべてのポジションのストップロスをポジションの損益分岐点レベルに設定します。 注文とポ
Eezeorder 2
Tawanda Tinarwo
5 (2)
NEW VERSION!  NB: IF YOU ARE USING A VERY HIGH RESOLUTION MACHINE AND THE EA DISPLAY LOOKS TOO SMALL, CONTACT ME SO I CAN HELP YOU. Open Multiple Trades on MT4 in 1 click at one price. Enter the Lot size Specify the number of trades you want to open Choose whether you want TP SL or Trailing Stop Once you are done, click Buy or Sell Open Multiple Pending Orders on MT4 in 1 click at one price. Enter the Lot size Specify the gap from the current price, where you want to place the pending order Spe
--------------Welcome to use [MQL5 Signal Analyze Master]------------------  Function: Draw order tracks of MQL5 MT4 and MT5 signal on MT4 chart. [Using guide] 1.Use it as Experts. 2.Download history record from MQL5 signal(MT4 signal or MT5 signal).  3.Paste history record file below "MQL4/Files/" 4.Load [Signal Analyze Master] on the symbol chart what you want to analyze. 5.Paste the history record file name to parameter 'FileName' 6.Select  SignalType  match the history you download on MT4
Local Trade Copier   is an advanced tool designed for efficiently copying trades between accounts in the   local   mode. It allows for lightning-fast order replication from a master account to a slave account. In local mode, trades are copied instantly, while in remote mode, the copying process takes less than 1 second. MT5 Version MT5 Full Version (Local & Remote) MT4 Full Version (Local & Remote) Local mode refers to both MetaTrader platforms being installed on the same system. It fully suppo
MT4 to Discord Signal Provider は、Discord へ直接トレーディングシグナルを送信するために設計された、使いやすく完全にカスタマイズ可能なユーティリティです。このツールは、あなたのトレーディングアカウントを効率的なシグナルプロバイダーに変えます。 スタイルに合わせてメッセージフォーマットをカスタマイズ!利便性を考え、事前にデザインされたテンプレートから選択し、メッセージのどの要素を含めるか除外するかを選択できます。 [ デモ ] [ マニュアル ] [ MT5 バージョン ] [ Telegram バージョン ]  New: [ Telegram To MT5 ] セットアップ 簡単なセットアップのために、私たちの詳細な ユーザーガイド に従ってください。 Discord API の事前知識は必要ありません。必要なツールはすべて提供されます。 主な特徴 購読者の更新のための注文詳細をカスタマイズ。 ブロンズ、シルバー、ゴールドなど、各レベルで異なるシグナルアクセスを提供する階層的サブスクリプションモデルを実装。 注文が実行されたチャートのスクリーン
Custom Alerts:複数市場を監視し、重要なチャンスを見逃さない 概要 Custom Alerts は、複数の銘柄にまたがるトレードチャンスを一元的に監視したいトレーダーのためのダイナミックなソリューションです。FX Power、FX Volume、FX Dynamic、FX Levels、IX Power などの主要ツールと連携し、複数のチャートを切り替える手間なく、重要な市場変動を自動で通知します。ブローカーが提供するすべての資産クラスに対応しており、シンボルを入力する必要はありません。設定で資産クラスを選択するだけで、すぐにアラートを構成できます。 1. Custom Alerts がトレーダーにとって非常に有益な理由 オールインワンの市場監視 • Custom Alerts は、為替、金属、暗号資産、指数、株式(ブローカーが対応している場合)からのシグナルを収集・統合します。 • 複数のチャートを切り替える必要がなくなり、明確で一元化された通知が得られます。 戦略に合わせたアラート構成 • ボリューム急増、通貨強弱の閾値、極端な価格変動など、目的に応じたアラート
Automatic Trailing Stop Based on Take Profit Percentage with Profit Lock EA MT4   Lock in your profits and "let your winners run" past your 100% take profit target with this EA.  This Expert Advisor automatically adjusts your Stop Loss based on up to 4 user-defined Take Profit Target Percentages, locking in your profit.  If price pushes past your 100% take profit target, the EA will automatically trail the price by user-defined pips, so you won't miss that runaway train again.   EA Features The
トレーディングスペシャル – 40%オフ Advanced Trade Manager – より速く、よりスマートに、より安全に手動取引を行うための究極のオールインワンソリューション。 NextGen Trade Manager AIで手動取引を変革しましょう。これは、即時執行、視覚的な取引プランニング、そして強力なリスク管理を1つの直感的なツールに統合した、プロフェッショナルなオンチャートパネルです。チャートを離れることなく、注文執行、リスク管理、そして利益確保をかつてないほど迅速に行うことができます。取引の精度と効率性を高めたいすべてのトレーダーに最適です。 MT4ストラテジーテスターでリスクなしでテスト デモ版をダウンロードして、ペーパートレード機能をご利用ください。本番運用前に、安全なシミュレーション環境で執行の練習、リスク管理ルールのテスト、そして戦略の改良を行うのに最適な方法です。 完全なユーザーマニュアルとステップバイステップガイドについては、 https://www.mql5.com/en/blogs/post/764217 をご覧ください。 主なメリット:
Riskless Pyramid
Snapdragon Systems Ltd
5 (1)
Introduction This powerful MT4 trade mangement EA offers a way potentially to aggressively multiply trade profits in a riskfree manner. Once a trade has been entered with a defined stoploss and take profit target then the EA will add three pyramid add-on trades in order to increase the overall level of profit. The user sets the total combined profit target to be gained if everything works out. This can be specified either as a multiple of the original trade profit or as a total dollar amount. Fo
これは視覚的な取引パネルであり、取引を簡単に配置および管理し、人為的エラーを回避し、取引活動を強化するのに役立ちます。使いやすい視覚的なインターフェースと、健全なリスクおよび位置管理アプローチを組み合わせています。 [ インストールガイド | 更新ガイド | トラブルシューティング | よくある質問 | すべての製品 ] 驚くほど使いやすい チャートから簡単に取引 正確なリスク管理との取引、手間のかからない 資本の保存が最優先事項です 気をつけずに利益を上げましょう できるだけ早くリスクのない取引をお楽しみください 開かれているすべての取引の自動トレーリングストップ 最初のストップロスは、取引が行われるとすぐに配置されます EAは、取引を行った後に次のタスクを実行します。 最初のストップロス/テイクプロフィットは自動的に配置されます できるだけ早くフリーライドにロックします(オプション) ストップロスを初めて損益分岐点に移動します(オプション) 停止するまで、希望の方法を使用してストップロスを追跡します その他のクールな機能は次のとおりです。 優れたターミナルアクティビティレポート
作者のその他のプロダクト
The indicator detects the following types of Japanese candlesticks: Doji, Hammer and/or Hanging Man, Shooting Star and/or Inverted Hammer, Spinning Top, Maribozu. The indicator is intended for manual and/or automated trading within an Expert Advisor. There is a possibility to choose colors for bullish and bearish candlesticks. For automated trading, use any indicator buffer of the double type: 0, 1, 2 or 3, whose value is not zero!
The indicator is intended for detecting big (long) and/or small (short) candlesticks. There is possibility of coloring the bullish and bearish candlesticks. The indicator can be used for manual and/or automated trading within an Expert Advisor. The indicator data that can be used for automated trading can be taken from one of four buffers of the double type: 0, 1, 2 or 3. Values must not be equal to zero. 
The indicator of DeMark fractals. The indicator can be drawn on the basis of price data and on the basis of a moving average. There is a possibility to color the up and down fractals. The indicator can be used for manual and for automated trading within an Expert Advisor. For automated trading, use any indicator buffer of the double type: 0 - up fractals, 1 - down fractals! Values of the buffers must not be equal to zero.  A moving average is drawn on the basis of input parameters: Calc_Method 
Description A universal colored indicator Stochastic. The rising and falling lines and the levels of the indicator can be colored.   The indicator can be calculated as the standard one on the basis of a price or as a derivative on the basis of the following nineteen other indicators included in the standard package of the MetaTrader 4 terminal: AD - an indicator of accumulation and distribution of volume. OBV - On Balance Volume. Volume - tick volume indicator. AC - indicator of acceleration. AO
Description A universal colored indicator MACD Histo. The rising and falling of the indicator histogram can be colored.   The indicator can be calculated as the standard one on the basis of a price or as a derivative on the basis of the following twelve other indicators included in the standard package of the MetaTrader 4 terminal: AD - an indicator of accumulation and distribution of volume. OBV - On Balance Volume. Volume - tick volume indicator. Force - Force Index indicator. MFI - Money Flow
Description A colored universal indicator MACD Line (MA convergence-divergence indicator, shown as a histogram). The rising and falling of the indicator histogram can be colored. The indicator can be calculated as the standard one on the basis of a price or as a derivative on the basis of the following twelve other indicators included in the standard package of the MetaTrader 4 terminal: AD - an indicator of accumulation and distribution of volume. OBV - On Balance Volume. Volume - tick volume i
Description A universal indicator RSI together with moving averages based on it. Depending on the need, moving averages can be disabled. You can color the indicator lines and levels: lines of RSI, moving average lines and thresholds of overbought and oversold levels.   The indicator can be calculated as the standard one on the basis of a price or as a derivative on the basis of the following eighteen other indicators included in the standard package of the MT4 terminal: AD - an indicator of accu
Description A universal indicator CCI together with moving averages based on it. Depending on the need, moving averages can be disabled. You can color the indicator lines and levels: lines of CCI, moving average lines and thresholds of overbought and oversold levels.   The indicator can be calculated as the standard one on the basis of a price or as a derivative on the basis of the following eighteen other indicators included in the standard package of the MetaTrader 4 terminal: AD - an indicato
Description A multi-purpose multi-colored/multi-symbol indicator, which is a set of standard tools from the MetaTrader 4 terminal. The difference is that below the basic price chart it allows to calculate and build in a separate window any of the twenty indicators in a colored form, painting bulls and bears in different colors, for any financial instrument in accordance with the list below:  AD - an indicator of accumulation and distribution of volume. OBV - On Balance Volume. Force - Force Inde
Description A colored universal indicator AO (Awesome Oscillator). The rising and falling of the indicator histogram can be colored.   The indicator can be calculated as the standard one or as a derivative on the basis of the following eleven other indicators included in the standard package of the MetaTrader 4 terminal: AD - an indicator of accumulation and distribution of volume. OBV - On Balance Volume. Volume - tick volume indicator. Force - Force Index indicator. MFI - Money Flow Index. ATR
Description A colored universal indicator MACD Classic (MA convergence-divergence indicator) that combines two indicators: MACD Line and MACD Histo. The rising and falling lines, the signal line and the indicator histogram can be colored. The indicator can be calculated as the standard one on the basis of a price or as a derivative on the basis of the following twelve other indicators included in the standard package of the MetaTrader 4 terminal: AD - an indicator of accumulation and distributio
Description The universal colored multicurrency/multisymbol indicator MACD Classic, consisting of two MACD indicators: MACD Line and MACD Histo. The indicator may be used with any broker, irrespective of the name of the financial instrument since it is necessary to manually enter the name as an input parameter. If you enter a non-existent or incorrect name of a financial instrument, you will receive an error message that this financial instrument is unknown (does not exist). Inputs Currency_Nam
Description A colored universal indicator/oscillator based on crossing moving averages. The rising and falling lines of the indicator histogram can be colored. The combined use of the line and the histogram increases the level of the analysis when making a decision to open or close deals. The indicator can be calculated as the standard Price Oscillator or as a derivative on the basis of the following eleven other indicators included in the standard package of the MetaTrader 4 terminal: AD - an i
Description A universal colored multicurrency/multi-symbol indicator RAVI. Was proposed by T. Chand as a trend indicator. RAVI means Range Action Verification Index. The indicator may be used with any broker, irrespective of the name of the financial instrument since it is necessary to manually enter the name as an input parameter. If you enter a non-existent or incorrect name of a financial instrument, you will receive an error message that this financial instrument is unknown (does not exist).
Description A colored multicurrency/multisymbol oscillator of the market mood. The oscillator is designed for detecting the continuation or change of the market mood prior to its occurrence. An excellent example is the screenshots that show all the features of the oscillator. The oscillator may be used with any broker, irrespective of the name of the financial instrument since it is necessary to manually enter the name as an input parameter. If you enter a non-existent or incorrect name of a fin
Description The indicator determines the appearance of internal bars on the chart, and paints them in accordance with the bullish and/or bearish mood. The indicator can notify of the appearance of a formed internal bar by playing a beep, as well as display the time remaining until the end of the formation of the current bar in the format of <d:h:m:s, where: < means the current bar. d - days. h - hours. m - minutes. s - seconds. The bullish and bearish mood can be colored. Inputs Sound_Play - a
Description The indicator determines the appearance of the bars that signal of a reversal of current local moods and plays a beep. It also paints these bars in accordance with the bullish and/or bearish priority. You can select the color for bullish and bearish moods. Inputs Sound_Play - a flag that allows the sound notification. Use Detection of the reversal bar can be a signal to perform appropriate trading activities.  The indicator can be used for manual or automated trading in an Expert A
Description The indicator determines the appearance of bars that notify of the reversal of the current trend, and paints them in accordance with the bullish and/or bearish mood. The indicator can notify of the appearance of a formed reversal bar by playing a beep, as well as display the time remaining until the end of the formation of the current bar in the format of <d:h:m:s, where: < means the current bar. d - days. h - hours. m - minutes. s - seconds. You can select the color for bullish and
Description A universal colored multicurrency/multi-symbol indicator of moving averages: Moving Average, Double Moving Average, Triple Moving Average . The indicator is drawn in a separate window, so below the main trading chart a user can see the development of another financial instrument. It is very useful when considering the combined values of various moving averages for different financial instruments below the main trading chart.  The indicator may be used with any broker, irrespective of
Description A universal colored indicator of moving averages: Moving Average, Double Moving Average, Triple Moving Average . The indicator provides various opportunities for the analysis of prices based on different ways of constructing moving averages in the window of the main financial instrument. You can color bullish and bearish moods. Inputs MA_Type - type of multiplicity: Moving Average. Double Moving Average. Triple Moving Average. MA_Period - the MA period. MA_Method - the averaging met
Description A colored universal multicurrency/multi-symbol indicator Bollinger Bands to be drawn in a separate window below the main financial instrument. The rising and falling line of the main indicator and Bollinger Bands can be colored. The indicator can be calculated based on one of the eleven basic indicators included in the standard package of the MetaTrader 4 terminal: AD - an indicator of accumulation and distribution of volume. OBV - On Balance Volume. Force - Force Index indicator. MF
Description A colored universal multicurrency/multi-symbol indicator Channel to be drawn in a separate window below the main financial instrument. The indicator uses the calculation method of the Price Channel indicator. The rising and falling line of the main indicator and the Channel lines can be colored. The indicator can be calculated based on one of the eleven basic indicators included in the standard package of the MetaTrader 4 terminal: AD - an indicator of accumulation and distribution o
Description Keltner's colored channel indicator,also called STARC band, drawn in the main chart window. The indicator uses the calculation technique of the three drawing options: basic, improved and modified . The first two were proposed by Keltner, the third one - by a successful trader L. Rakshe. You can also search for your own best parameters of the indicator. The upper, middle and lower bands can be colored. The indicator includes the basic analytical tool of the market moods by Keltner. Th
Description A colored universal multicurrency/multi-symbol indicator ZigZag to be drawn in a separate window below the main financial instrument. The indicator may be used with any broker, irrespective of the name of the financial instrument since it is necessary to manually enter the name as an input parameter. If you enter a non-existent or incorrect name of a financial instrument, you will receive an error message that this financial instrument is unknown (does not exist).  The indicator can
Description A colored channel indicator Price Channel to be drawn on the main chart of a financial symbol. It can color bullish and bearish moods based on the middle line of the indicator, as well as change the color of the upper and lower lines of the channel. Purpose The indicator can be used for manual or automated trading in an Expert Advisor. Values of indicator buffer of the double type can be used for automated trading:  The middle line of the indicator - buffer 4. The upper line of the
Description Candlesticks is a colored multicurrency/multy-symbol indicator. It shows a financial instrument as a candlestick chart in a separate window below the chart of the main financial symbo. The indicator may be used with any broker, irrespective of the name of the financial instrument since it is necessary to manually enter the name as an input parameter. If you enter a non-existent or incorrect name of a financial instrument, you will receive an error message that this financial instrume
Description Candlestick Tools  is a colored multicurrency/multy-symbol indicator. It shows one of four standard indicators as a candlestick chart in a separate window below the chart of the main financial symbol. The indicator is calculated based on one of two indicators included in the standard package of the МetaТrader 4 terminal: CCI - Commodity Channel Index. RSI - Relative Strength Index. The default indicator is Commodity Channel Index. The indicator may be used with any broker, irrespecti
Description Pivot Pro  is a universal color indicator of the  Pivot Points  levels systems. You can select one of its three versions:  Standard   Old , Standard New  and  Fibo . The system will automatically calculate the  Pivot Point  on the basis of market data for the previous day ( PERIOD_D1 ) and the system of support and resistance levels, three in each. It can also display price tags for each level. You can color the indicator lines. Only a method of calculation of the third level of supp
Description The indicator is intended for labeling the chart using horizontal levels and/or half-round prices. The indicator works on any financial instrument regardless of the name and the number of digits. A user can choose colors for the indicator lines. Input Parameters Calc_Method - method of calculation of the lines: levels of round prices. levels of half-round prices. Digits_Accepted - flag for calculating the levels according to number of decimal places in the quotes of a financial inst
Description A colored universal multicurrency/multi-symbol indicator MACD Line Smart (the indicator moving average convergence divergence is displayed as a histogram) based on double or triple moving average .  Comparing to the standard MACD this indicator is more sensitive to what allows generating advance signals. he indicator may be used with any broker, irrespective of the name of the financial instrument since it is necessary to manually enter the name as an input parameter. If you enter a
フィルタ:
レビューなし
レビューに返信