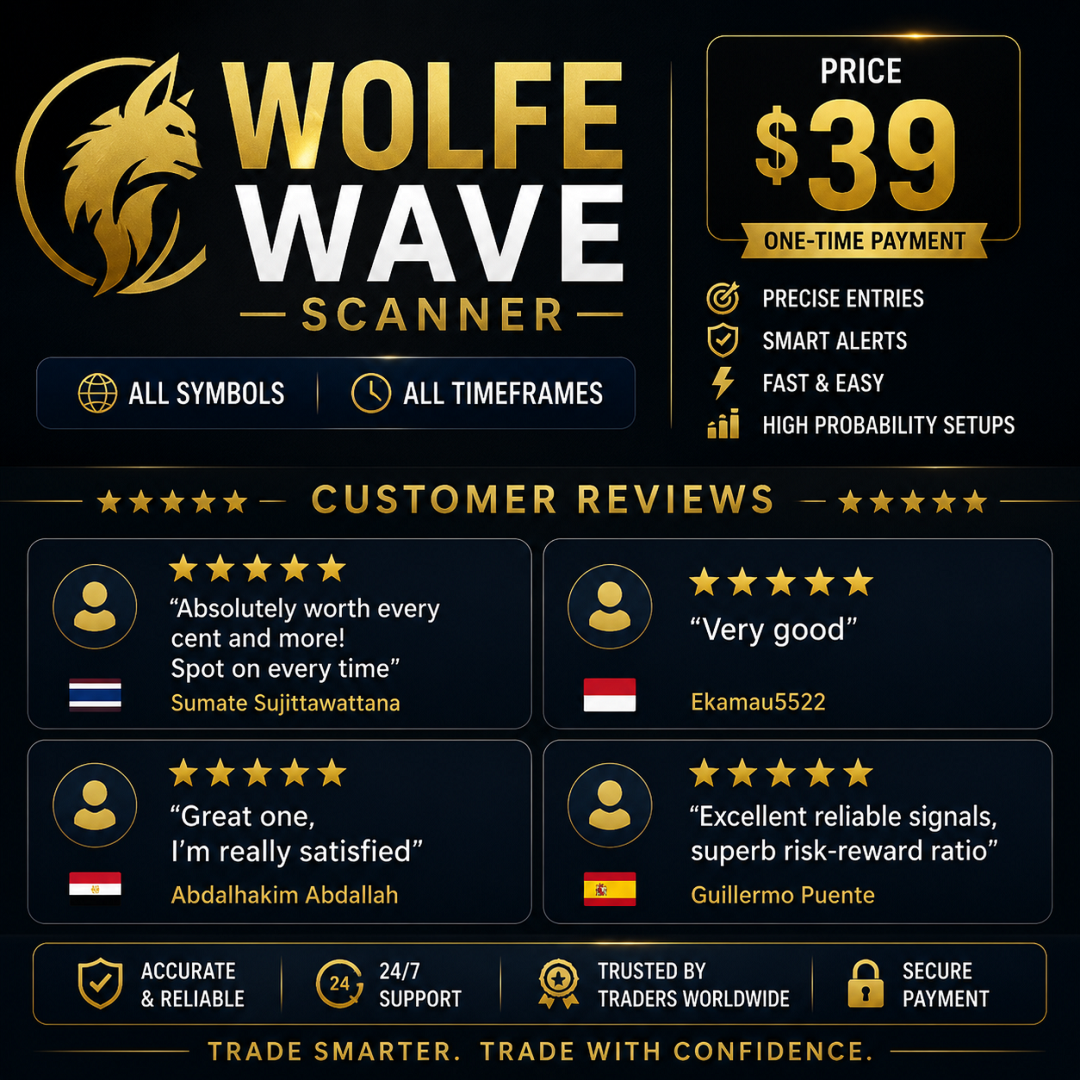
Wolfe Wave Scanner MT4
- インディケータ
-
Reza Aghajanpour
 =============================================================================================
<<<<<< Our team after 19 years of experience in the markets and programming would like to share winner solutions with you. >>>>>> - バージョン: 1.9
- アップデート済み: 27 2月 2026
- アクティベーション: 20
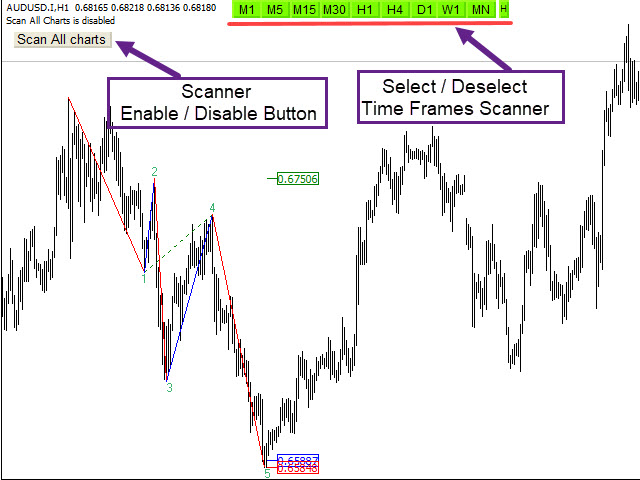
** All Symbols x All Timeframes scan just by pressing scanner button **
Introduction:
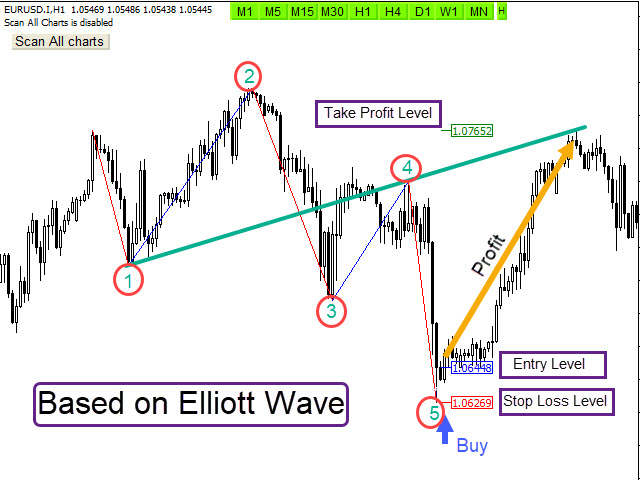
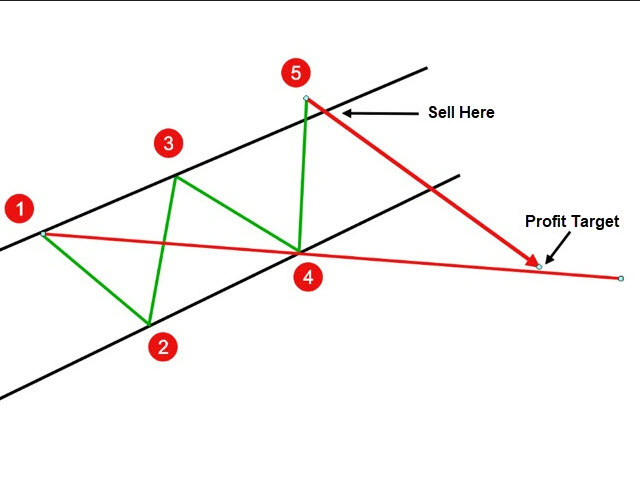
A Wolfe Wave is created with five-wave patterns in price. It shows supply and demand and a fight towards a balance price. These waves of price actions can help traders identify the boundaries of the trend. Also It helps forecast how the price will move in the near future. Wolfe Waves work based on the Elliott waves with enhanced concepts.
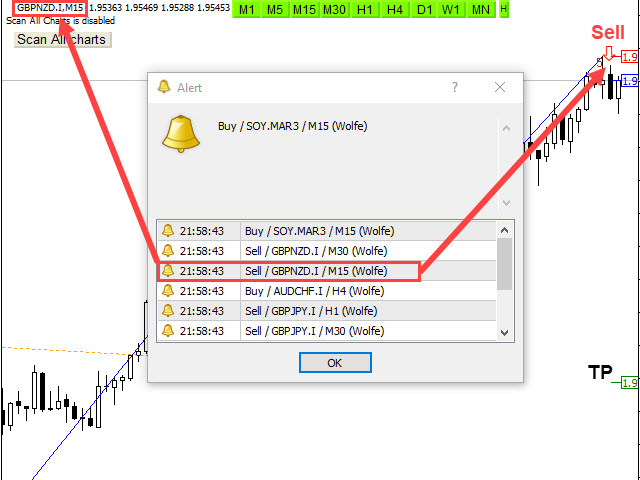
The Wolfe Wave Scanner indicator Scans All charts just by pressing one click. It has stop loss, Take profit and entry point levels with using Fibonacci levels and candlestick checking to find the best entry point and exit of trading. It finds signals immediately with alarm and notification for easy trading.
Main Features:
- Detect the best and most common successful reversal trend : Wolfe Waves Pattern
- Easy-to-use and user-friendly indicator
- Scan All charts button ( Forex, Crypto, Indices and commodities )
- Select and deselect time frames button for scan (M1,M5,M15,M30,H1,H4,D1,W1,MN)
- It displays and pushes notification stop-loss, entry-point levels
- Candlestick check for the best entry point
- Use Fibonacci levels
- Sending the alert and push notification
- method Engulfing/breakout - Engulfing on edge of pattern / Breakout next price level
- Alert enable/disable base on your setting time
- Adjust the pattern setting
Input Parameters :
=========Scanner============
- Scan All Charts – Enable
- Scan the number of candles – Amount of history bars to evaluate
- Re-scan Timer – Re-scan all charts in all time frames after passing time
- method = Engulfing/breakout - Engulfing on the edge of pattern / Breakout of level
=======Display/style Options============
- Display Options – Display or do not SL & TP & Entry levels
- Stop Loss levels and Breakout Style - Set the Fonts and colors of patterns
========ALERT SETTINGS ==========
- Display Alert or Push Notification – Enable or disable Alert or Push Notification
- How many candles are past a pattern – Maximum Number of candles Passed from a pattern to allow alert
- Alert Buffer Size – Maximum save alert to prevent duplicate alerts
- Alert start/end time – Determine trading hours based on the computer clock to activate and deactivate the alarm


Excellent indicator to setup my trading plan. Recommend!