Multicurrency MAs
- インディケータ
- バージョン: 1.24
- アップデート済み: 23 7月 2024
- アクティベーション: 7

Description
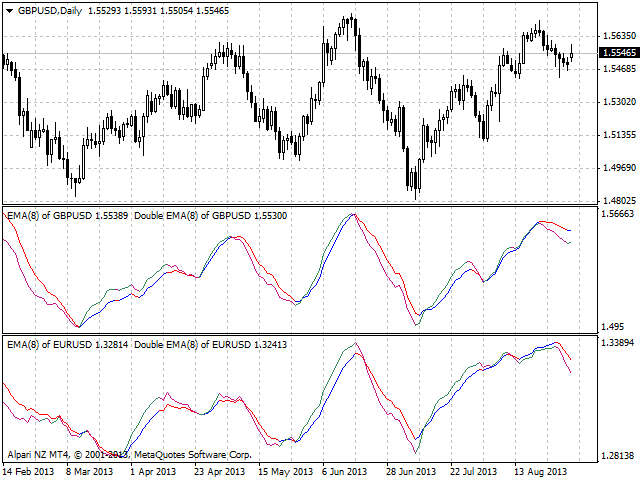
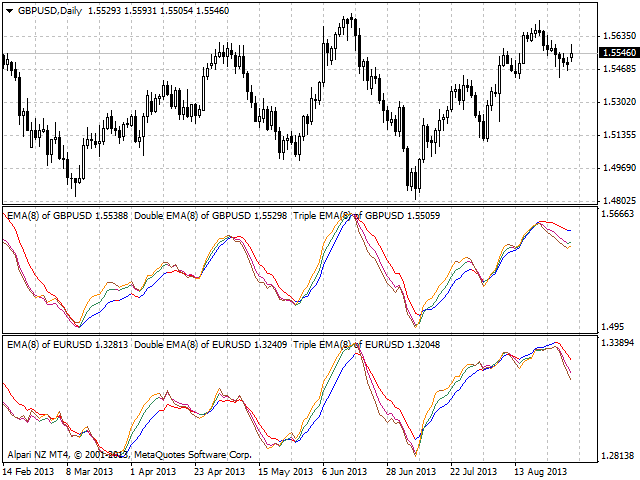
A universal colored multicurrency/multi-symbol indicator of moving averages: Moving Average, Double Moving Average, Triple Moving Average.
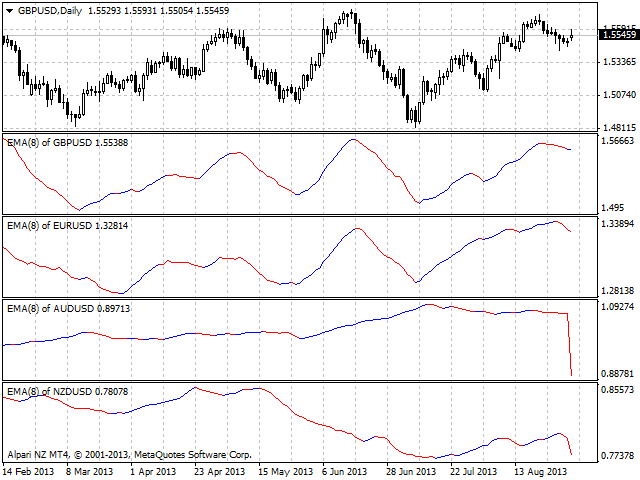
The indicator is drawn in a separate window, so below the main trading chart a user can see the development of another financial instrument.
It is very useful when considering the combined values of various moving averages for different financial instruments below the main trading chart.
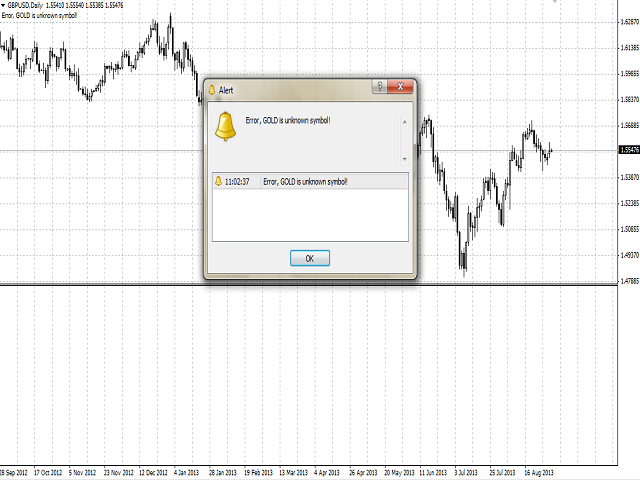
The indicator may be used with any broker, irrespective of the name of the financial instrument since it is necessary to manually enter the name as an input parameter. If you enter a non-existent or incorrect name of a financial instrument, you will receive an error message that this financial instrument is unknown (does not exist).
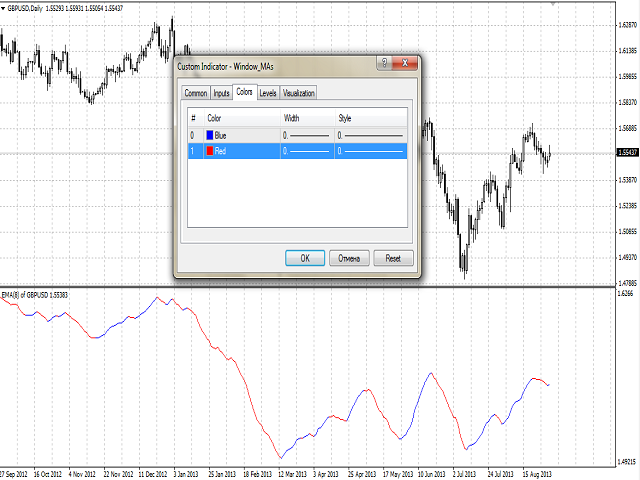
You can color bullish and bearish moods.
Inputs
- Currency_Name - the name of the financial instrument.
- MA_Type - type of multiplicity:
- Moving Average.
- Double Moving Avarage.
- Triple Moving Average.
- MA_Period - the MA period.
- MA_Method - the averaging method for the MA.
- Applied_Price - used price.
- Shift - shift relative to the price chart.
Purpose
The indicator can be used for manual or automated trading in an Expert Advisor. Values of indicator buffers of the double type can be used for automated trading:
- The main line of the indicator - buffer 5.
- The bullish line of the indicator - buffer 0, must not be equal to 0.
- The bearish line of the indicator - buffer 1, must not be equal to zero.