RAVI Multicurrency
- インディケータ
- バージョン: 1.24
- アップデート済み: 18 7月 2024
- アクティベーション: 7

Description
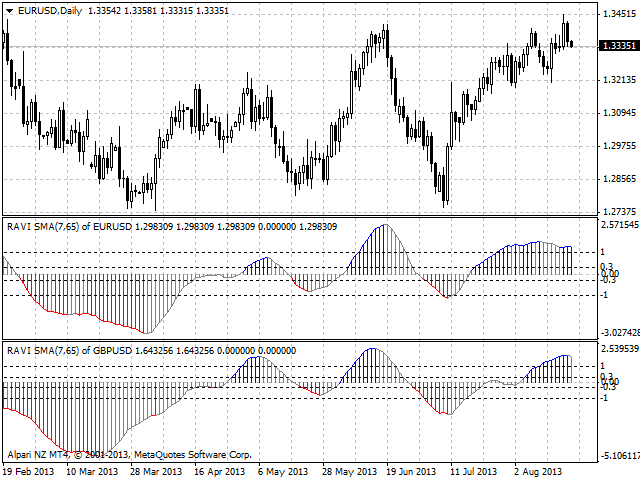
A universal colored multicurrency/multi-symbol indicator RAVI. Was proposed by T. Chand as a trend indicator. RAVI means Range Action Verification Index.
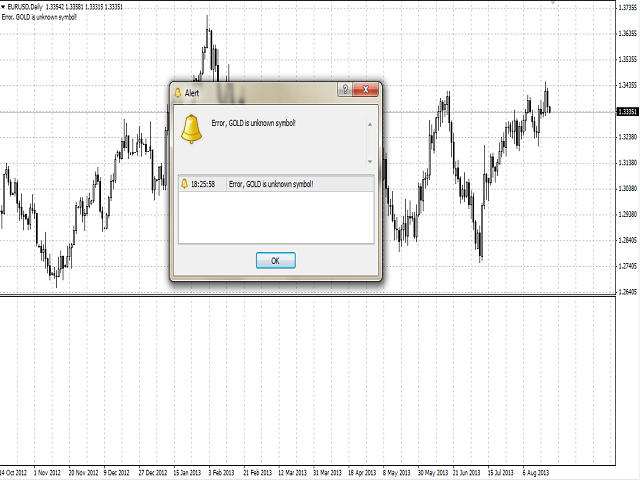
The indicator may be used with any broker, irrespective of the name of the financial instrument since it is necessary to manually enter the name as an input parameter. If you enter a non-existent or incorrect name of a financial instrument, you will receive an error message that this financial instrument is unknown (does not exist).
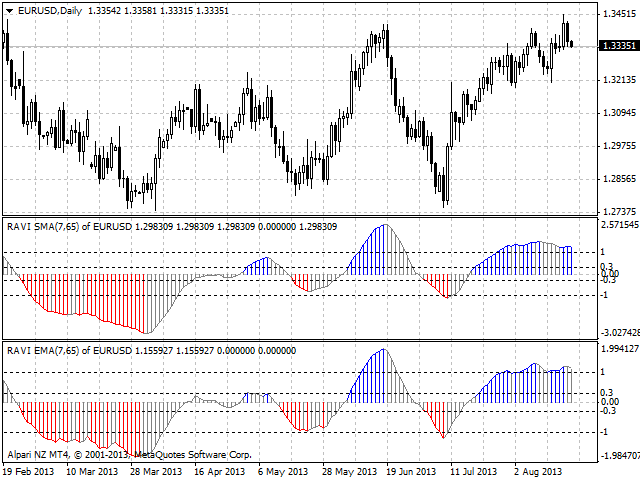
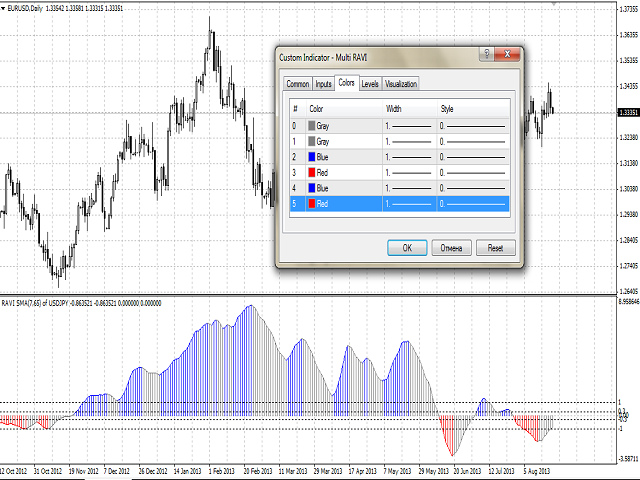
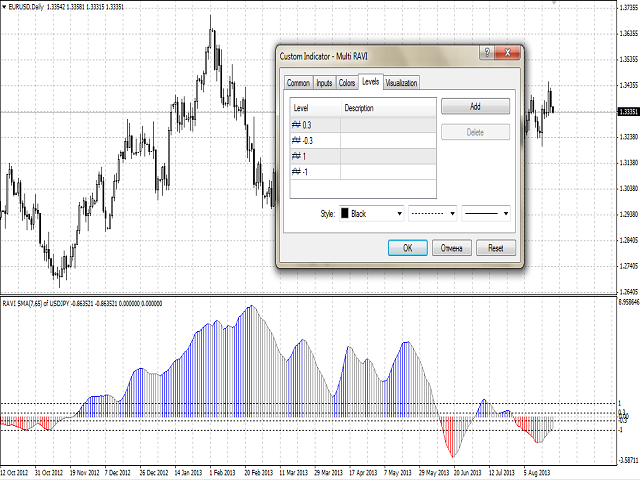
The indicator is constructed with the period of moving averages 7 to 65 (7/65) and has reference lines recommended by T.Chand: +/- 0.3 and +/-1.0. When the market is bullish, intersection of these lines with the indicator line is colored blue, for the bearish market - red. This determines the direction of the trend.
Inputs
- Currency_Name - the name of the financial instrument.
- MA_Method - the averaging method for the MA.
- Applied_Price - used price.
- Shift - shift relative to the price chart.
Purpose
The indicator can be used for manual or automated trading in an Expert Advisor. Values of indicator buffers of the double type can be used for automated trading:
- The main line of the indicator - buffer 0.
- The bullish line of the indicator - buffer 4, must not be equal to 0.
- The bearish line of the indicator - buffer 5, must not be equal to zero.
- The main line of the histogram - buffer 1.
- The bullish line of the histogram - buffer 2, must not be equal to 0.
- The bearish line of the histogram - buffer 3, must not be equal to zero.