Keltner Channel
- ユーティリティ
- バージョン: 1.24
- アップデート済み: 2 4月 2020
- アクティベーション: 7

Description
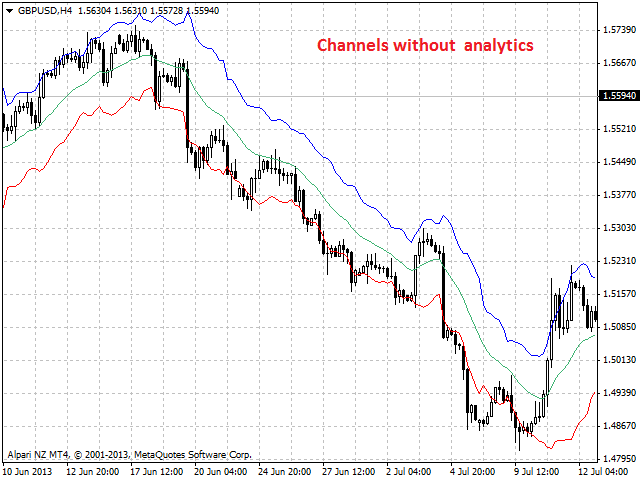
Keltner's colored channel indicator,also called STARC band, drawn in the main chart window. The indicator uses the calculation technique of the three drawing options: basic, improved and modified. The first two were proposed by Keltner, the third one - by a successful trader L. Rakshe.
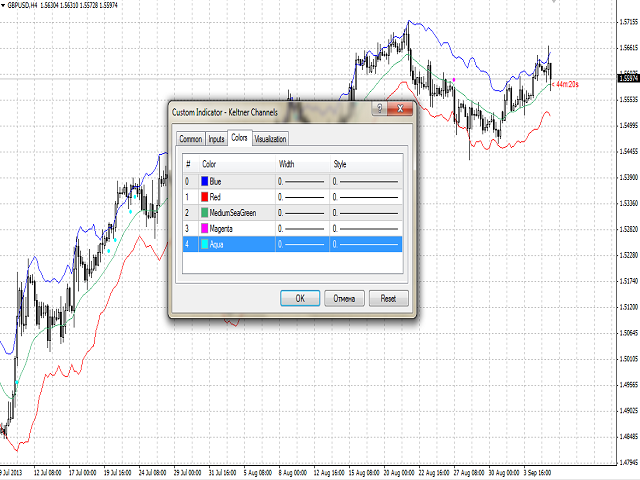
You can also search for your own best parameters of the indicator. The upper, middle and lower bands can be colored.
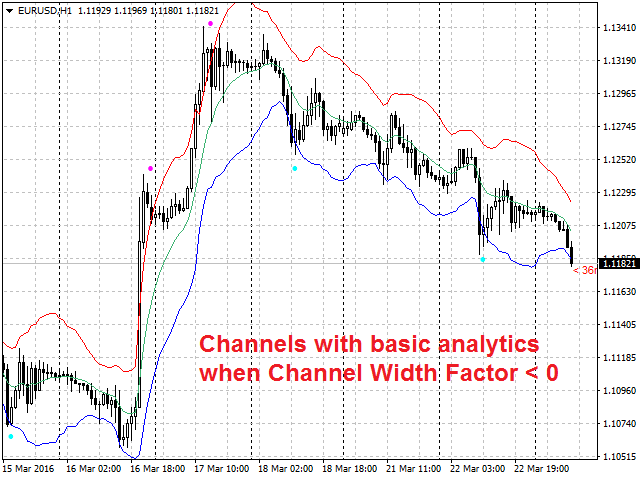
The indicator can notify of the appearance of a formed bar detected by the analytical tool by playing a beep, as well as display the time remaining until the end of the formation of the current bar in the format of <d:h:m:s, where:
- < means the current bar.
- d - days.
- h - hours.
- m - minutes.
- s - seconds.
Purpose
The indicator can be used for manual or automated trading in an Expert Advisor. Values of indicator buffer of the double type can be used for automated trading:
- The middle line of the indicator - buffer 2.
- The upper line of the indicator - buffer 0.
- The lower line of the indicator - buffer 1.
- The signal of the bearish mood - buffer 3, must not be zero.
- The signal of the bullish mood - buffer 4, must not be zero.
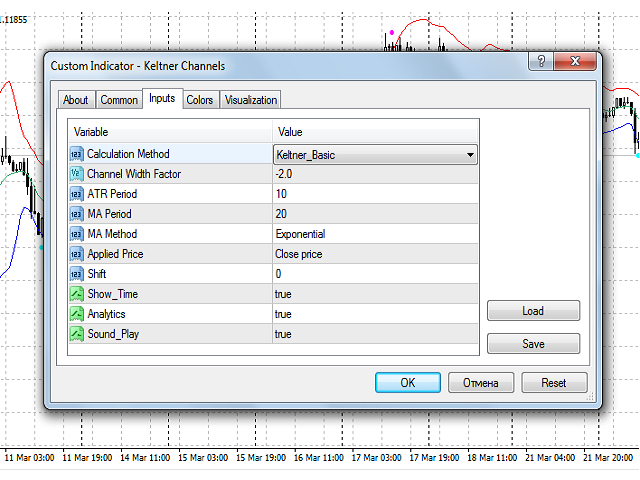
Inputs
- Calc_Method - the indicator calculation method:
- basic (by Keltner).
- improved (by Keltner).
- modified (by L.Rakshe) .
- Custom - for the following parameters specified by the user.
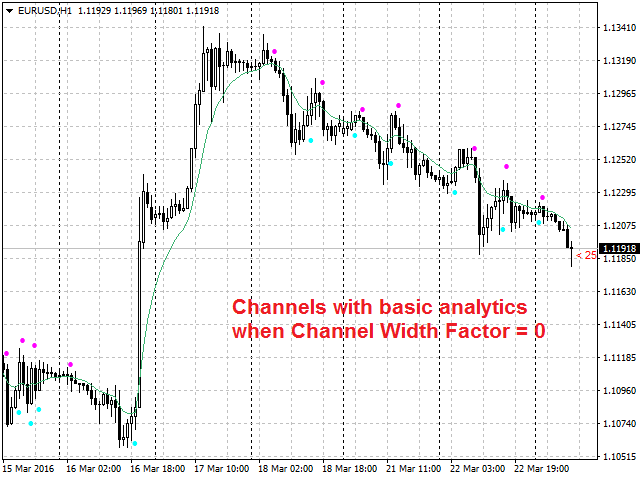
- Channel_Width_Factor - Channel width factor.
- ATR_Period - calculation period for the ATR (Average True Range).
- MA_Period - MA period.
- MA_Method - the MA averaging method.
- Applied_Price - used price.
- Shift - shift of the indicator in relation to the price chart.
- Show_Time - a flag to allow display of the time left for the current bar to be formed.
- Analytics - a flag to allow connection of Keltner's basic analytics.
- Sound_Play - a flag to allow sound alerts.
- Send_Mail - a flag to allow send an e-mail message.
- Send_Notification - a flag to allow send notification.


This is an excellent Indicator, it just what many of us we are looking, simple and with good profits, it is a must indicator for your trading
Additionally the author, Mr. Semyonov is very formal and reply very fast ! an excelent service.
Congratulationd Mr. Semyonov for this good Job.
I invite you to see his published signals.