Multicurrency Tools
- インディケータ
- バージョン: 1.25
- アップデート済み: 23 7月 2024
- アクティベーション: 7

Description
A multi-purpose multi-colored/multi-symbol indicator, which is a set of standard tools from the MetaTrader 4 terminal.
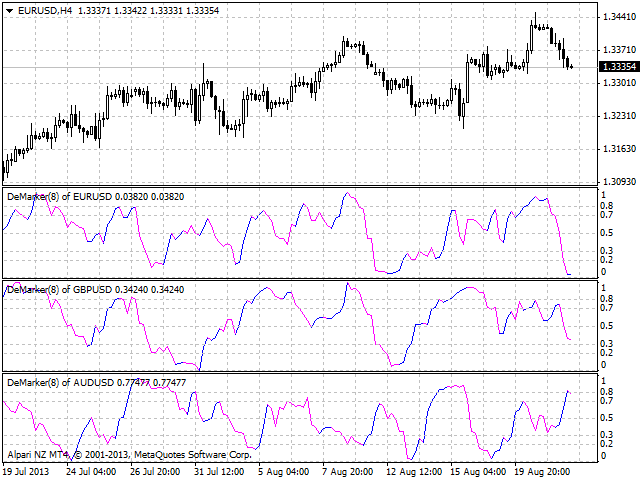
The difference is that below the basic price chart it allows to calculate and build in a separate window any of the twenty indicators in a colored form, painting bulls and bears in different colors, for any financial instrument in accordance with the list below:
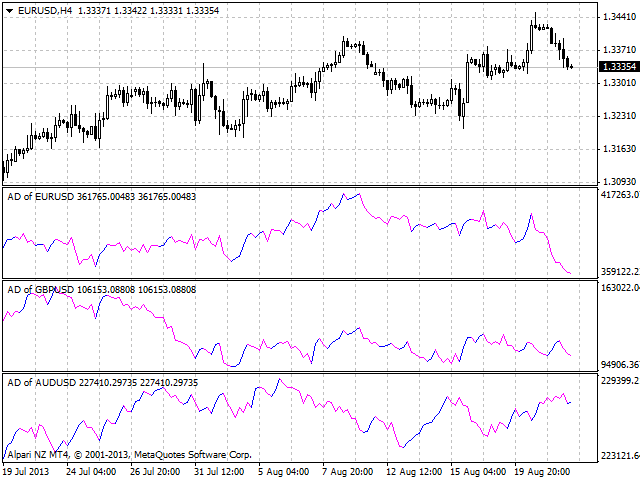
- AD - an indicator of accumulation and distribution of volume.
- OBV - On Balance Volume.
- Force - Force Index indicator.
- MFI - Money Flow Index.
- ATR - Average True Range.
- Momentum.
- Moving Average.
- Standard Deviation.
- CCI - Commodity Channel Index.
- ADX - Average Directional Movement indicator.
- DeMarker.
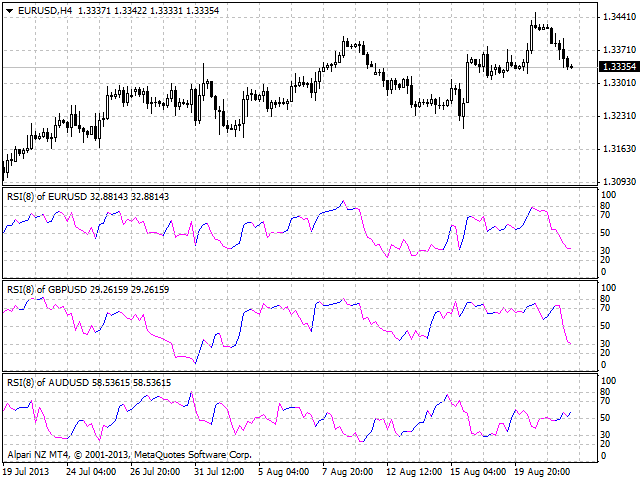
- RSI - Relative Strength Index.
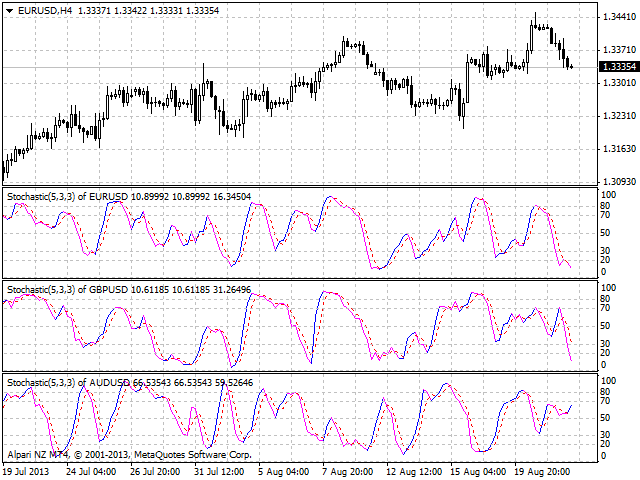
- Stochastic - Stochastic oscillator.
- WPR - Bill Williams oscillator.
- Volume - tick volume indicator.
- AC - indicator of acceleration.
- AO - Williams' oscillator.
- BullsPower.
- BearsPower.
- OsMA - moving average of oscillator.
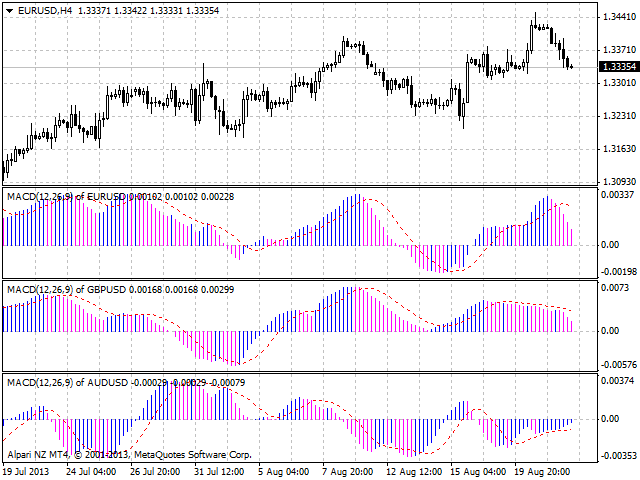
- MACD - moving average convergence/divergence.
The default indicator is AD - an indicator of accumulation and distribution of volume.
Purpose
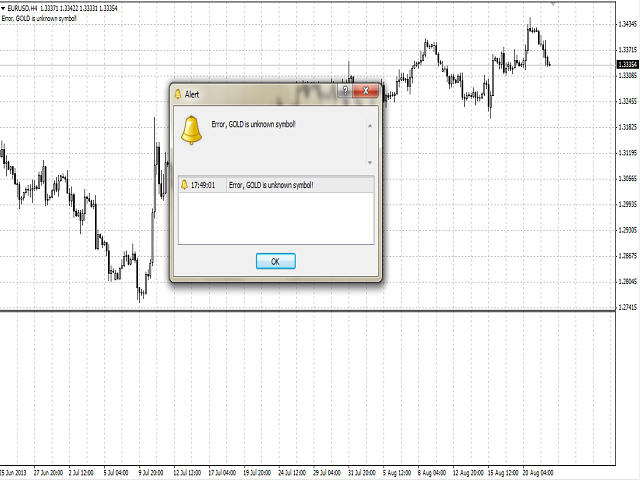
The indicator may be used with any broker, irrespective of the name of the financial instrument since it is necessary to manually enter the name as an input parameter. If you enter a non-existent or incorrect name of a financial instrument, you will receive an error message that this financial instrument is unknown (does not exist).
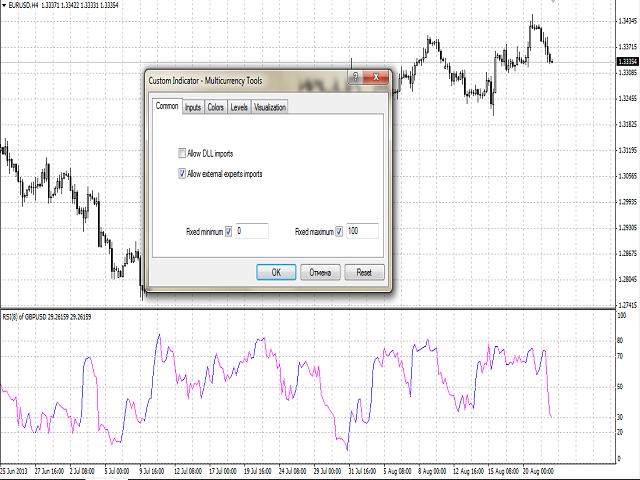
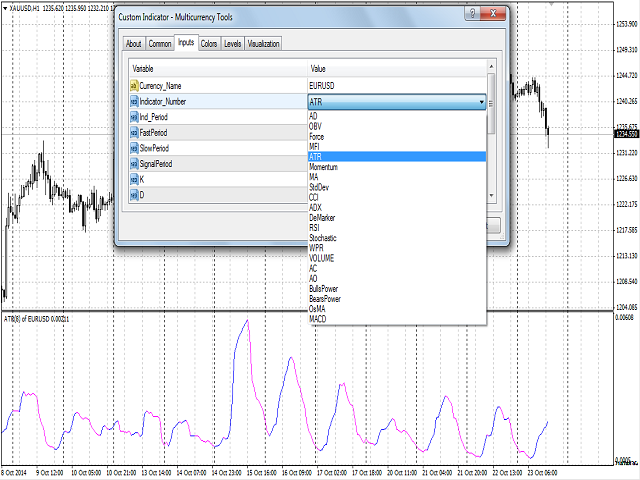
Inputs
- Currency_Name - the name of the financial instrument.
- Indicator_Number - the name of the calculated indicator from the list.
- Ind_Period - the period of the indicators.
- FastPeriod - the period of fast MA for OsMA and MACD.
- SlowPeriod - the period of slow MA for OsMA and MACD.
- SignalPeriod - signal line period for OsMA and MACD.
- K - averaging period for calculating the K line for Stochastic
- D - averaging period for calculating the D line for Stochastic
- Slowing - the slowing value for Stochastic.
- PriceField - price selection parameter for calculating Stochastic:
- Low/High.
- Close/Close.
- MA_Method - the averaging method for the MA and signal lines.
- Applied_Price - Used price.
- Shift - Shift relative to the price chart.
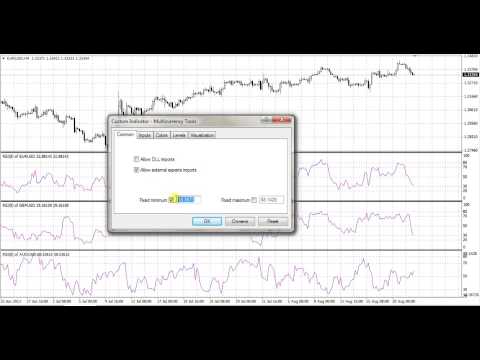
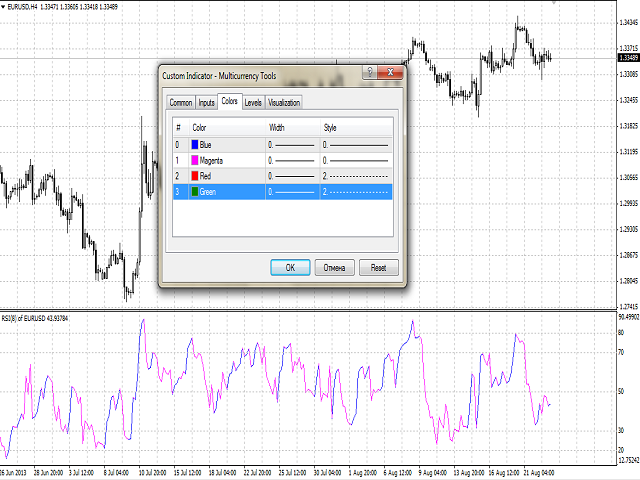
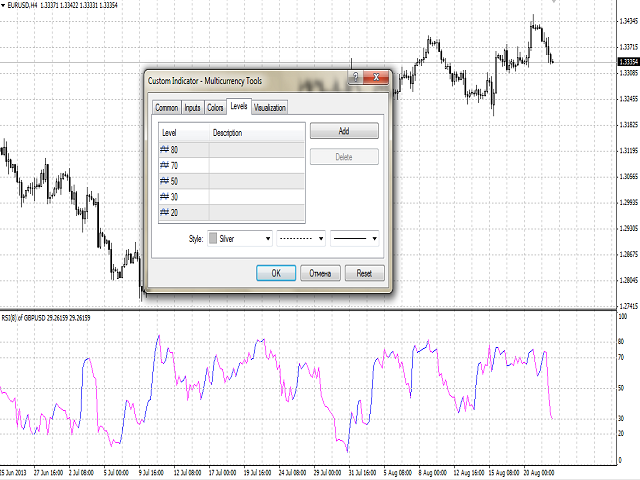
Plotting
The indicator automatically draws internal horizontal lines between the maximum and minimum. The lines of the maximum and minimum must be set manually. For example, for RSI and Stochastic - 0 and 100, for DeMarker - 0 and 1.
When you change, that is recalculate indicators,maximum and minimum lines of the previous indicator should be changed or disabled, internal lines should be deleted.
The simple procedure is shown in the video. To simplify the procedure, remove the previous indicator from the window and attach the new one.
Use
The indicator can be used for manual or automated trading in an Expert Advisor. Values of indicator buffers of the double type can be used for automated trading:
- The line/histogram of the indicator - buffer 4.
- The growth line/histogram (bulls) - buffer 0, must not be empty, i.e. equal to EMPTY_VALUE.
- The fall line/histogram (bears) - buffer 1, must not be empty, i.e. equal to EMPTY_VALUE.
- The signal line for ADX (+DI), Stochastic, MACD - buffer 2.
- The signal line of ADX (-DI) - buffer 3.