Pivot Pro
- インディケータ
- バージョン: 1.22
- アップデート済み: 24 7月 2024
- アクティベーション: 7

Description
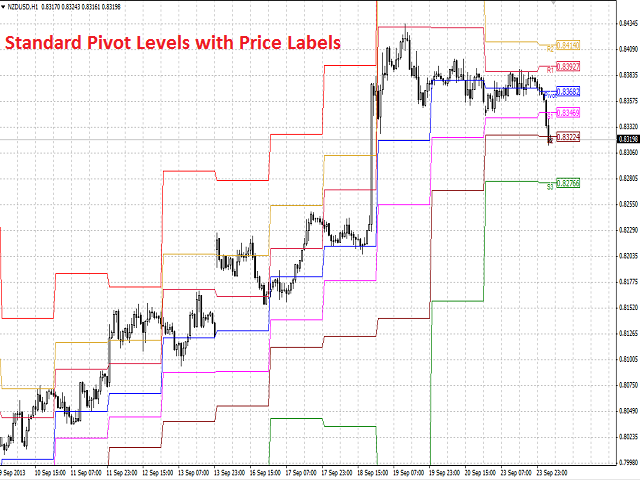
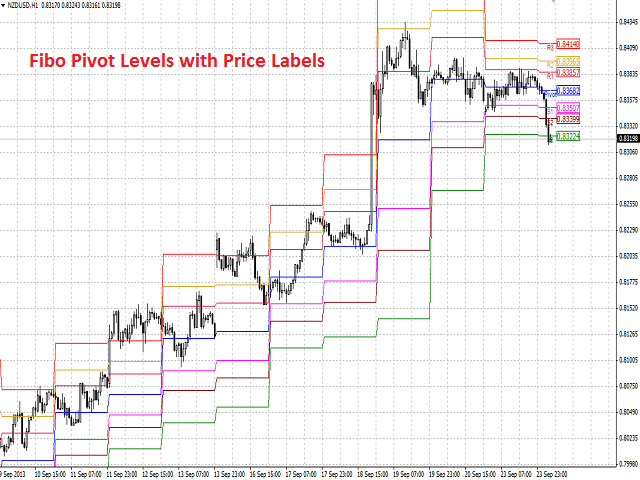
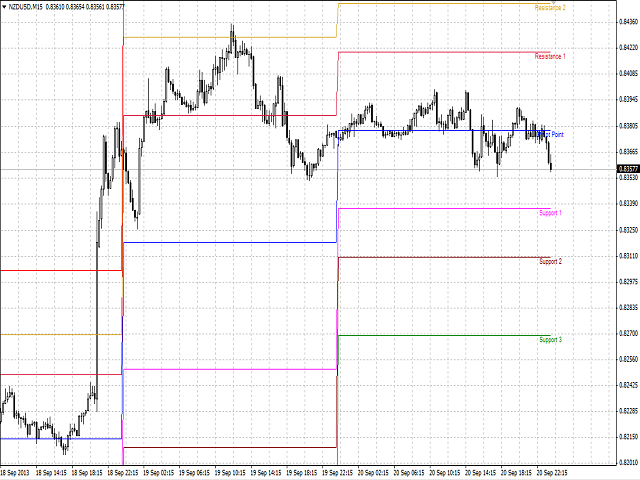
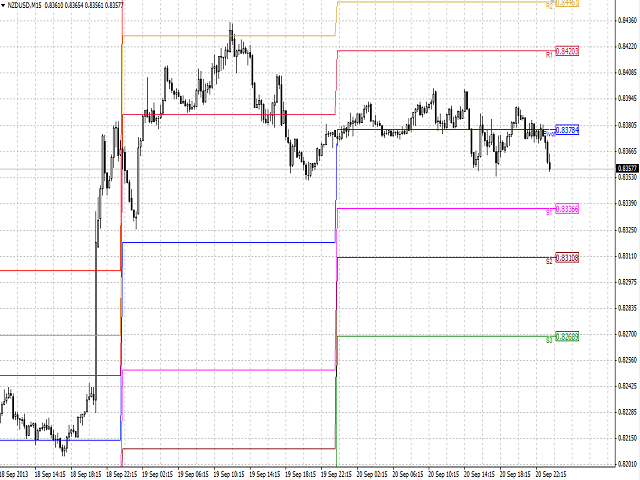
Pivot Pro is a universal color indicator of the Pivot Points levels systems. You can select one of its three versions: Standard Old, Standard New and Fibo.
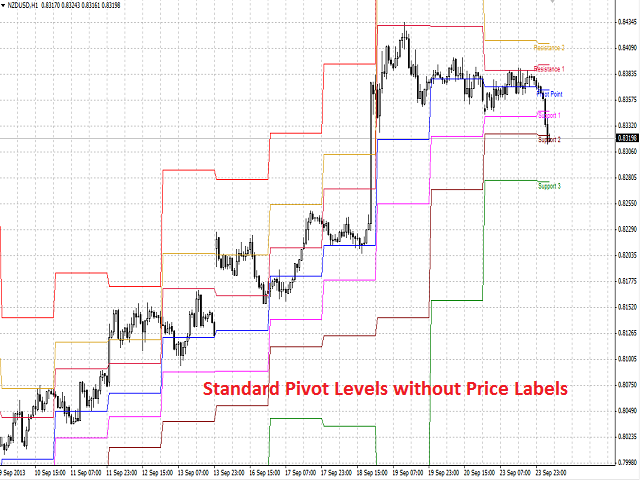
The system will automatically calculate the Pivot Point on the basis of market data for the previous day (PERIOD_D1) and the system of support and resistance levels, three in each. It can also display price tags for each level.
You can color the indicator lines.
Only a method of calculation of the third level of support (S3) and resistance (R3) differs Standard New from Standard Old.
Please see attached video to find differences of all three versions.
Inputs
- Calc_Method - the Pivot Points calculation method:
- Standard Old.
- Standard New.
- Fibo.
- Price_Flag - permission to display price tags.
By default, the system calculates the levels based on the Standard Old method.
Purpose
The indicator can be used for manual or automated trading in an Expert Advisor. Values of indicator buffers of the double type can be used for automated trading:
- Pivot Point - buffer 0.
- Support level 1 - buffer 1.
- Support level 2 - buffer 2.
- Support level 3 - buffer 3.
- Resistance level 1 - buffer 4.
- Resistance level 2 - buffer 5.
- Resistance level 3 - buffer 6.
Depending on the timeframe of the chart, on which the indicator is used, values of the indicator buffers towards the depth of the history should be requested with a shift relative to the zero bar and the same step on the following principle:
- PERIOD_M1: the shift and the step = 1440.
- PERIOD_M5: the shift and the step = 288.
- PERIOD_M15: the shift and the step = 96.
- PERIOD_M30: the shift and the step = 48.
- PERIOD_H1: the shift and the step = 24.
- PERIOD_H4: the shift and the step = 6.
- PERIOD_D1: the shift and the step = 1.