Blahtech Candle Timer MT5
- インディケータ
- バージョン: 1.6
- アップデート済み: 7 2月 2022

Over 100,000 users on MT4 and MT5
Blahtech Candle Timer displays the remaining time before the current bar closes and a new bar forms. It can be used for time management
Links [ Install | Update | Training ]
Feature Highlights
- The only candle timer on MT5 with no stutter and no lag
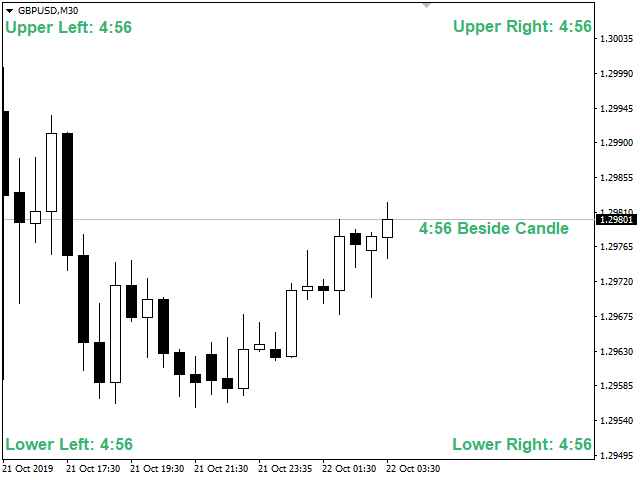
- Selectable Location
- Tracks server time not local time
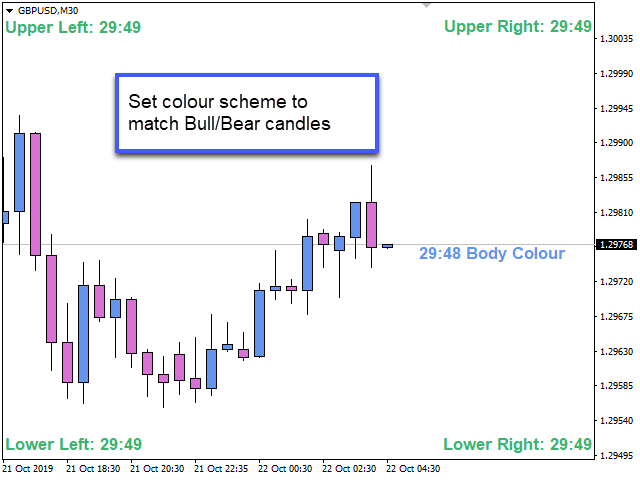
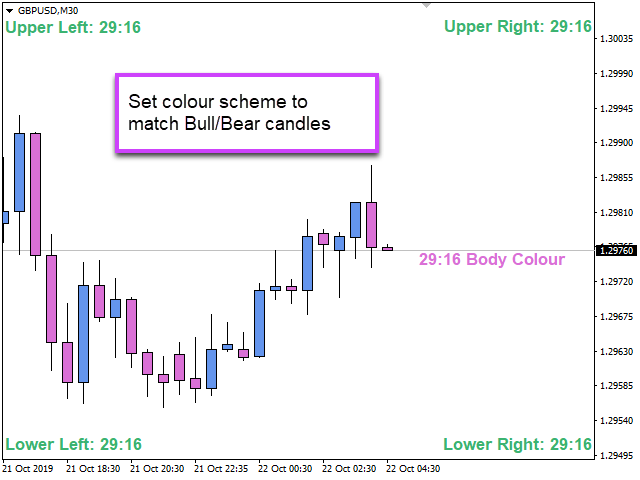
- Multiple colour Schemes
- Configurable Text
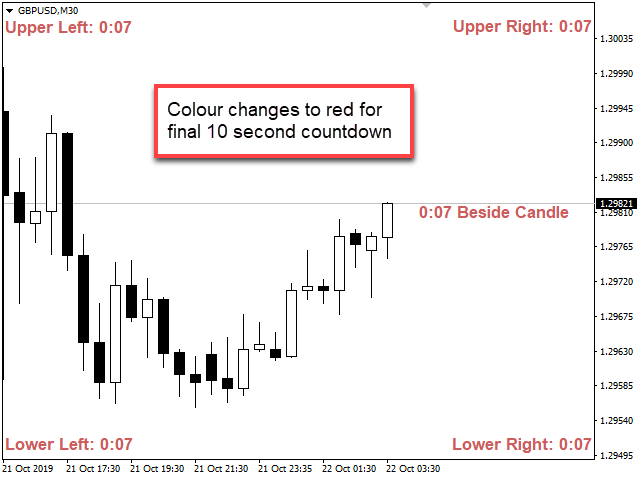
- Customisable alerts and messages
- Optimised to reduce CPU usage
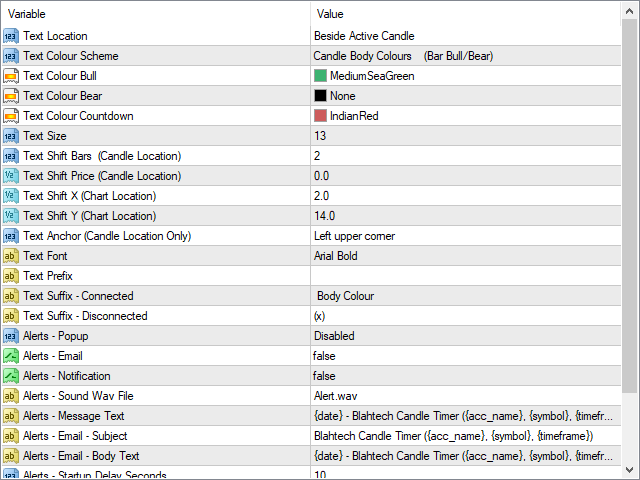
Input Parameters
- Text Location - Beside / Upper Left / Upper Right / Lower Left / Lower Right
- Text Colour Scheme - Manual / Candle Outline Colours (Bar Up/Down) / Candle Body Colours (Bar Bull/Bear)
- Text Colour Bull - Colour for timer text when bar is up
- Text Colour Bear - Colour for timer text when bar is down (or use Bull colour if set to None)
- Text Colour Countdown - Colour when counting down the final 10 seconds (select None to disable)
- Text Size - Font size of timer text
- Text Shift Bars (Candle Location) –Number of Bars to move the text right (when using Candle Location)
- Text Shift Price (Candle Location) - Move the text up by a specified amount (when using Candle Location)
- Text Shift X (Chart Location) – Move the text right by a specified amount (when using Chart Corner Locations)
- Text Shift Y (Chart Location) – Move the text down by a specified amount (when using Chart Corner Locations)
- Text Anchor (Candle Location Only) – Change the anchor point of the text
- Text Font - Font for timer text
- Text Prefix – Display custom text before the timer
- Text Suffix - Active – Display text after the timer when connected to broker server
- Text Suffix - Inactive – Display text after the timer when server detected as inactive
- Text Suffix - Disconnected – Display text after the timer when disconnected from broker server
- Alerts - Popup - Enable/Disable sound and/or popup dialog for active alerts
- Alerts - Email – Enable email alerts
- Alerts - Notification – Enable Notification alerts
- Alerts - Sound Wav File – Change alert sound
- Alerts - Message Text – User customisable popup/notification text
- Alerts - Email - Subject - User customisable email subject text
- Alerts - Email - Body Text - User customisable email body text
- Alerts - Early Seconds - Trigger the alert early to give the user time to react
- Alerts - Startup Delay Seconds - Wait a number of seconds before testing for alerts on startup
- Countdown Seconds - Alter the number of seconds for final countdown
- Inactive Detection Seconds - Set number of seconds to wait before server is set inactive (default no ticks for 20 seconds)
- Custom Period Seconds - Define period seconds for custom charts (e.g. 30 second charts)
- Candle Time Offset Seconds - Allow the user to start a timer candle early. (e.g. If candles are offset by 5 mins)
- Local Time GMT Offset - Add seconds to the local timer clock to match the server clock (normally only used at weekends when markets are closed)
- Instance Id – Unique identifier. Only modify if you need to use multiple instances per chart


👍🏽👍🏽 thumbs up for both versions MT4 and MT5