My Big Bars MT5
- インディケータ
- バージョン: 2.7
- アップデート済み: 7 2月 2023

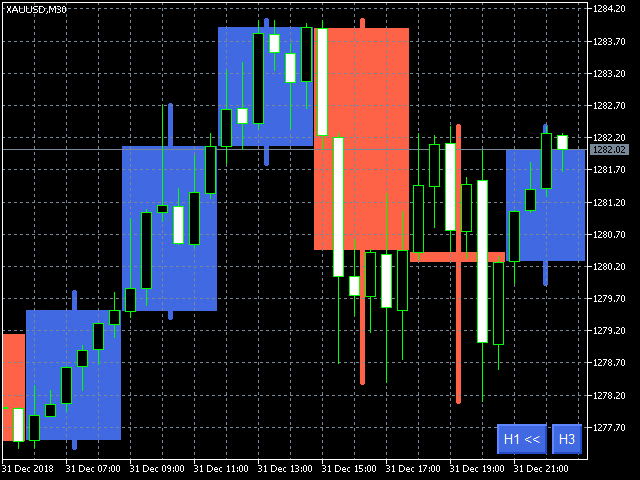
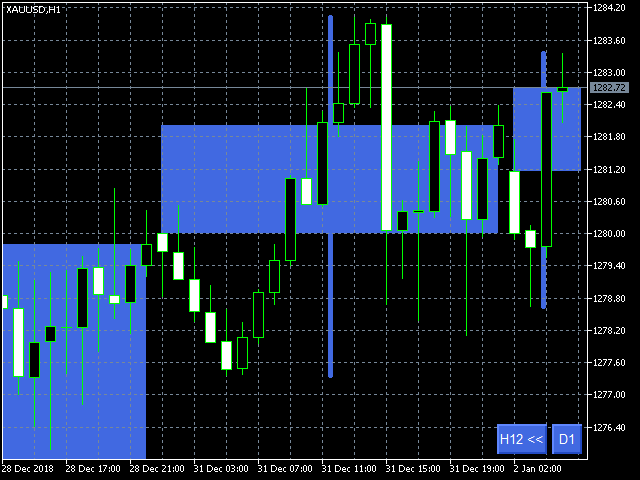
The indicator My Big Bars can show bars (candles) of a higher timeframe. If you open an H1 (1 hour) chart, the indicator puts underneath a chart of H3, H4, H6 and so on.
The following higher timeframes can be applied: M3, M5, M10, M15, M30, H1, H3, H4, H6, H8, H12, D1, W1 and MN.
The indicator chooses only those higher timeframes which are multiple of the current timeframe. If you open an M2 chart (2 minutes), the higher timeframes exclude M3, M5 and M15.
There are 2 handy buttons in the lower right corner. The right button always shows the current higher timeframe. Click it to switch to the next higher timeframe. The left button appears if there is a higher timeframe which is less than the current. This way you can easily switch among the higher timeframes.
A higher timeframe may be delayed when you click the button and there is no available history for the moment.
2 properties of the indicator allow to set the colors for the growing bar and the falling bar.


Excelente indicador para análise de fractal.