Magic 7 Indicator
- インディケータ
- Marek Pawel Szczesny
- バージョン: 1.0
Overview
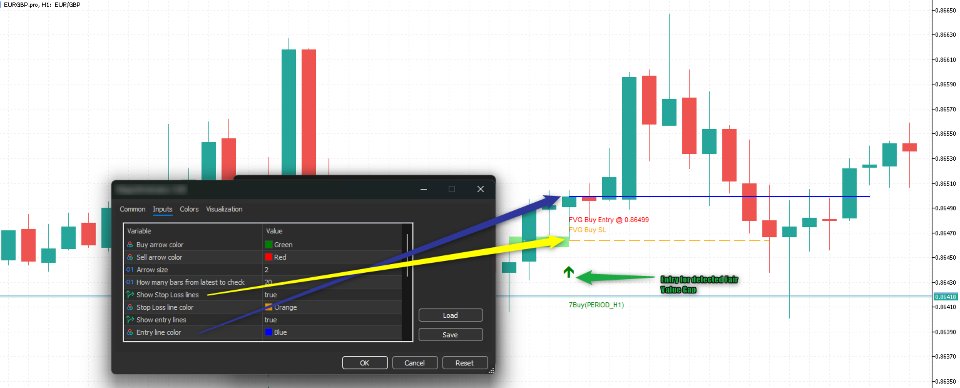
Magic 7 Indicator is a comprehensive MetaTrader 5 (MQL5) indicator that identifies seven different trading scenarios based on candlestick patterns and technical analysis. The indicator combines traditional price action patterns with modern concepts like Fair Value Gaps (FVG) to provide trading signals with precise entry points and stop loss levels.
Features
- 7 Trading Scenarios: Each scenario identifies specific market conditions and trading opportunities
- Visual Signals: Clear buy/sell arrows with customizable colors and sizes
- Entry Lines: Shows exact entry levels for each signal
- Stop Loss Lines: Automatic stop loss calculation and visualization
- Fair Value Gap Detection: Advanced FVG identification and trading signals
- Configurable Parameters: All scenarios can be enabled/disabled individually
Trading Scenarios
Scenario 1: Engulfing Pattern
Description: Identifies bullish and bearish engulfing patterns at fractal points.
Buy Signal Conditions:
- Down fractal present
- First candle: bearish
- Second candle: bullish, engulfs the first candle
- Entry condition: price drops to low of previous candle
Sell Signal Conditions:
- Up fractal present
- First candle: bullish
- Second candle: bearish, engulfs the first candle
- Entry condition: price rises to high of previous candle
Scenario 2: Pinbar Pattern
Description: Detects pinbar reversal patterns with specific body positioning.
Buy Signal Conditions:
- Down fractal present
- First candle: bullish pinbar (open and close above midpoint)
- Second candle: bullish continuation
- Entry condition: price drops to low of previous candle
Sell Signal Conditions:
- Up fractal present
- First candle: bearish pinbar (open and close below midpoint)
- Second candle: bearish continuation
- Entry condition: price rises to high of previous candle
Scenario 3: 3-Bar Continuation
Description: Identifies continuation patterns using three consecutive candles.
Buy Signal Conditions:
- Down fractal present
- First candle: bullish
- Second candle: bearish (low above midpoint of first)
- Third candle: bullish (higher than first)
- Entry condition: price drops to low of previous candle
Sell Signal Conditions:
- Up fractal present
- First candle: bearish
- Second candle: bullish (high below midpoint of first)
- Third candle: bearish (lower than first)
- Entry condition: price rises to high of previous candle
Scenario 4: 3-Bar Reversal
Description: Detects reversal patterns with diminishing momentum.
Buy Signal Conditions:
- Down fractal present
- First candle: bearish
- Second candle: bearish (body ≤ 50% of first)
- Third candle: bullish (higher than first)
- Entry condition: price drops to low of previous candle
Sell Signal Conditions:
- Up fractal present
- First candle: bullish
- Second candle: bullish (body ≤ 50% of first)
- Third candle: bearish (lower than first)
- Entry condition: price rises to high of previous candle
Scenario 5: Breakout Pattern
Description: Identifies breakout signals after consolidation periods.
Conditions:
- Three alternating candles with similar body sizes (≤20% difference)
- Fourth candle with body ≥ 3x larger than previous candles
- Fractal confirmation required
- Entry condition: price retraces to previous candle's extreme
Scenario 6: Shrinking Pattern
Description: Detects patterns with progressively smaller candle bodies followed by expansion.
Buy Signal Conditions:
- Down fractal present
- Three consecutive bearish candles with decreasing body sizes
- Fourth candle closes above high of first candle
- Entry condition: price drops to low of previous candle
Sell Signal Conditions:
- Up fractal present
- Three consecutive bullish candles with decreasing body sizes
- Fourth candle closes below low of first candle
- Entry condition: price rises to high of previous candle
Scenario 7: Fair Value Gap (FVG)
Description: Identifies and trades Fair Value Gaps - price imbalances in the market.
Bullish FVG:
- Three consecutive bullish candles
- Middle candle significantly larger (2x) than others
- Gap between first candle's high and third candle's low
- Entry signal when price partially fills the gap
Bearish FVG:
- Three consecutive bearish candles
- Middle candle significantly larger (2x) than others
- Gap between first candle's low and third candle's high
- Entry signal when price partially fills the gap
Input Parameters
Visual Settings
- BuyArrowColor: Color for buy signal arrows (default: Green)
- SellArrowColor: Color for sell signal arrows (default: Red)
- ArrowSize: Size of signal arrows (default: 2)
- BarsToCheck: Number of recent bars to analyze (default: 20)
Line Settings
- ShowStopLoss: Enable/disable stop loss lines (default: true)
- StopLossColor: Color for stop loss lines (default: Orange)
- ShowEntryLine: Enable/disable entry lines (default: true)
- EntryLineColor: Color for entry lines (default: Blue)
Scenario Controls
- EnableScenario1-7: Individual on/off switches for each scenario
Fair Value Gap Settings
- FVGBullishColor: Color for bullish FVG rectangles (default: Light Green)
- FVGBearishColor: Color for bearish FVG rectangles (default: Light Coral)
- FVGTransparency: FVG rectangle transparency 0-100 (default: 70)
How to Use
- Installation: Add the indicator to your MT5 chart
- Configuration: Adjust input parameters according to your trading style
- Signal Identification: Watch for colored arrows indicating trading opportunities
- Entry Execution: Use entry lines as precise entry levels
- Risk Management: Follow stop loss lines for risk control
- Change the time frames to look for signals
Entry Conditions
All scenarios require specific entry conditions to be met:
- Buy signals: Price must drop to the low of the signal candle
- Sell signals: Price must rise to the high of the signal candle
This ensures that signals are only triggered when price action confirms the setup.
Stop Loss Calculation
Stop loss levels are automatically calculated based on the scenario:
- Engulfing: Stop at the extreme of the engulfed candle
- Pinbar: Stop at the extreme of the pinbar
- 3-Bar patterns: Stop at relevant swing points
- FVG: Stop beyond the violating candle with spread consideration
Visual Elements
The indicator creates several types of visual elements on the chart:
- Arrows: Buy/sell signal indicators
- Lines: Entry and stop loss levels
- Rectangles: Fair Value Gap zones
- Text: Scenario labels and descriptions
Technical Notes
- Fractals: Used to identify significant swing points
- Entry Validation: All signals require subsequent price confirmation
- Multi-timeframe: Works on any timeframe
- Real-time: Updates as new bars form
- Performance: Optimized for real-time analysis
Best Practices
- Combine with other analysis: Use alongside support/resistance levels
- Risk management: Always respect stop loss levels
- Market conditions: Consider overall market trend
- Backtesting: Test scenarios on historical data
- Parameter tuning: Adjust settings for different instruments
Limitations
- Requires sufficient historical data for fractal detection
- Signals are confirmed only after price action validation
- Performance may vary across different market conditions
- Should be used as part of a complete trading system
This indicator is designed for educational and analysis purposes. Always practice proper risk management and consider multiple factors before making trading decisions.

