Forex Time
- インディケータ
- バージョン: 2.4
- アップデート済み: 15 12月 2023
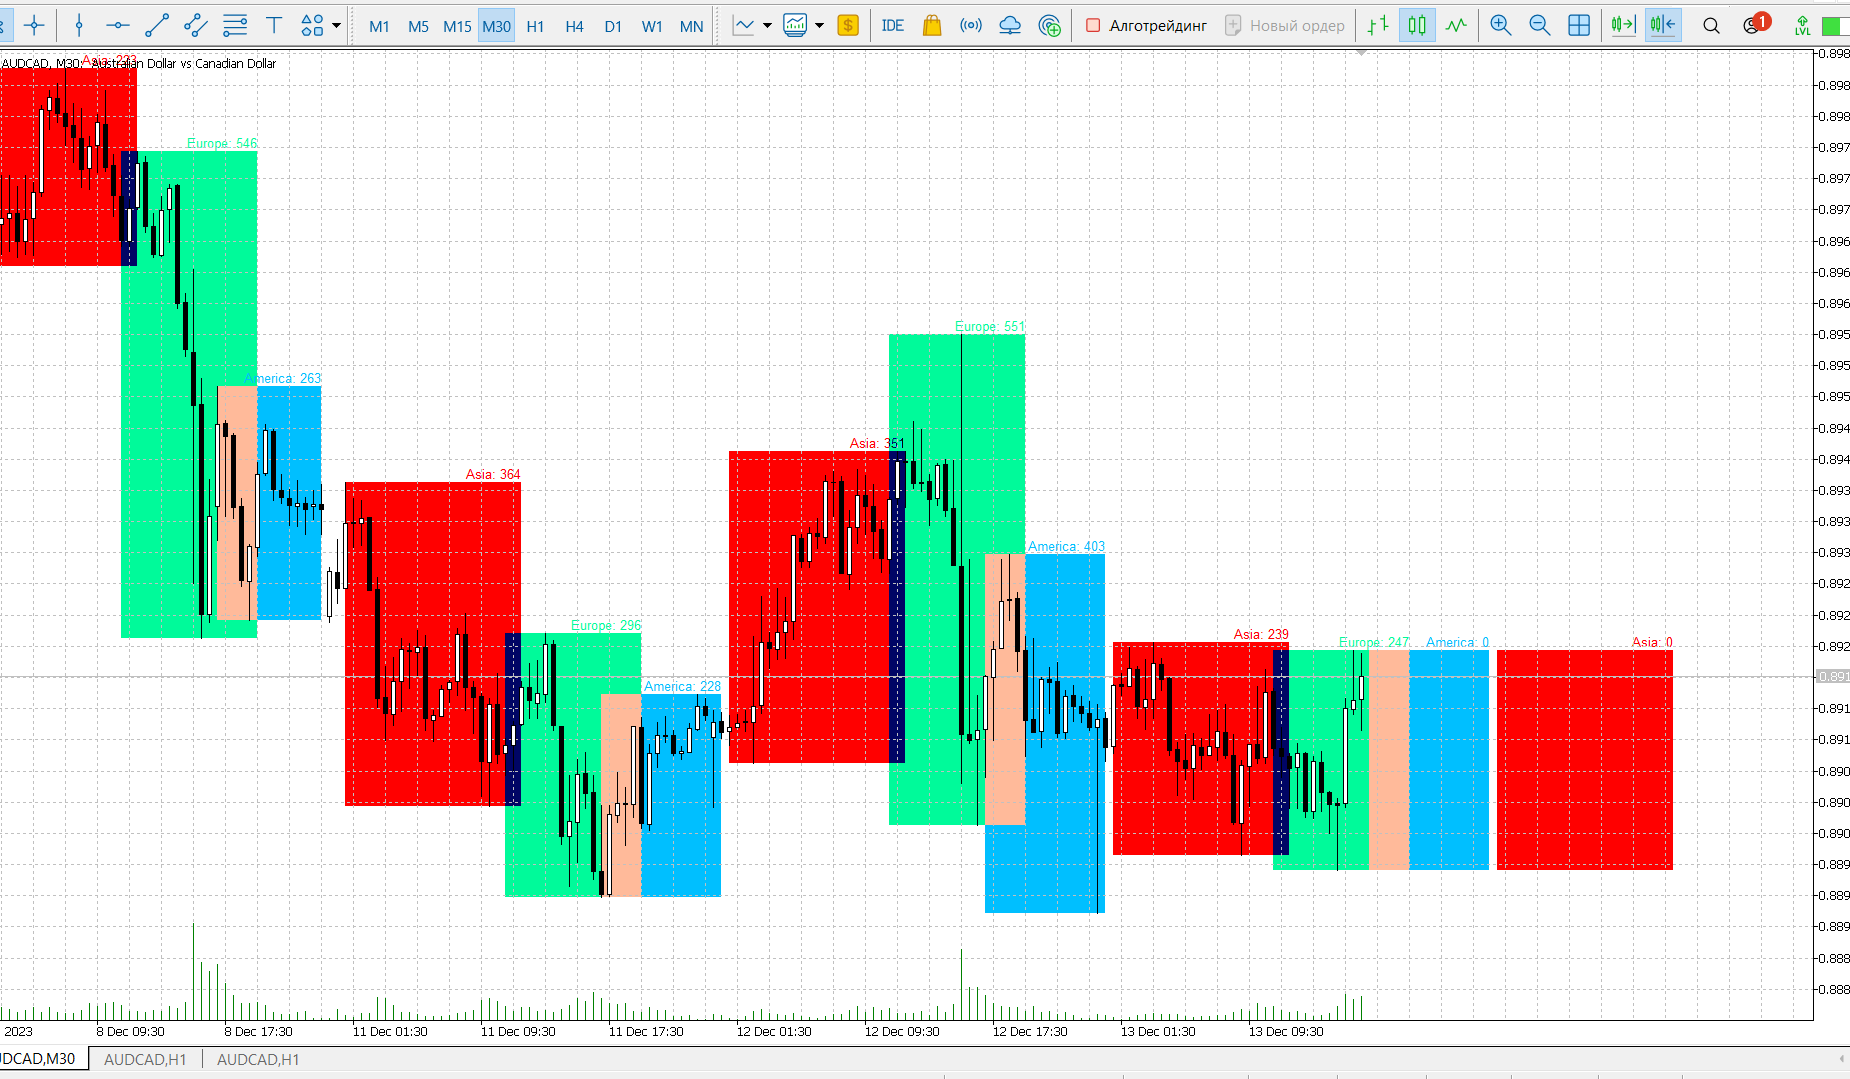
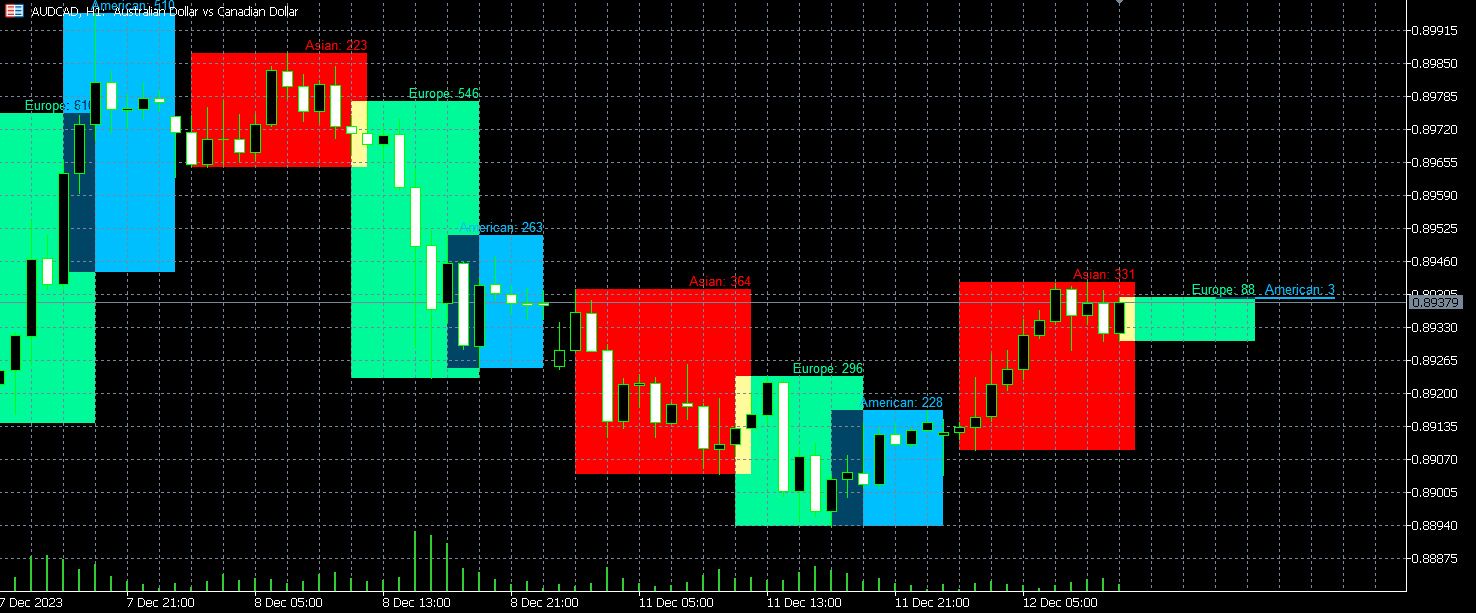
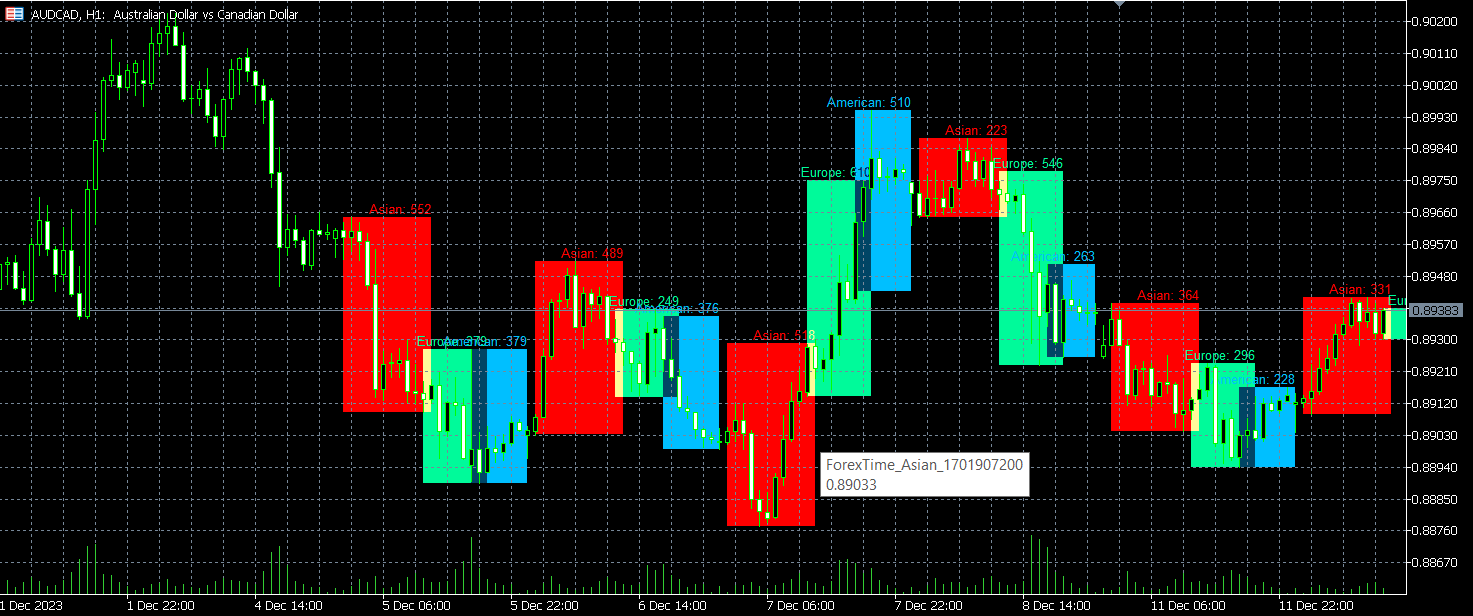
An indicator for visualizing time ranges of key trading sessions: Asian, European, and American.
The indicator features functionality for setting the start and end times of each trading session, as well as an adjustable timezone of the trading server.
The main advantages of the indicator include the ability to operate with minimal CPU load and memory usage. Moreover, it offers the option to specify the number of displayed historical days, providing the user with flexible market dynamics analysis.
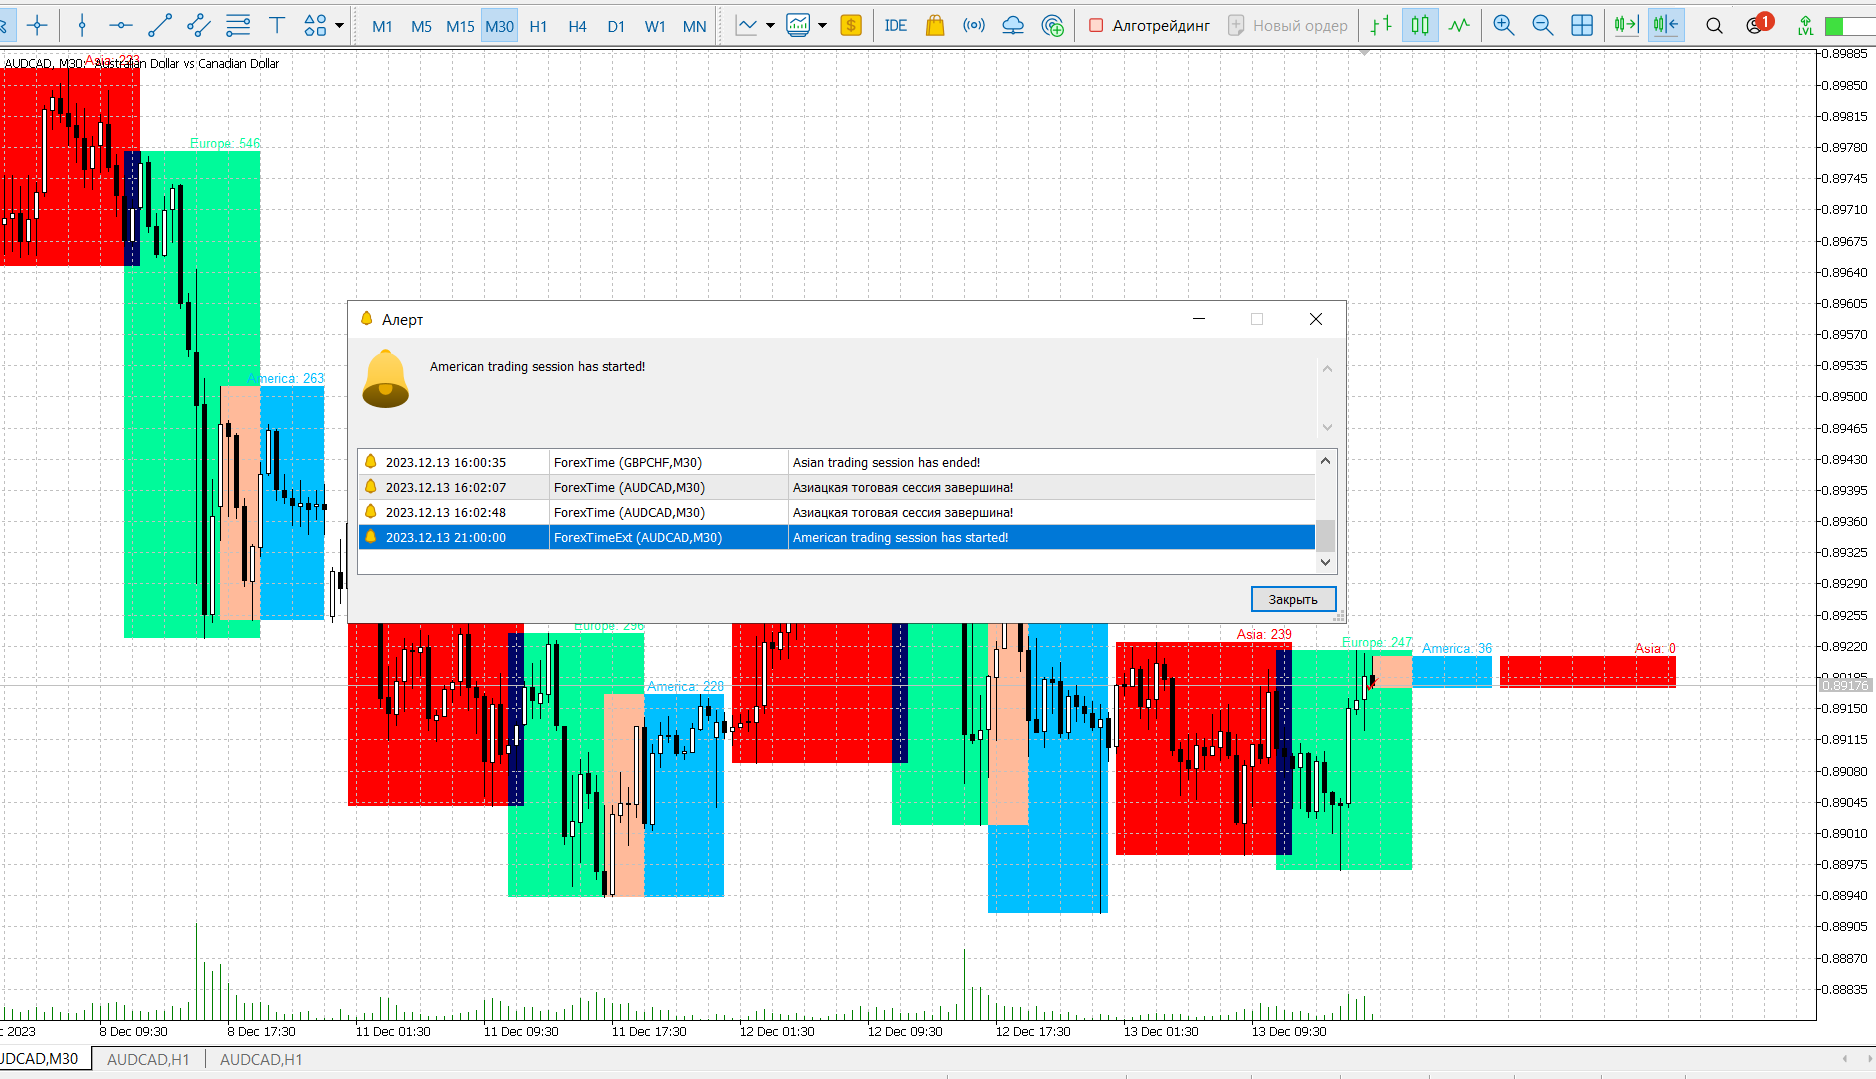
The indicator includes notification mechanisms at the start and end of trading sessions, as well as a time offset for notification to enhance user convenience.
For mobile phone notifications to work, the trading terminal and mobile device must be configured.
The indicator can be useful for applying various trading strategies, considering the precise time frames of trading sessions, which contributes to more effective strategy development and implementation in the market.
Attention! The indicator is built on the M30 timeframe. If only a portion of the specified days loads upon installation, this is due to the absence of historical data. To resolve the issue, switch to M30 so the terminal can load the historical data, and then you can use any timeframe.
If you want to support the developer: https://donate.stream/userforall
BTC: 12WWVt7uKuvwZqyqX28xd8apFWd4FZbev1
ETH: 0x066412f7c3a3e64f2c8f8400fe64de8069bac47e
DASH: XwP6GF56XnMLVvKMHupmneDZkxfojo8r39
очень хорошо