Pivot Points Daily
- インディケータ
- バージョン: 1.3
- アップデート済み: 21 1月 2023

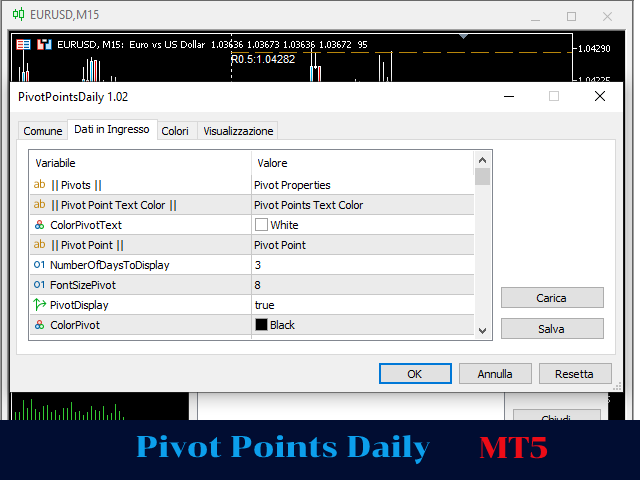
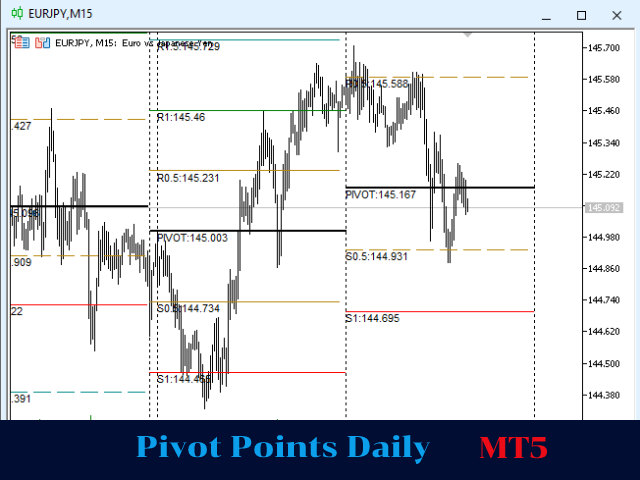
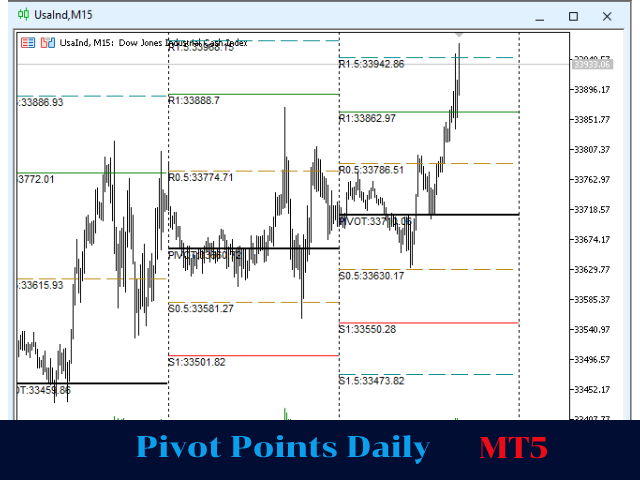
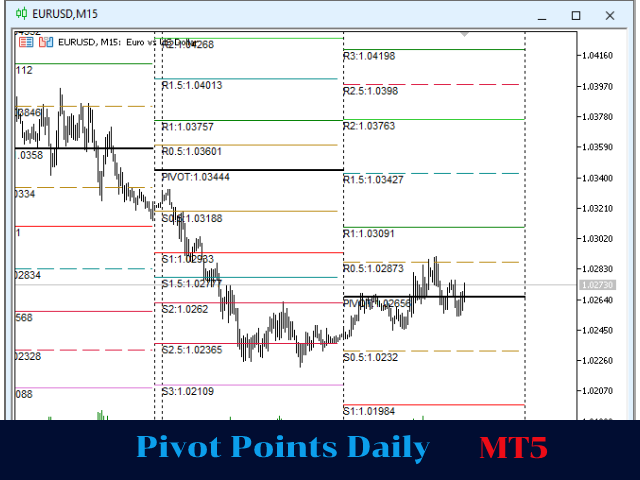
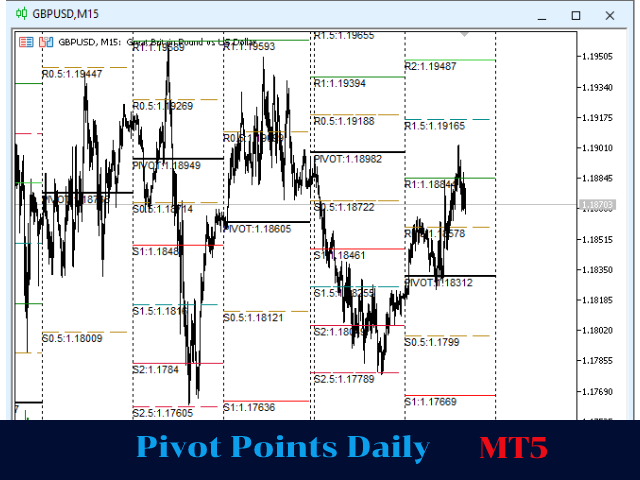
The Indicator show Daily Pivot Points. It is possible to specify the number of days to display. For forex it doesn't consider the sunday session data. It is possibile to modify the color, style and width for every level. It is better to use this indicator with timeframe not higher than Н1. 4 Levels of support and resistance with also Intermediate Levels that is possible to hide.

Simple and works well, please add R4 R5 S4 S5 are usefull in volatile instruments.
Which kind of pivot is used? I can't understand if is a classic, traditional, fibonacci... etc... can you give the possibility to select it? I need the classic.