Volume Compair Indicator

It allows traders to better understand the balance between buying and selling pressure, providing clear visual signals for potential reversals and breakouts.

 Key Features:

 Cumulative Delta Volume: separates buying and selling pressure in real time.

  • Median Buy & Sell Volume lines: highlight equilibrium zones in order flow.

  • Volume Velocity Factor: adjusts delta strength based on sudden volume changes.

  • Smart MFI Alerts: automatic buy/sell arrows appear when Money Flow Index (MFI) reaches overbought/oversold levels.

  •  Fully customizable settings: Cumulative Delta period, range, MFI levels, and velocity factor.

 How to Use:

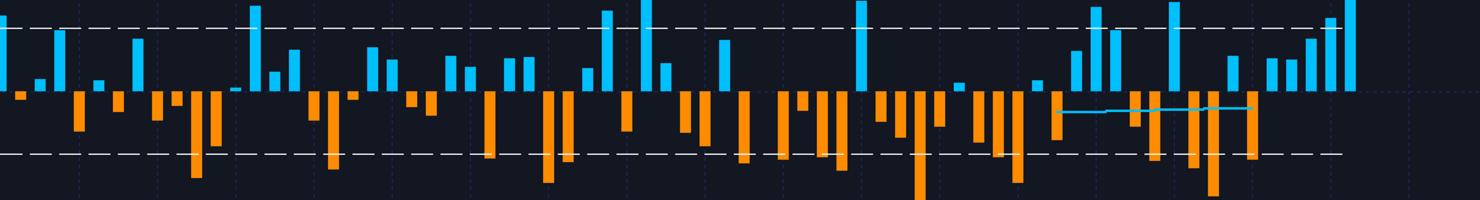
  1. Blue histogram = Cumulative Delta Up (buying pressure).

  2. Orange histogram = Cumulative Delta Down (selling pressure).

  3. White lines = Median Buy & Sell Volumes, showing balance zones.

  4. Green/Red arrows = Automatic alerts for possible reversals when MFI confirms exhaustion.

 Benefits for Traders:

  • Detect hidden buying/selling pressure before price reacts.

  • Combine volume and order flow signals with technical analysis.

  • Anticipate market reversals at extreme volume conditions.

  • Works on Forex, Stocks, Indices, Futures, and Crypto.

  • Ideal for scalpers, day traders, and swing traders.

Prodotti consigliati
Adaptive Math Zones Indicator is a professional MT5 indicator designed to identify high-probability price reaction areas using mathematical price projections and Fibonacci-based channel structures. The indicator automatically builds a reference price channel, highlights neutral zones, and projects future price levels (50%, 100%, and 200%), helping traders visually understand market structure and potential reaction points. This tool is especially effective during ranging and corrective market con
L'esaurimento dell'intervallo si verifica quando il prezzo raggiunge o supera l'intervallo previsto per il periodo corrente. A questi livelli, il prezzo inizia a perdere slancio rispetto all'inizio del periodo, quindi è un buon punto per assicurarsi di non assumere nuove posizioni. Questo indicatore ti mostrerà dove è probabile che ciò accada sul tuo grafico, mostrando i livelli per periodi giornalieri, settimanali e mensili. Quando vedi che il prezzo supera questi livelli di esaurimento, ti sta
BullBea Display
Everton Fernando Da Silva Messias
1. INFORMAZIONI GENERALI Nome Indicatore:   BullBear Display Versione:   1.00 Sviluppatore:   [Il Tuo Nome] Società:   MT5TOOLSLAB Tipo:   Indicatore di Grafico Mercato:   Forex, Azioni, Futures, Criptovalute 2. DESCRIZIONE BullBear Display   è un indicatore visivo che mostra in tempo reale: Forza dei tori (compratori) Forza degli orsi (venditori) Dominanza del mercato (chi controlla il prezzo) L'indicatore mostra queste informazioni nell'angolo superiore sinistro del grafico, consentendo un'an
Percentage Oscillator
Alexandre Borela
5 (1)
Se ti piace questo progetto, lascia una recensione a 5 stelle. Come le istituzioni commerciano grandi volumi, non è raro per loro cercare di difendere la loro posizione a livelli percentuali specifici. Questi livelli serviranno come supporto naturale e resistenza che è possibile utilizzare o entrare in un commercio o essere a conoscenza di possibili pericoli contro la vostra posizione. Questo oscillatore vi mostrerà la variazione percentuale per il: Giorno. Settimana. Mese. Quarto. Anno. In
FREE
Higher Time Frame Bars
Rajesh Kumar Nait
5 (1)
Questo indicatore traccia in modo efficiente qualsiasi altra candela temporale che desideri monitorare sullo stesso grafico 1. Seleziona un intervallo di tempo superiore per caricare le barre sullo stesso grafico 2. Personalizza i colori e lo stile dei candelieri 3. Scegli il numero di barre per disegnare candelieri 4. Tieni traccia delle candele complete con un intervallo di tempo più lungo insieme allo stoppino e al corpo 5. Facile e conveniente per coloro che non vogliono cambiare grafic
The Market Structures Pro indicator finds and displays 5 (five) patterns of the Smart Money Concepts (SMC) system on the chart, namely: Break Of Structures (BoS)       Change of character (CHoCH) Equal Highs & Lows Premium, Equilibrium and Discount zones with Fibo grid High-high, Low-low, High-low and Low-high extremes Patterns are displayed for two modes - Swing and Internal and are easily distinguished by color on the chart. Internal mode features higher contrast colors, finer lines, and smal
Smart Grid Trend EA is an intelligent grid-trend-following Expert Advisor designed specifically for XAUUSD (Gold) . It uses dynamic grid positions , trend filtering , and drawdown control to capture market opportunities on the M5 timeframe . Core Strategy Grid Expansion : Adds new positions as the price moves by a set distance, amplifying profits. Trend Filtering : Trades in the direction of the main trend, avoiding consolidation periods. Dynamic Stop Loss/Take Profit : Stop loss set to 1.5x AT
Supertrendingsignal
OTAVIO AGUIAR CAMPOS Aguiar
O indicador Supertrendingsignal imprime um sinal na tela indicando início de uma forte tendência. O sinal não mostra o ponto de entrada com melhor risco retorno, apenas faz a indicação de uma forte tendência.  Foi idealizado a partir de um conjunto de médias móveis e volume. Parametros: Periodmalongo: Períodos da média longa Periodmamedio: Períodos da segunda media Periodmamedio2: Perídos da terceira media Periodmacurto: Períodos da média curta. PeriodATR: Períodos do indicador ATR para adequar
FREE
Rush Point Histogram Continuity force indicator. Operation: After a breach of support or resistance of an asset, the trader can understand by reading the histogram if such a move tends to continue, thus filtering false breaks or short breaks without trend formation. Through a simple, level-based reading, the trader can make a decision based on the histogram, where: Below 21: No trend formation 21 to 34: Weak trend 34 to 55: Strong Trend 55 to 89: Strong tendency Suggested Reading: Observed disru
No Wick On Close
Flavio Javier Jarabeck
We at Minions Labs love to study, challenge and discover new facts about Price Behavior in current markets. We would NOT call it Price Action because today this is a word totally overused and means, thanks to the False Prophets out there, absolutely NOTHING. The study hypothesis we propose is this: Some Assets, in certain Timeframes, present a behavior of Price continuity when the candlesticks close without a Wick on them... So the purpose of this indicator is to "color" those candlesticks who
FREE
Analise Probabilistica
Valter Cezar Costa
4.78 (9)
I'm sure after a lot of research on the internet, you haven't found any indicator that can help you with forex or binary trading in the latest probability strategy created by famous trader Ronald Cutrim. The strategy is based on a simple count of green and red candles, checking for a numerical imbalance between them over a certain period of time on an investment market chart. If this imbalance is confirmed and is equal to or greater than 16%, according to trader Ronald Cutrim, creator of the pro
FREE
The EA uses scalping strategy at night, trading consists of three algorithms and each algorithm works in its own time interval. The EA uses many smart filters to adapt to almost any economic situation. Pending orders are used for the least slippage when trading scalping. The adviser is safe and does not require any settings from the user, just install it on the chart and you are ready. The EA sets a protective stop order, so the trader does not have to worry that the robot will allow significant
The Easy Trend Trading Indicator delivers quick and accurate BUY/SELL signals, ensuring that traders can make timely decisions. It works flawlessly across various timeframes and supports all symbols, making it a versatile tool for any market. Whether you're trading short-term or long-term, this indicator adapts to your needs with ease. Quick Setup: Simply "Enable" the indicator via input settings With a low memory footprint, the indicator is designed for efficiency, ensuring smooth performance e
Dsc Vwap Channel
Diogo Sawitzki Cansi
4 (1)
Indicador usado para sabermos os pontos de suporte de resistência no gráfico. Funciona em todos ativos e timeframes. Acerte exatamente os pontos de entradas e saídas das suas operações.   SEE OUR RESULTS ON INSTAGRAM:  https://www.instagram.com/diogo.cansi/   TELEGRAM GROUP =  https://t.me/robosdsc More information by email dscinvestimentos@gmail.com or by Whatsapp 55-991372299
FREE
Utilities
Douglas Lucio De Araujo
Indicator with 3 features - Clock : Clock independent of the chart, counting continues even when the market is closed. - Template : After setting up a configuration in any graphic, be it color patterns, indicators, zoom ... The configuration will be copied to all active graphics. - TimeFrame : Set the TimeFrame on a chart, and with just one click all the active charts will be changed to the same TimeFrame.
Beholder
Joao Marcilio
BEHOLDER – THE INDICATOR THAT REVEALS HIDDEN PATTERNS IN TIME THE REAL TRADER’S PROBLEM: TEMPORAL BLINDNESS Every week, thousands of traders face the same dilemma: A flood of economic events (NFP, CPI, Interest Rates, Retail Sales…) Very little time to analyze correlations Decisions made on “gut feeling,” without reliable historical context Trying to do this manually is insane: Scrolling back through dozens of weeks on the calendar Comparing event by event Trying to calculate patt
Liquidity Map
Alex Amuyunzu Raymond
Liquidity Map  Overview The Liquidity Map indicator is an advanced visualization tool based on ICT Smart Money Concepts . It automatically identifies daily Buy Zones , Sell Zones , and Liquidity Levels , showing where price is likely to reverse or continue based on institutional order flow. It calculates key levels from the daily session — such as the previous day’s high, low, and midpoint — then derives a premium (sell bias) and discount (buy bias) structure. When price trades into these mapped
VERSION 2.00 – MAJOR ENGINE UPGRADE This update includes structural breakout improvements, execution filtering upgrades, and enhanced risk protection architecture. GOLD VISION BREAKOUT PRO – Version 2.00 Institutional-Grade Breakout Engine for XAUUSD Gold Vision Breakout Pro V2 is a precision breakout scalper engineered for low-spread, RAW/ECN trading environments. This version introduces a refined swing-structure detection model, enhanced execution filtering, and a strengthened capita
Correlation Matrix Pro - Scanner Multi-Valuta per Copertura Comprendi le relazioni tra le coppie di valute in tempo reale! Un potente strumento di analisi che ti aiuta a visualizzare le relazioni statistiche tra fino a 6 coppie di valute contemporaneamente. Perfetto per la gestione del portafoglio, la diversificazione del rischio e le strategie di copertura. CARATTERISTICHE PRINCIPALI - Correlazione di Pearson in tempo reale con rendimenti logaritmici - Monitoraggio di fino a 6 coppie di valute
FREE
LT Day High Low
Thiago Duarte
4.57 (30)
This indicator draw a line on high and low levels of X number of days. It is possible to have an alert (in the software and mobile app) for when the price breaks the high or low of the current day. Configurações: Days -   past days to calculate (1 = actual day only). Alert when reach levels -   activate the alert for specific levels or both. Push notification -   enable the alert to the mobile MT5 app. Appearance High -   high level color. Low -   low level color. Size actual day -   thickness
FREE
--- StudentK Sync Chart --- 1. Move charts at the same time 2. Cross check among different Symbols and Timeframes 3. Plan your own trading strategies --- Context --- StudentK is not indicated as a master or K Sir for knowledgeable person who claims for winning all the time. (But lots of traders should know the fact that it is rarely truth, especially in fluctuated period of time) StudentK is a group of years-experienced traders who want to share amazing tools in Free and Paid versions. Aiming
RastroBot EA
Raquel Costa
RastroBot usa o indicador Donchian Channel para identificar sinais de entrada, inspirados nas famosas estratégias Turtle. Simples e eficaz, é amplamente utilizado por traders profissionais e está integrado ao MT5. Ideal para quem quer usar esses sinais em operações de scalping. Não usa IA, Martingale ou Grid. Não é um "santo graal" do trading, mas uma estratégia honesta para lucrar com rápidas acelerações de tendência. O EA pode ser usado além do scalping, ajustando ou desativando o trailing
Daily HiLo
Nicanor Jr Cagape Layco
DailyHiLo Indicator Master the daily range like a pro. This indicator automatically plots the previous day’s high and low levels —a core element in the (Beat The Market Maker) trading approach—directly on your chart. These levels act as natural boundaries for intraday price action, helping traders identify potential reversal zones, breakout points, and liquidity targets. Key Features Accurate plotting of yesterday’s high and low for any symbol and timeframe. Works seamlessly with BTMM-inspired
FREE
Xagusd Sentinel
Wycliffe Wanjala Wanyonyi
XAGUSD SENTINEL (MT5) — Breakout & Retest Scalper for XAGUSD/EURUSD on M1 Trade the structure, not the noise. XAGUSD SENTINEL is a precision support/resistance breakout + retest expert advisor purpose-built for XAGUSD (Silver) and EURUSD on the M1 timeframe . It maps dynamic zones from price pivots, times entries on clean breaks or fast retests, and manages risk with basket-level protections—so you can pursue high-frequency setups without letting floating profit slip away.   What makes SENTINEL
Candle Timer Simple
Jithin Sajan Sajan
5 (1)
SETTINGS Make sure to select Chart shift option in the chart.   (Right click in the chart ---> Properties (dialog box) ----> Select Chart Shift) Kindly rate and comment about the product for upgradation & Support When using candlestick timers, keep in mind that the timing of candlestick patterns can play a crucial role in your trading strategy. For instance, different timeframes (such as 1-minute, 5-minute, hourly, ) can provide varying insights into price movements and trends. Make sure to i
FREE
My Point MT5
Claudia Ramona Angerer
Diagnosis of major and minor pivot Trend detection with many signals Can be used in all symbols Can be used in all time frames Settings: Back Show: The number of candles it displays If you need any adjustments, or have any questions or suggestions, message me How to trade: Blue: sell signal Red: buy signal Blue and red at the same time: no signal Exit signal: Opposite signal
Price Action Suvo - Ultimate SMC & Trend Indicator  Key Features 1. Advanced Market Structure (BOS & CHoCH) Dual Structure Analysis:   Automatically identifies both   Internal Structure   (short-term) and   Swing Structure   (major trends). BOS & CHoCH:   Clearly marks   Break of Structure (BOS)   and   Change of Character (CHoCH)   with distinct styles. Visual Perfection: Internal:   Dotted lines for minor structure. Swing:   Solid lines for major structure. No Overlap:   Fixed logic prevent
FREE
EmasFijas
Isaias Villalobos Arias
EmasFijas Multi-Timeframe EMA Indicator for MetaTrader 5 Product Description English: EmasFijas displays EMAs (Exponential Moving Averages) from any timeframe on your current chart. Perfect for multi-timeframe analysis without switching charts. Features an intuitive visual dropdown panel to quickly select any of the 21 available MT5 timeframes. Español: EmasFijas muestra EMAs (Medias Móviles Exponenciales) de cualquier temporalidad en tu gráfico actual. Perfecto para análisis multi-temporalidad
KT Tether Line MT5
KEENBASE SOFTWARE SOLUTIONS
The KT Tether Line is a trend-following tool consisting of three indicators that work together to generate trading signals. It can correctly identify market trends while signaling trade entries. It was first introduced by Bryan Strain in the Stock & Commodities magazine in 2000 in "How to get with the trend and out at the end." The Concept When a market trend is confirmed, the most challenging part is determining the timing of the entries. This indicator alerts you to potential trend reversals
Here I present you this awesome indicator I made. This is a nique combination witch puts you in the same level as MM's. So you can surf a lot of waves and identify the rally time, breakouts, and the perfect time to get in the market. ---- The SSL Channel is a great all-rounder based on 2 Simple Moving Averages, one of recent Highs, one of recent Lows. The calculation prints a   channel   on the chart consisting of 2 lines. This strategy gives a Long signal when price closes above the top of thes
Gli utenti di questo prodotto hanno anche acquistato
ARICoins
Temirlan Kdyrkhan
ARICoin is a powerful trading companion designed to generate high-probability entry signals with dynamic TP/SL/DP levels based on volatility. Built-in performance tracking shows win/loss stats, PP1/PP2 hits, and success rates all updated live. Key Features: Buy/Sell signals with adaptive volatility bands Real-time TP/SL/DP levels based on ATR Built-in MA Filter with optional ATR/StdDev volatility Performance stats panel (Success, Profit/Loss, PP1/PP2) Alerts via popup, sound, push, or email Cust
SuperScalp Pro
Van Minh Nguyen
5 (9)
SuperScalp Pro – Sistema avanzato di indicatore per scalping con filtri multipli SuperScalp Pro è un sistema avanzato di indicatore per scalping che combina il classico Supertrend con molteplici filtri di conferma intelligenti. L’indicatore funziona in modo efficiente su tutti i timeframe da M1 a H4 ed è particolarmente adatto per XAUUSD, BTCUSD e le principali coppie Forex. Può essere utilizzato come sistema stand-alone o integrato in modo flessibile nelle strategie di trading esistenti. L’indi
AriX
Temirlan Kdyrkhan
1 (4)
AriX Indicator for MT5 A powerful trend-following and signal-evaluation tool AriX is a custom MT5 indicator that combines Moving Averages and ATR-based risk/reward logic to generate clear buy/sell signals. It visualizes dynamic SL/TP levels, evaluates past trade outcomes, and displays win/loss statistics in a clean on-chart panel. Key features include: Buy/Sell signals based on MA crossovers ATR-based SL/TP1/TP2/TP3 levels with visual lines and labels Signal outcome tracking with real-time stat
Se acquisti questo indicatore, riceverai il mio Trade Manager Professionale + EA  GRATUITAMENTE. Innanzitutto è importante sottolineare che questo sistema di trading è un indicatore Non-Repainting, Non-Redrawing e Non-Lagging, il che lo rende ideale sia per il trading manuale che per quello automatico. Corso online, manuale e download di preset. Il "Sistema di Trading Smart Trend MT5" è una soluzione completa pensata sia per i trader principianti che per quelli esperti. Combina oltre 10 indicat
FX Trend MT5 NG
Daniel Stein
5 (4)
FX Trend NG: La Nuova Generazione di Intelligenza di Trend Multi-Mercato Panoramica FX Trend NG è uno strumento professionale di analisi del trend multi-timeframe e monitoraggio dei mercati. Ti consente di comprendere la struttura completa del mercato in pochi secondi. Invece di passare tra numerosi grafici, puoi identificare immediatamente quali strumenti sono in trend, dove il momentum sta diminuendo e dove esiste un forte allineamento tra i timeframe. Offerta di Lancio – Ottieni FX Trend NG
Divergence Bomber
Ihor Otkydach
4.89 (83)
Ogni acquirente dell’indicatore riceverà inoltre gratuitamente: L’utilità esclusiva “Bomber Utility”, che gestisce automaticamente ogni operazione, imposta i livelli di Stop Loss e Take Profit e chiude le posizioni secondo le regole della strategia I file di configurazione (set file) per adattare l’indicatore a diversi asset I set file per configurare il Bomber Utility in tre modalità: “Rischio Minimo”, “Rischio Bilanciato” e “Strategia di Attesa” Una guida video passo-passo per installare, conf
Market Flow Pro
Gabriele Sabatino
4 (1)
Market Flow Pro Market Flow Pro is an intelligent trading advisor for the MetaTrader 5 platform, designed for automatic trading on financial markets using algorithmic analysis and strict risk management. -Key features: - Fully automatic trading 24/5 - Adaptive trend and momentum entry algorithm -  Built-in risk management - Flexible lot settings (fixed/auto-calculation) - Support for major currency pairs and indices - Optimised for operation on various timeframes  How it works Market
Entry In The Zone and SMC Multi Timeframe is a real-time market analysis tool developed based on Smart Money Concepts (SMC). It is designed to analyze market structure, price direction, reversal points, and key zones across multiple timeframes in a systematic way. The system displays Points of Interest (POI) and real-time No Repaint signals, with instant alerts when price reaches key zones or when signals occur within those zones. It functions as both an Indicator and a Signal System (2-in-1), c
Grabber System MT5
Ihor Otkydach
4.82 (22)
Ti presento un eccellente indicatore tecnico: Grabber, che funziona come una strategia di trading "tutto incluso", pronta all’uso. In un solo codice sono integrati strumenti potenti per l’analisi tecnica del mercato, segnali di trading (frecce), funzioni di allerta e notifiche push. Ogni acquirente di questo indicatore riceve anche gratuitamente: L’utility Grabber: per la gestione automatica degli ordini aperti Video tutorial passo dopo passo: per imparare a installare, configurare e utilizzare
Power Candles MT5
Daniel Stein
5 (6)
Power Candles – Segnali di ingresso basati sulla forza per tutti i mercati Power Candles porta l’analisi di forza collaudata di Stein Investments direttamente sul grafico dei prezzi. Invece di reagire solo al prezzo, ogni candela viene colorata in base alla reale forza di mercato, consentendo di identificare immediatamente accumuli di momentum, accelerazioni della forza e transizioni di trend pulite. Un’unica logica per tutti i mercati Power Candles funziona automaticamente su tutti i simboli di
RFI levels PRO MT5
Roman Podpora
3.67 (3)
L'indicatore mostra accuratamente i punti di inversione e le zone di ritorno dei prezzi in cui il       Principali attori   . Vedi dove si formano le nuove tendenze e prendi decisioni con la massima precisione, mantenendo il controllo su ogni operazione. VERSION MT4     -    Rivela il suo massimo potenziale se combinato con l'indicatore   TREND LINES PRO Cosa mostra l'indicatore: Strutture di inversione e livelli di inversione con attivazione all'inizio di un nuovo trend. Visualizzazione dei li
Game Changer è un indicatore di tendenza rivoluzionario, progettato per essere utilizzato su qualsiasi strumento finanziario, per trasformare il tuo MetaTrader in un potente analizzatore di trend. Funziona su qualsiasi intervallo temporale e aiuta a identificare i trend, segnala potenziali inversioni, funge da meccanismo di trailing stop e fornisce avvisi in tempo reale per risposte tempestive del mercato. Che tu sia un professionista esperto o un principiante in cerca di un vantaggio, questo st
FX Power MT5 NG
Daniel Stein
5 (31)
FX Power: Analizza la Forza delle Valute per Decisioni di Trading Più Intelligenti Panoramica FX Power è lo strumento essenziale per comprendere la reale forza delle principali valute e dell'oro in qualsiasi condizione di mercato. Identificando le valute forti da comprare e quelle deboli da vendere, FX Power semplifica le decisioni di trading e rivela opportunità ad alta probabilità. Che tu segua le tendenze o anticipi inversioni utilizzando valori estremi di Delta, questo strumento si adatta
Azimuth Pro
Ottaviano De Cicco
5 (4)
LAUNCH PROMO Azimuth Pro price is initially set at 299$ for the first 100 buyers. Final price will be 499$ . THE DIFFERENCE BETWEEN RETAIL AND INSTITUTIONAL ENTRIES ISN'T THE INDICATOR — IT'S THE LOCATION. Most traders enter at arbitrary price levels, chasing momentum or reacting to lagging signals. Institutions wait for price to reach structured levels where supply and demand actually shift. Azimuth Pro maps these levels automatically: swing-anchored VWAP, multi-timeframe structure lines, an
Smart Stop Indicator – Precisione intelligente dello stop-loss direttamente sul grafico Panoramica Smart Stop Indicator è la soluzione ideale per i trader che desiderano posizionare il loro stop-loss in modo chiaro e metodico, senza dover indovinare o affidarsi all’intuizione. Questo strumento combina la logica classica del price action (massimi e minimi strutturali) con un moderno riconoscimento dei breakout per identificare il prossimo livello di stop realmente logico. In trend, in range o i
Atomic Analyst MT5
Issam Kassas
4.1 (29)
Innanzitutto, vale la pena sottolineare che questo indicatore di trading non è repaint, non è ridisegno e non presenta ritardi, il che lo rende ideale sia per il trading manuale che per quello automatico. Manuale utente: impostazioni, input e strategia. L'Analista Atomico è un indicatore di azione del prezzo PA che utilizza la forza e il momentum del prezzo per trovare un miglior vantaggio sul mercato. Dotato di filtri avanzati che aiutano a rimuovere rumori e segnali falsi, e aumentare il pote
RelicusRoad Pro: Sistema Operativo Quantitativo di Mercato 70% DI SCONTO ACCESSO A VITA (TEMPO LIMITATO) - UNISCITI A 2.000+ TRADER Perché la maggior parte dei trader fallisce anche con indicatori "perfetti"? Perché operano su Singoli Concetti isolati. Un segnale senza contesto è una scommessa. Per vincere serve CONFLUENZA . RelicusRoad Pro non è un semplice indicatore. È un Ecosistema Quantitativo completo . Mappa la "Fair Value Road", distinguendo tra rumore e rotture strutturali. Smetti di in
Quantum TrendPulse
Bogdan Ion Puscasu
5 (22)
Ecco   Quantum TrendPulse   , lo strumento di trading definitivo che combina la potenza di   SuperTrend   ,   RSI   e   Stocastico   in un unico indicatore completo per massimizzare il tuo potenziale di trading. Progettato per i trader che cercano precisione ed efficienza, questo indicatore ti aiuta a identificare con sicurezza le tendenze di mercato, i cambiamenti di momentum e i punti di entrata e uscita ottimali. Caratteristiche principali: Integrazione SuperTrend:   segui facilmente l'andame
Trend Lines PRO MT5
Roman Podpora
5 (1)
LINEE DI TENDENZA PRO  Aiuta a capire dove il mercato sta realmente cambiando direzione. L'indicatore mostra reali inversioni di tendenza e punti in cui i principali operatori rientrano. Vedi   Linee BOS   Cambiamenti di tendenza e livelli chiave su timeframe più ampi, senza impostazioni complesse o rumore inutile. I segnali non vengono ridisegnati e rimangono sul grafico dopo la chiusura della barra. VERSIONE MT4   -   Svela il suo massimo potenziale se abbinato all'indicatore   RFI LEVELS PRO
Trend indicator AI mt5
Ramil Minniakhmetov
5 (15)
Trend Ai indicator è un ottimo strumento che migliorerà l'analisi di mercato di un trader combinando l'identificazione della tendenza con punti di ingresso utilizzabili e avvisi di inversione. Questo indicatore consente agli utenti di navigare nelle complessità del mercato forex con fiducia e precisione Oltre ai segnali primari, l'indicatore Ai di tendenza identifica i punti di ingresso secondari che si presentano durante i pullback o i ritracciamenti, consentendo ai trader di capitalizzare le
FX Dynamic MT5
Daniel Stein
5 (5)
FX Dynamic: Monitora volatilità e trend con un’analisi ATR personalizzabile Panoramica FX Dynamic è uno strumento potente che sfrutta i calcoli di Average True Range (ATR) per fornire ai trader informazioni impareggiabili sulla volatilità, sia giornaliera che intraday. Impostando soglie di volatilità chiare—ad esempio 80%, 100%, 130%—puoi individuare rapidamente opportunità di profitto o ricevere avvisi quando il mercato supera i range abituali. FX Dynamic si adatta al fuso orario del tuo brok
Trend Screener Pro MT5
STE S.S.COMPANY
4.84 (101)
Indicatore di tendenza, soluzione unica rivoluzionaria per il trading di tendenze e il filtraggio con tutte le importanti funzionalità di tendenza integrate in un unico strumento! È un indicatore multi-timeframe e multi-valuta al 100% non ridipingibile che può essere utilizzato su tutti i simboli/strumenti: forex, materie prime, criptovalute, indici e azioni. Trend Screener è un indicatore di tendenza che segue un indicatore efficiente che fornisce segnali di tendenza a freccia con punti nel gra
FX Levels MT5
Daniel Stein
5 (13)
FX Levels: Supporti e Resistenze di Precisione Eccezionale per Tutti i Mercati Panoramica Rapida Cercate un modo affidabile per individuare livelli di supporto e resistenza in ogni mercato—coppie di valute, indici, azioni o materie prime? FX Levels fonde il metodo tradizionale “Lighthouse” con un approccio dinamico all’avanguardia, offrendo una precisione quasi universale. Basato sulla nostra esperienza reale con i broker e su aggiornamenti automatici giornalieri più quelli in tempo reale, FX
Top indicator for MT5   providing accurate signals to enter a trade without repainting! It can be applied to any financial assets:   forex, cryptocurrencies, metals, stocks, indices .  Watch  the video  (6:22) with an example of processing only one signal that paid off the indicator! MT4 version is here It will provide pretty accurate trading signals and tell you when it's best to open a trade and close it. Most traders improve their trading results during the first trading week with the help of
Candle Smart Range
Gianny Alexander Lugo Sanchez
Candle Smart Range (CSR) per MetaTrader 5 Candle Smart Range è un indicatore tecnico progettato per l'identificazione automatica dei range di prezzo su più timeframe. Questo strumento analizza la struttura del mercato basandosi sulle formazioni delle candele e sull'interazione del prezzo con i massimi e i minimi precedenti. Caratteristiche principali: Rilevamento Range: Identifica le zone di consolidamento prima dei movimenti impulsivi. Identificazione Falsi Breakout: Segnala quando il prezzo su
Mirage Trading System — False Breakout (Fakey) Pattern Detector for MetaTrader 5 MANUAL   ,   MQL5 Channel Buy any indicator and get a FREE bonus indicator Phantom trading System, SMC retest Trading system, GOLD SCALP System! Send me a private message for details. Overview   Mirage Trading System detects the Fakey pattern (false breakout reversal) on completed bars and draws entry, stop loss, and take profit levels on the chart. Detection is non-repainting: signal values do not change after bar
IX Power MT5
Daniel Stein
4.92 (13)
IX Power: Scopri approfondimenti di mercato per indici, materie prime, criptovalute e forex Panoramica IX Power è uno strumento versatile progettato per analizzare la forza di indici, materie prime, criptovalute e simboli forex. Mentre FX Power offre la massima precisione per le coppie di valute utilizzando i dati di tutte le coppie disponibili, IX Power si concentra esclusivamente sui dati di mercato del simbolo sottostante. Questo rende IX Power una scelta eccellente per mercati non correlat
ARIPoint
Temirlan Kdyrkhan
ARIPoint is a powerful trading companion designed to generate high-probability entry signals with dynamic TP/SL/DP levels based on volatility. Built-in performance tracking shows win/loss stats, PP1/PP2 hits, and success rates all updated live. Key Features: Buy/Sell signals with adaptive volatility bands Real-time TP/SL/DP levels based on ATR Built-in MA Filter with optional ATR/StdDev volatility Performance stats panel (Success, Profit/Loss, PP1/PP2) Alerts via popup, sound, push, or email Cu
Trend Forecaster
Alexey Minkov
5 (7)
The Trend Forecaster indicator utilizes a unique proprietary algorithm to determine entry points for a breakout trading strategy. The indicator identifies price clusters, analyzes price movement near levels, and provides a signal when the price breaks through a level. The Trend Forecaster indicator is suitable for all financial assets, including currencies (Forex), metals, stocks, indices, and cryptocurrencies. You can also adjust the indicator to work on any time frames, although it is recommen
L'indicatore " Dynamic Scalper System MT5 " è progettato per il metodo di scalping, ovvero per il trading all'interno di onde di trend. Testato sulle principali coppie di valute e sull'oro, è compatibile con altri strumenti di trading. Fornisce segnali per l'apertura di posizioni a breve termine lungo il trend, con ulteriore supporto al movimento dei prezzi. Il principio dell'indicatore. Le frecce grandi determinano la direzione del trend. Un algoritmo per generare segnali per lo scalping sott
Altri dall’autore
Sync
Thiago Pereira Pinho
5 (1)
**Sync MT5 – Real-Time Multi-Chart Analysis Manager** Transform your MT5 platform into a professional analysis workstation. Sync is a comprehensive tool that synchronizes charts, objects, and crosshairs across multiple windows, allowing you to trade with unprecedented precision and efficiency. **MAIN FEATURES** 1. **Smart Chart Synchronization**    - Synchronize symbols and timeframes across multiple charts with one click.    - Group system – Organize your charts by strategy or asset.    - A
Fimathe Painel
Thiago Pereira Pinho
5 (1)
Fimathe 3.0: Your Intelligent EA for Trend Detection and Automated Trades! Discover the power of Fimathe (strategy created by Marcelo Ferreira), now with integrated automation for precise and profitable entries in MetaTrader 5. Designed for traders seeking efficiency, this Expert Advisor combines advanced trend analysis with an intuitive and customizable panel. Trade with confidence, minimize risks, and maximize gains! Key Features: Customizable Panel: Choose the size and position of the panel t
Indicador Fimathe
Thiago Pereira Pinho
5 (4)
Fimathe Indicator The   Fimathe Indicator   is a tool for MetaTrader 5 designed to help traders identify support, resistance, neutral zones, and price channels. It features an interactive interface for drawing and managing support and resistance levels, generating take-profit channels and neutral zones, and providing visual and sound alerts for breakouts. Key Features Support and Resistance Lines: Dynamic and draggable lines to identify key levels. Reference Channel: Creates a channel between su
FREE
The Keltner Channel Pro is a modern and enhanced version of the classic Keltner Channel , designed for traders who want to identify trends, reversals, and overbought/oversold zones with greater accuracy.  Built with EMA (Exponential Moving Average) and ATR (Average True Range) , this indicator automatically adapts to market volatility, providing dynamic channels that help filter noise and improve trade timing.  Key Features: Main channel (upper, middle, and lower) based on EMA + ATR. Optional ad
FREE
The   ADX  Histogram   is a modern and visual upgrade of the classic   Average Directional Index (ADX) . It transforms the standard ADX and DI+ / DI– values into a   color-coded histogram , making trend analysis much clearer and faster.  Key Features: Histogram with four states :  Blue = Normal Buy Trend Green = Strong Buy Trend  Orange = Normal Sell Trend  Red = Strong Sell Trend Automatic strength detection : uses the ADX line to separate “normal” vs. “strong” signals.  Fully customizable: ADX
FREE
DTK Scalping Panel
Thiago Pereira Pinho
A powerful and intuitive trade management tool designed for scalpers and intraday traders. Created to complement the Nampim Samba Scalper strategy , it allows traders to open, manage, and close positions quickly without leaving the chart.  Key Features: Customizable trading panel – choose position (left, right, center, top, bottom). One-click trading buttons – instantly open Buy/Sell trades with pre-set lot sizes. Close management – close last 1/2/3 trades or all Buy/Sell positions with one clic
FREE
VForce Pro MT4
Thiago Pereira Pinho
5 (1)
**V-FORCE PRO - L'INDICATORE DI VOLUME AVANZATO PER METATRADER 5** **Scopri la Potenza del Volume Reale con V-Force Pro - La Rivoluzione nell'Analisi di Mercato!** **Smetti di Operare al Buio! Visualizza la Forza dei Grandi Player in Tempo Reale.** **Il Problema che Ogni Trader Affronta:** Ti sei mai chiesto perché alcuni movimenti di mercato falliscono anche quando tutti gli indicatori tecnici puntano nella stessa direzione? La risposta sta nel **VOLUME REALE** - il pezzo più importante del
Volume Compair
Thiago Pereira Pinho
Professional Cumulative Delta & Volume Median Indicator Track   real buying/selling pressure   with this powerful volume analysis tool. The   Volume Compare Indicator   combines   Cumulative Delta   and   Volume Medians   to help you identify institutional activity, imbalances, and potential reversals. Key Features: Cumulative Delta Histogram   – Visualizes net buying vs. selling volume in real-time. Buy/Sell Volume Medians   – Horizontal lines showing average buy & sell volume levels. Smart Vo
CMF Scalping
Thiago Pereira Pinho
Dynamic CMF Calculation: Customize the period for the Chaikin Money Flow (CMF) to fine-tune your analysis and maximize signal precision. Intuitive Color-Coded Alerts: Instantly interpret market conditions with clear visual cues: Green Alert: Indicates the Overbought zone – signaling a potential selling opportunity. Red Alert: Indicates the Oversold zone – suggesting a potential buying opportunity. Gray Alert: Represents the Neutral zone – a signal to wait for a confirmed trend or reversal. Autom
The   Real Flow Defense Levels   indicator is a proprietary tool designed to identify and plot   significant, high-conviction price zones   directly onto your main trading chart. It uses a dynamic, volume-based analysis to determine where the market has previously demonstrated the   strongest defense or concentration of activity . These plotted lines serve as   dynamic support and resistance levels , highlighting the prices where major participants are most likely to enter or defend their positi
The   MarketProfileTPO   indicator for MetaTrader 5 is a powerful tool designed to bring the   Market Profile concept, based on Time Price Opportunity (TPO) analysis , directly onto your main chart window. This indicator calculates and displays the price distribution over a specified period, highlighting key areas of market activity and concentration. It is particularly optimized for   high-volatility instruments   like   NAS100, US30, and XAUUSD   when used on the M1 (1-minute) timeframe, offer
Follow Line MT4
Thiago Pereira Pinho
Stop chasing the market. The Follow Line Indicator provides clear, high-probability signals right on your chart. This advanced tool features a Dynamic Trend Line that instantly adapts to market structure. It’s your immediate visual reference: Blue means you're in an uptrend, and Red signals a downtrend. The core function tracks price extremes and volatility to define the true trend strength. The best part is the automatic signal generation: Buy Arrow: Appears when the trend line flips from Red t
VForce Pro
Thiago Pereira Pinho
**V-FORCE PRO - L'INDICATORE DI VOLUME AVANZATO PER METATRADER 5** **Scopri la Potenza del Volume Reale con V-Force Pro - La Rivoluzione nell'Analisi di Mercato!** **Smetti di Operare al Buio! Visualizza la Forza dei Grandi Player in Tempo Reale.** **Il Problema che Ogni Trader Affronta:** Ti sei mai chiesto perché alcuni movimenti di mercato falliscono anche quando tutti gli indicatori tecnici puntano nella stessa direzione? La risposta sta nel **VOLUME REALE** - il pezzo più importante del
Dynamic CMF Calculation: Customize the period for the Chaikin Money Flow (CMF) to fine-tune your analysis and maximize signal precision. Intuitive Color-Coded Alerts: Instantly interpret market conditions with clear visual cues: Green Alert: Indicates the Overbought zone – signaling a potential selling opportunity. Red Alert: Indicates the Oversold zone – suggesting a potential buying opportunity. Gray Alert: Represents the Neutral zone – a signal to wait for a confirmed trend or reversal. Autom
The MarketProfileTPO indicator for MetaTrader 5 is a powerful tool designed to bring the Market Profile concept, based on Time Price Opportunity (TPO) analysis , directly onto your main chart window. This indicator calculates and displays the price distribution over a specified period, highlighting key areas of market activity and concentration. It is particularly optimized for high-volatility instruments like NAS100, US30, and XAUUSD when used on the M1 (1-minute) timeframe, offering a detailed
The   Real Flow Defense Levels   indicator is a proprietary tool designed to identify and plot   significant, high-conviction price zones   directly onto your main trading chart. It uses a dynamic, volume-based analysis to determine where the market has previously demonstrated the   strongest defense or concentration of activity . These plotted lines serve as   dynamic support and resistance levels , highlighting the prices where major participants are most likely to enter or defend their positi
Follow Line
Thiago Pereira Pinho
The Follow Line Indicator is an essential technical analysis tool that provides a clear, immediate visualization of the trend while detecting high-probability reversals in real-time. By combining adaptive price tracking with clear visual alerts, it transforms complex data into actionable trading signals. Key Features Dynamic Trend Line: Tracks the market's prevailing direction, automatically adjusting to each new price extreme. Clear Colors: The line turns Blue during uptrends and Red during dow
Price Compass
Thiago Pereira Pinho
Il Price Compass è un potente strumento di analisi tecnica progettato per fungere da sistema di navigazione della tendenza sui mercati finanziari. Valuta la pressione direzionale media del mercato, filtrando efficacemente il rumore a breve termine per identificare il movimento dominante con chiarezza. L'indicatore quantifica quanto il prezzo attuale si discosta dalla sua "media centrale", fornendo un segnale preciso sull'orientamento del mercato (Rialzista, Ribassista o Neutro). Interpretazione
Filtro:
Nessuna recensione
Rispondi alla recensione