Advanced Market Maker Dashboard by G Labs mt5

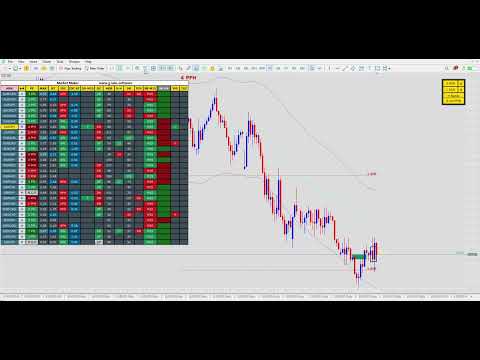
G-Labs Advanced Market Maker Dashboard for MetaTrader 5 is a multi-symbol chart indicator that shows a full BTMM-style workflow: average daily range expansion, price formation, intraday structure, breaker blocks, momentum, divergence, and stop-hunt context across many pairs from one chart.


It is designed for traders who use Beat The Market Maker (BTMM) ideas: market structure, cycle stage, and liquidity behaviour, with a single dashboard instead of flipping charts.


Brief overview

The indicator builds a live table for each watched symbol. The chart symbol can be changed by clicking a row. The panel refreshes on a short timer. A currency strength strip ranks eight majors using the same H1 trend definition as the TREND column. Optional alerts include screen messages and mobile push notifications where MetaTrader allows.


Key features

Multi-symbol dashboard with default lists that you can edit to match your broker symbols.

One-click switch to any listed symbol on the active chart.

Trend column on your chosen time frame (default H1) using fast and slow moving averages.

Price formation labels after the move exceeds one ADR from the swing.

MAX and RT columns for cycle expansion and live position versus the swing, in ADR multiples.

Intraday cycle columns on the second time frame (default M15) with real-time ADR multiple for the intraday leg.

Fifty-period moving average touch flag on the intraday time frame.

Daily candle close context versus the prior day range.

ADR in pips and live daily range with range versus ADR colour hints.

Stop hunt column relative to the early session range on the intraday time frame.

RSI divergence with an ADR multiple filter to reduce noise.

Two breaker time frames (default M15 and H4) with source and breaker rectangles and retest alerts.

TDI column using an embedded volatility-band style momentum signal with optional trend filter versus PF and intraday structure.

Yesterday high and low interaction marker on the intraday time frame.

Currency strength row for USD, EUR, GBP, JPY, AUD, NZD, CAD, CHF: scores from H1 trend across watched pairs, normalized and sorted strongest to weakest, colour coded.

Chart tools: ADR lines from price formation, extended H1 and H4 reference lines, optional historical PF labels, breaker rectangles and price lines, divergence lines, candle countdown, optional ATR channel bands, ADR box helpers on the control strip.

Alerts for breakers, peak formation context, ADR expansion, stop hunt, TDI, and other enabled events.


Setup notes

Symbol names in the inputs must match Market Watch exactly, including suffixes. Separate symbols with commas. If the dashboard layout is misaligned on high-DPI Windows, use Windows compatibility scaling for the terminal or adjust cell width and height in the inputs.


Requirements

MetaTrader 5. Works on any instrument; typical use is forex majors, crosses, and metals. Compatible with any broker that provides the symbols you list.


Disclaimer

This is an analytical indicator. It does not open or manage trades. Past or tester behaviour does not guarantee future results. The seller does not guarantee profit.


Product version: 1.3 with currency strength. Brand: G-Labs.


User documentation: see the seller profile on mql5.com in the comments section of this product or the official G-Labs software site for the Advanced Market Maker MT5 user guide.

おすすめのプロダクト
Prime Power ML は、シグナルを表示する前に勝率でフィルタリングする2つのONNXニューラルネットワークモデルを搭載した高度なCurrency Strength Meterです。通貨間のすべての乖離を表示する従来のCSMインジケーターとは異なり、Prime Power MLはAIが統計的優位性を確認したシグナルのみを強調表示します。 仕組み このインジケーターは、28の通貨ペアすべてにわたるRSIスコアリングを使用して、8つの主要通貨(USD、EUR、GBP、JPY、AUD、CAD、CHF、NZD)の強度をリアルタイムで計算します。2つの通貨間に強度の乖離が現れると、組み込みAIモデルが14の市場特徴を評価し、シグナルにWin Probability(0-100%)スコアを割り当てます。 最低閾値を満たすシグナルのみが AI TOP SIGNALS として表示されます — 信頼度順にランク付けされた現在のチャート上の2つの最良機会です。 2つのAIモデル — タイムフレームに合わせた選択 モード タイムフレーム 学習データ Win Rate(サンプル外) INTRADAY
RBreaker Gold Indicatorsは、金先物の短期日内取引戦略であり、トレンドフォローと日内反転の2つの取引手法を組み合わせたものです。トレンド相場での利益を捉えるだけでなく、相場が反転した際には迅速に利確し、その流れに沿ってポジションを反転させることができます。 この戦略は、アメリカの雑誌『Futures Truth』において、15年連続で最も収益性の高い取引戦略トップ10に選ばれた実績を持ち、非常に長いライフサイクルを誇り、現在も国内外で広く使用・研究されています。 本インディケーターは、2026年の金先物の値動きに対応し、14日間のATR指標に基づいて、ブレイクアウト係数A、観察係数B、リバーサル係数Rをより合理的な値で定義しています。非常に優れたインディケーターであり、安定的な年間収益を実現しています。ぜひおすすめします〜
Improved version of the free HMA Trend indicator (for MetaTrader 4) with statistical analysis. HMA Trend is a trend indicator based on the Hull Moving Average (HMA) with two periods. HMA with a slow period identifies the trend, while HMA with a fast period determines the short-term movements and signals in the trend direction. The main differences from the free version: Ability to predict the probability of a trend reversal using analysis of history data. Plotting statistical charts for analyzi
SPECIAL LAUNCH OFFER: $30 (1-Month Rent) Limited time offer to build our community and gather feedback! AmbM GOLD Institutional Scalper A high-precision M5 algorithm for XAUUSD (Gold) , engineered to trade exclusively at Institutional Liquidity Levels ($5/$10 psychological marks). PERFORMANCE DATA (BUY ONLY) • Win Rate: 87.09%. • Safe Growth: +$4,113 profit on $10k (13.75% Max Drawdown). • Extreme Stress Test: Successfully generated +$22,997 in a 5-year stress test (2020-2026), proving
SMC Venom Model BPR インジケーターは、スマート マネー (SMC) コンセプトで取引するトレーダー向けのプロフェッショナル ツールです。価格チャート上の 2 つの主要なパターンを自動的に識別します。 FVG   (フェアバリューギャップ) は、3 本のローソク足の組み合わせで、最初のローソク足と 3 番目のローソク足の間にギャップがあります。ボリュームサポートのないレベル間のゾーンを形成し、価格修正につながることがよくあります。 BPR   (バランス価格範囲) は、2 つの FVG パターンの組み合わせで、「ブリッジ」を形成します。これは、価格がボリュームアクティビティの少ない動きで動くときに、ブレイクアウトしてレベルに戻るゾーンで、ローソク足の間にギャップを作成します。 これらのパターンは、大規模な市場プレーヤーと一般参加者の相互作用が発生するチャート上のボリュームと価格動向の分析に基づいて、トレーダーが主要なサポート/レジスタンス レベル、ブレイクアウト ゾーン、エントリ ポイントを識別するのに役立ちます。 インジケーターは、長方形と矢印の形でパターンを視覚
Volality Index scalper indicator  Meant for Volality pairs such as Volality 10, 25, 50, 75 and 100 The indicator works on all timeframes from the 1 minute to the monthly timeframe the indicator is non repaint the indicator has 3 entry settings 1 color change on zero cross 2 color change on slope change 3 color change on signal line cross Orange line is your sell signal Blue line is your buy signal.
このインジケータは、AB = CDリトレースメントパターンを検出します。 AB = CDリトレースメントパターンは、初期価格セグメントが部分的にリトレースされ、プルバックの完了から等距離の動きが続く4ポイントの価格構造であり、すべての調和パターンの基本的な基盤です。 [ インストールガイド | 更新ガイド | トラブルシューティング | よくある質問 | すべての製品 ] カスタマイズ可能なパターンサイズ カスタマイズ可能なACおよびBD比率 カスタマイズ可能なブレイクアウト期間 カスタマイズ可能な線、色、サイズ CD fiboレベルに基づいてSLおよびTPレベルを表示します パターンとブレイクアウトの視覚/音声/プッシュ/メールアラート AB = CDリトレースメントは、かなり拡大して再描画できます。物事を簡単にするために、このインディケーターはひねりを実装します。トレードをシグナルする前に、正しい方向へのドンチャンブレイクアウトを待ちます。最終結果は、非常に信頼性の高い取引シグナルを備えた再描画インジケーターです。ドンチャンのブレイクアウト期間が入力として入力されます。 強
ATrend
Zaha Feiz
4.83 (18)
ATrend: その仕組みと使い方 仕組み MT5プラットフォーム向けの「ATREND」インジケーターは、テクニカル分析手法の組み合わせを利用して、トレーダーに堅牢な買いと売りのシグナルを提供するように設計されています。このインジケーターは主に、ボラティリティ測定のために平均真の範囲(ATR)を活用し、潜在的な市場動向を特定するためのトレンド検出アルゴリズムを併用しています。 購入後にメッセージを残すと、特別なボーナスギフトが贈呈されます。 主な特徴: - ダイナミックなトレンド検出: インジケーターは市場トレンドを評価し、シグナルを適宜調整することで、トレーダーが優位な市場環境に合わせて戦略を立てるのを支援します。     - ボラティリティ測定: ATRを使用することで、インジケーターは最適なストップロス(SL)とテイクプロフィット(TP)レベルを決定するために不可欠な市場ボラティリティを測定します。 - シグナルの視覚化: インジケーターは、チャート上に買いと売りのシグナルを視覚的に表示することで、トレーダーの意思決定を強化します。 操作手順 入力とセッティング - TimeF
回帰取引を意味する専門的かつ定量的なアプローチを実装する独自の指標。これは、価格が予測可能かつ測定可能な方法で迂回して平均に戻るという事実を利用しており、非定量的な取引戦略を大幅に上回る明確な出入りルールを可能にします。 [ Installation Guide | Update Guide | Troubleshooting | FAQ | All Products ] 明確な取引シグナル 驚くほど簡単に取引できます カスタマイズ可能な色とサイズ パフォーマンス統計を実装します ほとんどの取引戦略を上回ります 適切なSLおよびTPレベルを表示します 電子メール/音声/視覚アラートを実装します 使い方 インディケータは、より高い時間枠からの完全にカスタマイズ可能な移動平均の周りの標準偏差を測定し、トレンドフォローアプローチを使用して正確に取引を見つけます。取引は、現在のチャートの価格アクションに飛び込むことによって見つけられ、価格が選択したより高い時間枠から計算された平均価格帯に戻ったときに閉じられます。それがコード化される方法のために、指標は高ボラティリティと強いトレンドの市場か
STRICTLY FOR BOOM INDEX ONLY!!!!! Here I bring the Maximum Trend Arrows OT1.0 MT5 indicator. This indicator is made up of a combination of different trend indicators for entries and exits, for entries an orange arrow will paint on the chart below the current market and a red flag for closing of trades and it produces buy arrows only. When the orange arrow appears, it will appear along with it's sound to notify you. The 1H timeframe is recommended, don't use it anywhere else than on the 1H timefr
Caicai L&S Yield Histogram Important Notice: This indicator is an integral tool of the automated EA Caicai Long and Short Pair Trading . This indicator visually displays the percentage deviation (Yield %) of a pair's current spread relative to its own historical mean. It is an excellent tool for quickly visualizing the gross financial potential of a market distortion in Long & Short operations. Main Features: Percentage Visualization: Understand the size of the distortion in palpable percentage
Max Min Delta Indicator - Market Volume Imbalance Analysis Gain Deeper Insights into Market Volume Imbalance with Delta Analysis What is the Max Min Delta Indicator? The Max Min Delta Indicator is a powerful market volume analysis tool that visually represents maximum and minimum delta values using a histogram. It helps traders identify market strength, weakness, absorption, and aggressive buying/selling activity with precision. Key Features Histogram Visualization: Displays Max Delta (Green) an
CosmiCLab SMC FIBO CosmiCLab SMC FIBO is a professional trading indicator designed for traders who use Smart Money Concepts (SMC), market structure analysis and Fibonacci retracement levels. The indicator automatically detects market swings and builds Fibonacci levels based on the latest impulse movement. It also identifies market structure changes such as BOS (Break of Structure) and CHOCH (Change of Character), helping traders understand the current market direction. CosmiCLab SMC FIBO also pr
Smart Market Structure Pro is a complete Smart Money Concepts and ICT indicator that maps institutional order flow on any chart, any timeframe, for MetaTrader 5 and MetaTrader 4. Please see the comments section for the full user guide  Attach it to a chart and the indicator draws Break of Structure (BOS), Change of Character (CHoCH), Order Blocks, Fair Value Gaps, Liquidity Sweeps, Premium/Discount zones, ICT session windows, and a real-time Confluence Score from 0 to 10 — all controlled from a
Your Trend Friend
Luigi Nunes Labigalini
5 (1)
The trend is your friend! Look at the color of the indicator and trade on that direction. It does not  repaint. After each candle is closed, that's the color of the trend. You can focus on shorter faster trends or major trends, just test what's most suitable for the symbol and timeframe you trade. Simply change the "Length" parameter and the indicator will automatically adapt. You can also change the color, thickness and style of the lines. Download and give it a try! There are big movements w
Indicator Name: Fibaction – price action candle Detector Description: Fibo Signal Boxes is a powerful Smart Money Concept (SMC)-inspired indicator that auto-detects price action candles. bullish hammers and shooting stars, then draws precise Fibonacci entry zones and multiple take-profit levels directly on the chart. as for the SL personally i use 40 pips rules  Key Features: Detects bullish hammer and shooting star reversal candles. Automatically draws Fibonacci entry and TP boxes. as
市場ボリュームプロファイル指標 + スマートオシレーター。通貨ペア、株式、先物、暗号資産など、ほぼすべての銘柄で動作し、リアルボリュームとティックボリュームの両方に対応しています。プロファイル作成範囲は、1週間や1ヶ月などの自動設定のほか、境界線(赤と青の2本の垂直線)を動かして手動で設定することも可能です。ヒストグラム形式で表示され、特定の価格レベルにおけるヒストグラムの幅は、その価格帯で行われた取引量(約定数)を表します。 Mode level line color パラメータを使用すると、価格が反発する可能性が高い重要なボリュームレベルを自動表示できます。また、 Maximum color パラメータは、指定した範囲全体で最も取引が集中した最大ボリュームレベルを個別に表示します。 スマートオシレーターは買われすぎ・売られすぎのゾーンを表示します。複数のインジケーターからの情報を分析し、処理されたデータに基づいて、買われすぎと売られすぎのゾーンを対応する色で塗りつぶします。 Volume every day では、 Range period パラメータでプロファイル作成の時間間隔を
A powerful oscillator that provide Buy and Sell signals by calculating the investor liquidity. The more liquidity the more buy possibilities. The less liquidity the more sell possibilities. Please download the demo and run a backtest! HOW IT WORKS: The oscillator will put buy and sell arrow on the chart in runtime only . Top value is 95 to 100 -> Investors are ready to buy and you should follow. Bottom value is 5 to 0 -> Investors are ready to sell and you should follow. Alert + sound will appe
まず第一に、この取引ツールはノンリペイント、ノンリドロー、ノンラグの指標であり、プロの取引に理想的ですことを強調する価値があります。 オンラインコース、ユーザーマニュアル、デモ。 スマートプライスアクションコンセプトインジケーターは、新米から経験豊富なトレーダーまで、非常 に強力なツールです。Inner Circle Trader AnalysisやSmart Money Concepts Trading Strategiesなど、20以上の有用な指標を1つに組み合わせています。このインジケーターはスマートマネーコンセプトに焦点を当て、大手機関の取引方法を提供し、彼らの動きを予測するのに役立ちます。 特に、流動性分析に優れており、機関がどのように取引しているかを理解しやすくしています。市場のトレンドを予測し、価格の動きを慎重に分析するのに優れています。機関の戦略とトレードを合わせることで、市場の動向についてより正確な予測ができます。このインジケーターは多目的であり、市場構造を分析し、重要な注文ブロックを特定し、さまざまなパターンを認識するのに優れています。 このインジケーター
**   All Symbols   x   All Timeframes   scan just by pressing scanner button ** Discount: The price is $50$, But now it is just $39, Limited time offer is active. *** Contact me  to send you instruction and add you in "Trend Reversal group" for sharing or seeing experiences with other users. Introduction: Trendlines are the most famous technical analysis in trading . Trendlines continually form on the charts of markets across all the different timeframes providing huge opportunities for traders
KT Renko Patterns は、レンコチャートの各レンガをスキャンしながら、さまざまな金融市場でトレーダーによく使用されている有名なチャートパターンを検出します。 時間ベースのチャートと比較して、レンコチャートは視認性が高くシンプルなため、パターンベースのトレードがより簡単かつ明確になります。 KT Renko Patterns は複数のレンコパターンを搭載しており、その多くは Prashant Shah 氏の著書『Profitable Trading with Renko Charts』でも詳しく解説されています。 KT Renko Patterns インジケーターに基づいた 100% 自動化された EA は、こちらからご利用いただけます - KT Renko Patterns EA 。 機能一覧 最大8種類の明確なレンコパターンを表示し、あいまいさなく取引をサポートします。 完全な客観性を保つため、すべてのパターンにストップロスとフィボナッチターゲットが設定されています。 KT Renko Patterns は各パターンの精度を継続的に測定し、重要な統計情報をチャート
The Trend Duration Forecast MT5 indicator is designed to estimate the probable lifespan of a bullish or bearish trend. Using a Hull Moving Average (HMA) to detect directional shifts, it tracks the duration of each historical trend and calculates an average to forecast how long the current trend is statistically likely to continue. This allows traders to visualize both real-time trend strength and potential exhaustion zones with exceptional clarity. KEY FEATURES Dynamic Trend Detection:   Utiliz
Promotion $66 lifetime for you. The principle of this indicator is very simple: detecting the trend with Moving Average, then monitoring the return point of graph by using the crossing of Stochastic Oscillator and finally predicting BUY and SELL signal with arrows, alerts and notifications. The parameters are fixed and automatically calculated on each time frame. Example: If you install indicator on EURUSD, timeframe M5: the indicator will detect the main trend with the Moving Average on this ti
Noize Absorption Index - is the manual trading system that measures the difference of pressure between bears forces and bulls forces. Green line - is a noize free index that showing curent situation. Zero value of index shows totally choppy/flat market.Values above zero level shows how powerfull bullish wave is and values below zero measures bearish forces.Up arrow appears on bearish market when it's ready to reverse, dn arrow appears on weak bullish market, as a result of reverse expectation.
This is an advanced multi-timeframe version of the popular Hull Moving Average (HMA) Features Two lines of the Hull indicator of different timeframes on the same chart. The HMA line of the higher timeframe defines the trend, and the HMA line of the current timeframe defines the short-term price movements. A graphical panel with HMA indicator data from all timeframes at the same time . If the HMA switched its direction on any timeframe, the panel displays a question or exclamation mark with a tex
タイトル: BOS MASTER MT5 説明: BOS MASTERは、 スマートマネーコンセプト (SMC) に基づいたプロフェッショナルな分析ツールです。このインジケーターは、 構造のブレイク (BOS) を自動的に検出し、市場の方向性の変化やトレンドの転換を高精度に特定するのに役立ちます。 主な機能: 自動BOS検出: チャート内の主要な高値と安値をスキャンし、構造がブレイクした正確な瞬間を強調表示します。 インタラクティブ・フィルターボタン: 「実体でのブレイク(保守的)」と「ヒゲでのブレイク(積極的)」モードをチャート上で直接切り替え可能です。 視覚的なレベル表示: ブレイクされた構造はスタイリッシュな点線でマークされます(強気は青、弱気はオレンジレッド)。 シグナル矢印: 現在の足で構造のブレイクが確定すると、チャート上に明確な矢印を表示します。 即時アラート: 内蔵のサウンド通知機能により、チャンスを逃しません。
WaveTrend Oscillator MT5は、モメンタムの変化や潜在的なトレンドの反転を特定することで、市場分析を強化するために設計された強力なトレーディングインジケーターです。すべてのレベルのトレーダーに最適で、このツールはforex、暗号通貨、商品など、さまざまな市場における買われすぎや売られすぎの状況に関する貴重な洞察を提供します。 正確な売買シグナルを生成する能力を持つWaveTrend Oscillator MT5は、トレーダーが情報に基づいた意思決定を行うことを可能にし、短期および長期のトレーディング戦略の成功の可能性を効果的に高めます。 MQL製品のインストールガイド | MT4/MT5で購入したMQL製品の更新 | 一般的なトラブルシューティングガイド | インジケーター設定 / ガイド 主な機能 バッファ統合: インジケーターの値をアクセス可能なバッファとして公開し、Expert Advisorがシグナルベースのトレーディング戦略を利用できるようにします。 迅速かつバックテスト可能: MetaTraderのネイティブOnCalculate()エンジンに基づいて構
Divergent Stochastic Filter II Catch Reversals Early, Filter Noise, Trade with Confidence The Edge: Why This Stochastic is Different  Every trader knows the Stochastic oscillator. But knowing when to trust its signals, that's the real challenge. The Divergent Stochastic Filter II transforms this classic indicator into a precision reversal detection system by adding critical elements: divergence intelligence, signal filtering and exhaustion detection.  While standard Stochastic oscillators fire s
The indicator highlights the points that a professional trader sees in ordinary indicators. VisualVol visually displays different volatility indicators on a single scale and a common align. Highlights the excess of volume indicators in color. At the same time, Tick and Real Volume, Actual range, ATR, candle size and return (open-close difference) can be displayed. Thanks to VisualVol, you will see the market periods and the right time for different trading operations. The indicator displays: T
Cumulative delta indicator As most traders believe, the price moves under the pressure of market buying or selling. When someone redeems an offer standing in the cup, the deal is a "buy". If someone pours into the bid standing in the cup - the deal goes with the direction of "sale". The delta is the difference between purchases and sales. A cumulative delta - the difference between the cumulative sum of purchases and sales for a certain period of time. It allows you to see who is currently contr
このプロダクトを購入した人は以下も購入しています
SuperScalp Pro
Van Minh Nguyen
4.53 (19)
SuperScalp Pro — 高度なマルチフィルター対応スキャルピングインジケーターシステム SuperScalp Pro は、クラシックな Supertrend と複数のインテリジェントな確認フィルターを組み合わせた高度なスキャルピング用インジケーターシステムです。M1〜H4 のすべての時間足で効率的に機能し、特に XAUUSD、BTCUSD、および主要なFX通貨ペアに適しています。単体のシステムとして、また既存の取引戦略へ柔軟に統合して使用できます。 本インジケーターは 11 以上のフィルターを統合しており、短期・長期の EMA、トレンド判定に用いる 3 本の EMA、EMA スロープ(EMA slope)、RSI、ADX、出来高、VWAP、ボリンジャーバンドのブレイクアウト、MACD ダイバージェンスフィルターなどを含みます。スマートキャンドルフィルターはローソク足の終値を確認して弱いシグナルを排除し、3 本の EMA と MACD ダイバージェンスを組み合わせたトレンド認識メカニズムにより勝率の高いシグナルの選別を支援します。 SuperScalp Pro は ATR に基
Entry In The Zone and SMC Multi Timeframe is a real-time 2-in-1 market analysis tool that combines market structure analysis and a No Repaint BUY / SELL signal system into a single indicator, built on Smart Money Concepts (SMC) — a widely adopted framework used by professional traders to understand market structure. This indicator helps you see the market more clearly, make decisions based on structure rather than guesswork, and focus on high-probability zones where price is more likely to react
Azimuth Pro
Ottaviano De Cicco
5 (6)
Azimuth Pro V2:MT5向けシンセティック・フラクタル構造分析と確認済みエントリー 概要 Azimuth Pro は Merkava Labs によるマルチレベルスイング構造インジケーターです。4つのネストされたスイングレイヤー、スイングアンカーVWAP、ABCパターン検出、3タイムフレーム構造フィルタリング、そして確定バーでの確認済みエントリー — 1つのチャートで、ミクロスイングからマクロサイクルまでを網羅するワークフロー。 これはブラインドシグナル製品ではありません。ロケーション、コンテキスト、タイミングを重視するトレーダーのための構造ファーストワークフローです。 V2発売記念オファー — Azimuth Pro V2をUSD 399で(次の100本)。最終価格:USD 499。 1. V2での変更点 シンセティック・マルチタイムフレームエンジン 上位タイムフレーム分析をMeridian Proと同じ独自のシンセティックアーキテクチャで一から再構築。よりクリーンなHTFコンテキスト、安定したライブ動作、従来のMTF同期問題なし。シンセティックエンジンは 固定比率タ
このインジケーターを購入された方には、以下の特典を 無料 で提供しています: 各トレードを自動で管理し、ストップロスとテイクプロフィットを設定し、戦略ルールに基づいてポジションを決済する補助ツール 「Bomber Utility」 様々な銘柄に合わせたインジケーターの設定ファイル(セットファイル) 「最小リスク」、「バランスリスク」、「待機戦略」 の3つのモードで使用できる Bomber Utility 用の設定ファイル このトレーディング戦略をすぐに導入・設定・開始できる ステップバイステップのビデオマニュアル ご注意: 上記の特典を受け取るには、MQL5のプライベートメッセージシステムを通じて販売者にご連絡ください。 オリジナルのカスタムインジケーター 「Divergence Bomber(ダイバージェンス・ボンバー)」 をご紹介します。これは、MACDのダイバージェンス(乖離)戦略に基づいた 「オールインワン」型のトレーディングシステム です。 このテクニカルインジケーターの主な目的は、価格とMACDインジケーターの間に発生するダイバージェンスを検出 し、将来の価格の動きを示す
Power Candles – あらゆる市場に対応した強度ベースのエントリーシグナル Power Candles は、Stein Investments が長年培ってきた強度分析を価格チャート上に直接反映します。価格だけに反応するのではなく、各ローソク足は実際の市場の強さに基づいて色分けされ、モメンタムの蓄積、強度の加速、明確なトレンド転換を瞬時に把握できます。 すべての市場に共通する単一ロジック Power Candles は すべての取引シンボル で自動的に動作します。現在のシンボルが Forex か非 Forex 市場かを自動判別し、内部で適切な強度モデルを適用します。 Forex および Gold :FX Power のデルタ値を使用(絶対値レンジ最大 100) 指数、暗号資産、CFD :IX Power の強度値を使用(絶対値レンジ最大 50) 必要な強度計算は Power Candles に直接組み込まれています。ローソク足のカラーリングやシグナルロジックに、追加のインジケーターは不要です。 価格ノイズではなく「強度状態」 各ローソク足は、以下の 9 つの明確に定義された強
OmniSync Projection
Antonio-alin Teculescu
5 (1)
Chronos Fractal Engine is an innovative price projection indicator for MetaTrader 5, designed to transform your technical analysis by intelligently identifying and projecting historical price patterns. Built upon an advanced correlation algorithm and the fractal principles of the market, this powerful tool visualizes potential future price movements, giving you a unique edge in your trading decisions. What is Chronos Fractal Engine? At its core, the Chronos Fractal Engine employs a sophisticat
このインジケーターを購入すると、プロ仕様のトレードマネージャーを無料で差し上げます。 まず第一に、このトレーディングシステムがノンリペイント、ノンリドロー、ノンラグのインジケーターであることを強調する価値がある。これにより、手動取引とロボット取引の両方に理想的なものになっています。 オンラインコース、マニュアル、プリセットのダウンロード。 「スマートトレンドトレーディングシステム MT5」は、新規および経験豊富なトレーダー向けにカスタマイズされた包括的なトレーディングソリューションです。10以上のプレミアムインジケーターを組み合わせ、7つ以上の堅実なトレーディング戦略を備えており、多様な市場状況に対応する多目的な選択肢となっています。 トレンドフォロー戦略:トレンドを効果的に乗り越えるための正確なエントリーとストップロス管理を提供します。 リバーサル戦略:潜在的なトレンドの反転を特定し、トレーダーがレンジ相場を活用できるようにします。 スキャルピング戦略:高速で正確なデイトレードおよび短期取引のために設計されています。 安定性:すべてのインジケーターはノンリペイント、ノンリドロー、ノ
トレンド スクリーナー インジケーターでトレンド取引の力を解き放ちます。ファジー ロジックと複数通貨システムを活用した究極のトレンド取引ソリューションです。 ファジー ロジックを活用した革新的なトレンド インジケーターである Trend Screener を使用して、トレンド取引を向上させます。 これは、13 を超えるプレミアム ツールと機能、および 3 つの取引戦略を組み合わせた強力なトレンド追跡インジケーターであり、Metatrader をトレンド アナライザーにする多用途の選択肢となります。 期間限定オファー : トレンド スクリーナー インジケーターは、わずか 100 ドルで生涯ご利用いただけます。 (元の価格 50$ ) (オファー延長) Trend Screener の 100% 非再描画精度の揺るぎない精度を体験して、取引の決定が過去の価格変動の影響を受けないようにしてください。 マルチタイムフレームおよびマルチ通貨機能の多用途性を解放し、比類のない自信を持って外国為替、商品、暗号通貨、インデックスの世界を取引できるようにします。 Trend Screener の包括的な
Meridian Pro
Ottaviano De Cicco
5 (1)
Meridian Pro:MT5用プロフェッショナル・マルチタイムフレーム・トレンドマトリックス 概要 Meridian Pro は Merkava Labs が開発したマルチタイムフレーム・トレンドマトリックスで、方向性の状態、強度、モメンタムの状況、マトリックスの合意をひとつのコンパクトなパネルに集約します。ひとつのアダプティブエンジンがM1からW1まで一貫して適用されます。シンボルごとの調整は不要。インジケーターの積み重ねも不要。すべてのアセットとすべてのタイムフレームをカバーするひとつの構造化された読み取りです。 発売キャンペーン — Meridian Proを USD 99 (導入価格)で入手。通常価格:USD 149 。 1. Meridian Proが他と異なる理由 ひとつのエンジン、バラバラなインジケーターのダッシュボードではない 多くのMTFダッシュボードは、タイムフレームごとに生のインジケーター値を繰り返すだけです。Meridian Proはマトリックス全体でひとつのアダプティブ・トレンドエンジンを使用するため、パネルの各行が同じ構造化フレームワークから導出されます
Quantum TrendPulse を ご紹介します。これは、   SuperTrend   、   RSI   、および Stochastic のパワーを 1 つの包括的なインジケーターに組み合わせて、取引の可能性を最大限に引き出す究極の取引ツールです。精度と効率を求めるトレーダー向けに設計されたこのインジケーターは、市場のトレンド、勢いの変化、最適なエントリー ポイントとエグジット ポイントを自信を持って特定するのに役立ちます。 主な特徴: SuperTrend 統合: 現在の市場動向に簡単に追従し、収益性の波に乗ることができます。 RSI精度: 買われすぎと売られすぎのレベルを検出し、市場の反転のタイミングに最適で、SuperTrendのフィルターとして使用されます。 確率的精度: 確率的振動を活用して、変動の激しい市場で隠れたチャンスを見つけます。SuperTrend のフィルターとして使用されます。 マルチタイムフレーム分析:   M5 から H1 または H4 まで、さまざまなタイムフレームで市場を常に把握します。 カスタマイズ可能なアラート: カスタム取引条件が満たされ
Gann Made Easy   は、ミスター・ギャンの理論を使用した取引の最良の原則に基づいた、プロフェッショナルで使いやすい外国為替取引システムです。 W・D・ガン。このインジケーターは、ストップロスとテイクプロフィットレベルを含む正確な買いと売りのシグナルを提供します。 PUSH通知を利用して外出先でも取引可能です。 ご購入後、取引方法の説明と優れた追加インジケーターを無料で入手するには、私にご連絡ください! おそらく、ギャンの取引手法についてはすでに何度も聞いたことがあるでしょう。通常、ギャンの理論は初心者のトレーダーだけでなく、すでにある程度の取引経験がある人にとっても非常に複雑なものです。なぜなら、ギャンの取引手法は理論的にはそれほど簡単に適用できるものではないからです。私はその知識を磨き、最良の原則を私の外国為替インジケーターに組み込むために数年を費やしました。 このインジケーターは非常に簡単に適用できます。必要なのは、それをチャートに添付し、簡単な取引推奨事項に従うだけです。このインジケーターは常に市場分析の仕事を行い、取引の機会を探します。適切なエントリーポイントを検
BTMM State Engine Pro is a MetaTrader 5 indicator for traders who use the Beat The Market Maker approach: Asian session context, kill zone timing, level progression, peak formation detection, and a multi-pair scanner from a single chart. It combines cycle state logic with a built-in scanner dashboard so you do not need the same tool on many charts at once. What it does Draws the Asian session range; session times can follow broker server offset or be set in inputs. Tracks level progression (L
FX Trend NG:次世代マルチマーケット・トレンドインテリジェンス 概要 FX Trend NG は、複数の時間足に対応したプロフェッショナル向けトレンド分析およびマーケット監視ツールです。 市場全体の構造を数秒で把握することができます。 複数のチャートを切り替える必要はありません。どの銘柄がトレンド中なのか、どこでモメンタムが弱まっているのか、そしてどの時間足で強い整合性があるのかを瞬時に確認できます。 ローンチ特別オファー – FX Trend NG を $30(6ヶ月) または $80 永久ライセンス でご利用いただけます。 すでに Stein Investments のユーザーですか? -> メッセージを送信 して、プライベートグループへアクセスしてください。 セットアップや詳細情報が必要ですか? -> Stein Investments 公式ページ をご覧ください。 1. FX Trend NG が他と異なる理由 3ステート・トレンドロジック ― Buy と Sell だけではない • 多くのインジケーターは Buy または Sell の2状態のみを表示します。
ARICoin is a powerful trading companion designed to generate high-probability entry signals with dynamic TP/SL/DP levels based on volatility. Built-in performance tracking shows win/loss stats, PP1/PP2 hits, and success rates all updated live. Key Features: Buy/Sell signals with adaptive volatility bands Real-time TP/SL/DP levels based on ATR Built-in MA Filter with optional ATR/StdDev volatility Performance stats panel (Success, Profit/Loss, PP1/PP2) Alerts via popup, sound, push, or email Cust
Crystal Heikin Ashi Signals - Professional Trend & Signal Detection Indicator Advanced Heikin Ashi Visualization with Intelligent Signal System for Manual & Automated Trading Final Price: $149 ---------> Price goes up $10 after every 10 sales . Limited slots available — act fast . Overview Crystal Heikin Ashi Signals is a professional-grade MetaTrader 5 indicator that combines pure Heikin Ashi candle visualization with an advanced momentum-shift detection system. Designed for both manual traders
Trend Ai indicatorは、トレンドの識別と実用的なエントリポイントと反転アラートを組み合わせることで、トレーダーの市場分析を強化する優れたツールです。 この指標は、ユーザーが自信と正確さで外国為替市場の複雑さをナビゲートすることを可能にします トレンドAiインジケーターは、主要なシグナル以外にも、プルバックやリトレースメント中に発生するセカンダリエントリポイントを識別し、トレーダーが確立されたトレンド内の価格修正を活用できるようにします。 重要な利点: *MT4およびMT5の仕事 *明確な買いまたは売りシグナル *再描画しません ·すべての資産で動作します 私はeaやセットをtelegram it詐欺で販売しないように注意してください。 すべての設定はここでブログで無料です。  重要! 指示とボーナスを得るために購入後すぐに私に連絡してください! 私の他のプロダクトと同様、実質操作の監視はここに見つけることができます: https://www.mql5.com/en/users/mechanic/seller&nbsp ; 設定および入力: すべての
FX Power: 通貨の強弱を分析して、より賢い取引を実現 概要 FX Power は主要通貨と金の実際の強弱をあらゆる市場状況で理解するための必須ツールです。強い通貨を買い、弱い通貨を売ることで、 FX Power は取引の意思決定を簡素化し、高い確率の取引機会を見出します。トレンドを追従する場合でも、極端なデルタ値を使用して反転を予測する場合でも、このツールはあなたの取引スタイルに完全に適応します。ただ取引するだけではなく、 FX Power で賢く取引をしましょう。 1. なぜ FX Power がトレーダーにとって非常に有益なのか 通貨と金のリアルタイム強弱分析 • FX Power は主要通貨と金の相対的な強弱を計算し、マーケットダイナミクスに関する明確な洞察を提供します。 • どの資産がリードしているか、または後れを取っているかを監視して、取引するペアを賢く選びましょう。 マルチタイムフレームの包括的なビュー • 短期、中期、長期のタイムフレームで通貨と金の強弱を追跡し、マーケットトレンドに基づいて取引戦略を調整できます。 • スキャルピングからスイングトレード
あなたのシンボルでどの戦略が実際に機能するか確認しましょう - リアルマネーをリスクにさらす前に。 Power Barは、あらゆるシンボルとあらゆるタイムフレームで 極端な価格バー を検出し、3つの異なるトレード戦略を即座にバックテストします。勝率、プロフィットファクター、損益を並べて比較できます。すべてが1つのインタラクティブなパネルに集約されています。 推測なし。カーブフィッティングなし。データだけです。 Power Barが特別な理由 ほとんどのインジケーターはシグナルを出すだけで、それが機能するかどうかは推測に任されます。Power Barはさらに先を行きます - すべてのシグナルを 3つの戦略 に対してテストし、統計を表示します。FlipFlop、Momentum、Reversalをワンクリックで切り替え、数値が即座に変化するのを確認できます。 FlipFlop - 常にポジションを保有。シグナルでエントリーし、反対シグナルでイグジット。当社のリサーチでは、US30、US500、DAXなどのトレンドのあるインデックスで最も効果的です。 Momentum - シグナルの方向に
Auto Optimized Parabolic RSI: 高度な3Dモメンタムエンジン ほとんどのリテール向けインジケーターは、市場のボラティリティが変化した瞬間に破綻する静的な入力値に依存しているため、失敗に終わります。Auto Optimized Parabolic RSIは、自らの数学的優位性を継続的に再計算することで「インジケーターの陳腐化」問題を解決し、機関投資家レベルの定量的適応力をMT5ターミナルに直接もたらします。 最大の強み: カスタムインメモリ3D最適化 標準的な自動最適化ツールは、インジケーターの呼び出しで端末に過負荷をかけるため、頻繁にMT5プラットフォームをフリーズさせます。本ツールは、このボトルネックを完全に回避しています。RAMベースのカスタムネイティブ計算機を内蔵した内部エンジンは、チャートを読み込んだりタイムフレームを変更したりするたびに、超高速の3Dグリッド探索を実行します。RSI期間(頻度)、SARステップ(加速度)、SAR最大値(制限速度)を同時にスイープし、プラットフォームを遅延させることなく、数万通りものパラメーターの組み合わせを絶対的なミ
Bill Williams Advanced is designed for automatic chart analysis using Bill Williams' "Profitunity" system. The indicator analyzes four timeframes at once. Manual (Be sure to read before purchasing) Advantages 1. Analyzes the chart using Bill Williams' "Profitunity" system. Signals are displayed in a table in the corner of the screen and on the price chart. 2. Finds all known AO and AC signals, as well as zone signals. Equipped with a trend filter based on the Alligator. 3. Finds "Divergence Bar
まず第一に、この取引インジケーターは再描画されず、再描画されず、遅延しないことを強調する価値があります。これにより、手動取引とロボット取引の両方に理想的なものになります。 ユーザーマニュアル:設定、入力、戦略。 アトミックアナリストは、価格の強さとモメンタムを利用して市場でより良いエッジを見つけるためのPA価格アクションインジケーターです。ノイズや誤ったシグナルを除去し、取引ポテンシャルを高めるための高度なフィルターを備えています。複雑なインジケーターの複数のレイヤーを使用して、アトミックアナリストはチャートをスキャンし、複雑な数学的計算をシンプルなシグナルと色に変換します。これにより、どのような初心者トレーダーでも理解して使用し、一貫した取引の決定を行うことができます。 「アトミックアナリスト」は、新規および経験豊富なトレーダー向けにカスタマイズされた包括的な取引ソリューションです。プレミアムインジケーターとトップノッチの機能を1つの取引戦略に組み合わせ、すべてのタイプのトレーダーにとって汎用性のある選択肢にします。 デイリートレーディングとスキャルピング戦略:高速で正確なデイ
Smart Stop Indicator – チャート上で実現するインテリジェントなストップロス精度 概要 Smart Stop Indicator は、ストップロスを勘や感情ではなく、明確で体系的に設定したいトレーダーのために設計されています。本ツールは、クラシックなプライスアクション(高値更新・安値切り下げ)と最新のブレイクアウト認識ロジックを組み合わせ、次に来るべき論理的なストップレベルを正確に特定します。トレンド相場、レンジ、急速なブレイクアウト局面のいずれであっても、最適な SL ゾーンとその状態(“new”、“broken”、“valid”)をチャート上に直接表示します。さらに今回、SL 距離の %ADR 表示も新たに追加されています。 主な特徴 マーケット構造に基づく自動ストップ配置 • 市場構造とリアルタイムの値動きに基づき、意味のあるストップロスレベルを自動検出します。 スマートなブレイクアウト感知 • 急激な方向転換やブレイクアウトにも柔軟に対応し、早すぎるストップ調整を避けます。 SL %ADR の表示 • ストップロスまでの距離を ADR(Averag
RelicusRoad Pro: 定量的市場オペレーティングシステム 【期間限定】無制限アクセス 70% OFF - 2,000人超のトレーダーと共に なぜ多くのトレーダーは「完璧な」インジケーターを使っても失敗するのでしょうか? それは、文脈を無視して 単一の概念 だけでトレードしているからです。文脈のないシグナルは単なるギャンブルです。勝ち続けるには、 根拠の重なり(コンフルエンス) が必要です。 RelicusRoad Proは単なる矢印インジケーターではありません。完全な 定量的市場エコシステム です。独自のボラティリティモデリングを用いて、価格が推移する「適正価値の道(Fair Value Road)」をマッピングし、ノイズと真の構造的ブレイクを判別します。 推測はやめましょう。機関投資家レベルの「ロード・ロジック」でトレードを。 コアエンジン:「Road」アルゴリズム システムの中心となる Road Algo は、市場環境にリアルタイムで適応するダイナミックなボラティリティチャネルです。 安全ライン(平衡点) と、価格が数学的に反転しやすい 拡張レベル を投影します。 Si
Berma Bands
Muhammad Elbermawi
5 (8)
Berma Bands (BBs) インジケーターは、市場のトレンドを特定して活用したいトレーダーにとって貴重なツールです。価格と BBs の関係を分析することで、トレーダーは市場がトレンド段階にあるか、レンジ段階にあるかを判断できます。 詳細については、[ Berma Home Blog ] をご覧ください。 バーマ バンドは、上部バーマ バンド、中部バーマ バンド、下部バーマ バンドの 3 つの異なる線で構成されています。これらの線は価格の周りにプロットされ、全体的な傾向に対する価格の動きを視覚的に表します。これらのバンド間の距離から、ボラティリティや潜在的な傾向の反転についての洞察を得ることができます。 バーマ バンドの線がそれぞれ離れると、市場が横ばいまたはレンジ相場の期間に入っていることを示すことがよくあります。これは、明確な方向性の偏りがないことを示しています。トレーダーは、これらの期間中にトレンドを特定するのが難しいと感じる可能性があり、より明確なトレンドが出現するまで待つ場合があります。 バーマ バンドの線が 1 本の線に収束すると、強いトレンド環境の兆候となること
ARIPoint is a powerful trading companion designed to generate high-probability entry signals with dynamic TP/SL/DP levels based on volatility. Built-in performance tracking shows win/loss stats, PP1/PP2 hits, and success rates all updated live. Key Features: Buy/Sell signals with adaptive volatility bands Real-time TP/SL/DP levels based on ATR Built-in MA Filter with optional ATR/StdDev volatility Performance stats panel (Success, Profit/Loss, PP1/PP2) Alerts via popup, sound, push, or email Cu
現在33%オフ 初心者にもエキスパートトレーダーにも最適なソリューション このインジケーターは独自の機能と新しい公式を多数内蔵しており、ユニークで高品質かつ手頃な取引ツールです。このアップデートでは、2つの時間枠ゾーンを表示できるようになります。より長いTFだけでなく、チャートTFとより長いTF(ネストゾーンを表示)の両方を表示できます。すべてのSupply Demandトレーダーの皆さんのお気に召すはずです。:) 重要情報の公開 Advanced Supply Demandの可能性を最大化するには、 https://www.mql5.com/ja/blogs/post/720245 にアクセスしてください。   エントリーまたはターゲットの正確なトリガーポイントを正確に特定できれば取引がどのように改善されるか想像してみてください。新しい基盤となるアルゴリズムに基づいて構築されているため、買い手と売り手の間の潜在的な不均衡をさらに簡単に特定できます。これは、最も強い需要と供給のゾーンと、過去のパフォーマンス(古いゾーンを表示)がグラフィカルに表現されるためです。これらの機能は、最適な
ICT PO3 (Power of 3) AMD Protocol Framework Indicator True Time & Structure Integration   |  Non-Repainting | Real-Time  | Multi-Asset  | MT4 Version Available Full Setup Guide & Strategy Playbook: https://www.mql5.com/en/blogs/post/768683 MT4 Version: https://www.mql5.com/en/market/product/171742 Indicator Overview The ICT PO3 AMD Protocol Framework is a complete structural overlay for MetaTrader 5 that maps the True Daily Cycle directly onto your lower-timeframe execution chart. It projects
トレンドトレーディング は、タイミングのプルバックとブレイクアウトにより、市場で起こっているトレンドから可能な限り利益を得るように設計された指標です。確立されたトレンドの中で価格が何をしているかを分析することにより、取引の機会を見つけます。 [ インストールガイド | 更新ガイド | トラブルシューティング | よくある質問 | すべての製品 ] 自信を持って効率的に金融市場を取引する むち打ちにならずに確立されたトレンドから利益を得る 収益性の高いプルバック、ブレイクアウト、早期の逆転を認識する この指標は、独自の品質とパフォーマンスを分析します 複数時間枠のダッシュボードを実装します インジケーターは再描画されていません 電子メール/音声/視覚アラートを実装します 確立されたトレンドは多くの取引機会を提供しますが、ほとんどのトレンド指標はそれらを完全に無視しています。インジケーターの解釈はかなり簡単です: (1) トレンドの変化 (2) トレンドの方向への後退 (3) トレンドの方向へのブレイクアウト 赤いダッシュ は下降トレンド中の修正です 青いダッシュ は上昇トレンド中
サポート線と抵抗線のプロットにうんざりしていませんか? サポートレジスタンス は、非常に興味深いひねりを加えてチャート内のサポートとレジスタンスラインを自動検出およびプロットするマルチタイムフレームインジケーターです。価格レベルは時間とともにテストされ、その重要性が高まるにつれて、ラインは太くなり、暗くなります。 [ インストールガイド | 更新ガイド | トラブルシューティング | よくある質問 | すべての製品 ] 一晩でテクニカル分析を強化 チャートを閲覧せずに重要な価格レベルを検出 一目ですべての価格レベルの相対的な強さを認識する すべての取引で最大30時間のプロットラインを節約 インジケーターは、すべての価格レベルの年齢を表示します インジケーターは再描画されていません 過去および現在の価格レベルは近接によって崩壊し、現在の市場行動に合わせて調整されます。動作は、必ずしもピークではない場所に線が引かれます。 価格レベルは、時間とともに拒否されるにつれて、より暗く、より広くなります ノイズを避けるために、重要でない価格レベルは定期的にクリアされます カスタマイズ可能な時間枠の
このインジケーターは、反転ポイントと価格戻りゾーンを正確に表示します。     主要プレーヤー 。新たなトレンドが形成される場所を把握し、最大限の精度で意思決定を行い、すべての取引をコントロールします。 TREND LINES PRO インジケーターと組み合わせることで、その潜在能力を最大限に発揮します。 VERSION MT4 インジケーターが示す内容: 新しいトレンドの始まりに活性化する反転構造と反転レベル。 リスクと報酬の比率を最小限に抑えた利益 確定 と 損失停止の レベルの表示     RR 1:2   。 インテリジェントな削減ロジックによるストップロス。 指定されたインジケーターから 2 つのトレンド タイプの反転パターンを表示します。 指標: トレンドを追う   TREND LINES PRO   (世界的なトレンドの変化) TREND PRO   (クイックトレンド変更) シンプルで効果的   スキャナー   リアルタイムトレンド(新機能)。 マルチタイムフレームのインストゥルメント フィルタリング。 画面   利益     LOGIC AI信号の後。 当日プラス方
作者のその他のプロダクト
BTMM State Engine Pro is a MetaTrader 5 indicator for traders who use the Beat The Market Maker approach: Asian session context, kill zone timing, level progression, peak formation detection, and a multi-pair scanner from a single chart. It combines cycle state logic with a built-in scanner dashboard so you do not need the same tool on many charts at once. What it does Draws the Asian session range; session times can follow broker server offset or be set in inputs. Tracks level progression (L
Connix MT5
Garry James Goodchild
5 (1)
Connix Dashboard — Multi-currency market structure scanner Connix Dashboard is a chart indicator for MetaTrader 5. It shows a table of symbols and timeframes with market structure, order blocks, fair value gaps, VWAP position, and range information in one panel. What it shows The table can monitor up to 28 symbols on the timeframes you choose. For each symbol and timeframe, the indicator evaluates and displays: Structure events (break of structure and change of character) Order block state (for
BTMM State Engine Pro is a MetaTrader 4 indicator for traders who use the Beat The Market Maker approach: Asian session context, kill zone timing, level progression, peak formation detection, and a multi-pair scanner from a single chart. It combines cycle state logic with a built-in scanner dashboard so you do not need the same tool on many charts at once. What it does Draws the Asian session range; session times can follow broker server offset or be set in inputs. Tracks level progression (L
G-Labs Advanced Market Maker Dashboard for MetaTrader 4   is a multi-symbol chart indicator that shows a full BTMM-style workflow: average daily range expansion, price formation, intraday structure, breaker blocks, momentum, divergence, and stop-hunt context across many pairs from one chart. It is designed for traders who use Beat The Market Maker (BTMM) ideas: market structure, cycle stage, and liquidity behaviour, with a single dashboard instead of flipping charts. Brief overview The indicato
Smart Market Structure Pro is a complete Smart Money Concepts and ICT indicator that maps institutional order flow on any chart, any timeframe, for MetaTrader 5 and MetaTrader 4. Please see the comments section for the full user guide  Attach it to a chart and the indicator draws Break of Structure (BOS), Change of Character (CHoCH), Order Blocks, Fair Value Gaps, Liquidity Sweeps, Premium/Discount zones, ICT session windows, and a real-time Confluence Score from 0 to 10 — all controlled from a
G-Labs Trade Manager is a professional on-chart trading panel for MetaTrader 4. It helps you plan trades, size positions from risk, manage open trades, and stay informed — while you stay in control of every decision. It is a trading utility, not a black-box signal or automated strategy. WHO IT IS FOR • Traders who want one place to set stop loss, take profit, and risk before clicking buy or sell. • Anyone who trades manually or semi-manually and wants faster execution and clearer risk. • Users w
MagicLines MT5 — Multi-Currency Cycle and Trend Dashboard MagicLines is a multi-currency indicator and dashboard for MetaTrader 5. It combines Heikin-Ashi cycle detection, two dynamic trend lines, and a multi-pair scanner into one chart tool. It generates signal suggestions with entry, stop loss, and take profit levels across multiple pairs from a single chart. How It Works MagicLines uses three analysis layers together: Heikin-Ashi Cycle Logic identifies whether each pair is in an up or down c
G-Labs Market Maker Dashboard — BTMM multi-pair scanner (Peak Formation, ADR cycle, Asian range, stop hunt, RSI) Stop guessing which pairs are “in cycle.” This dashboard scans your watchlist in real time and shows where each symbol sits in a Banks Track Market Maker (BTMM) style workflow: Peak Formation context (PFH / PFL), expansion measured in ADR multiples, Asian session range behaviour, stop-hunt proximity signals, today’s range versus ADR, and M15 RSI for timing. One panel replaces a wall o
G-Ca$H IC Breaker Automatic source and breaker order block indicator for MetaTrader 4 and MetaTrader 5. (This version is mt4) For user guide please see the comments section. Overview Detects and draws two key zones from price structure across multiple timeframes: the Source order block where a directional move originates, and the Breaker order block where price confirms that structure has been invalidated. Works on any symbol — forex, metals, indices, crypto, or commodities. What you see on the
Smart Market Structure Pro is a complete Smart Money Concepts and ICT indicator that maps institutional order flow on any chart, any timeframe, for MetaTrader 5 and MetaTrader 4. Please see the comments section for the full user guide  Attach it to a chart and the indicator draws Break of Structure (BOS), Change of Character (CHoCH), Order Blocks, Fair Value Gaps, Liquidity Sweeps, Premium/Discount zones, ICT session windows, and a real-time Confluence Score from 0 to 10 — all controlled from an
G-Labs Market Maker Dashboard — BTMM multi-pair scanner (Peak Formation, ADR cycle, Asian range, stop hunt, RSI) Stop guessing which pairs are “in cycle.” This dashboard scans your watchlist in real time and shows where each symbol sits in a Banks Track Market Maker (BTMM) style workflow: Peak Formation context (PFH / PFL), expansion measured in ADR multiples, Asian session range behaviour, stop-hunt proximity signals, today’s range versus ADR, and M15 RSI for timing. One panel replaces a wall o
G-Ca$H IC Breaker Automatic source and breaker order block indicator for MetaTrader 4 and MetaTrader 5. (This version is mt5) For user guide please see the comments section. Overview Detects and draws two key zones from price structure across multiple timeframes: the Source order block where a directional move originates, and the Breaker order block where price confirms that structure has been invalidated. Works on any symbol — forex, metals, indices, crypto, or commodities. What you see on the
G-Labs Trade Manager is a professional on-chart trading panel for MetaTrader 5. It helps you plan trades, size positions from risk, manage open trades, and stay informed — while you stay in control of every decision. It is a trading utility, not a black-box signal or automated strategy. WHO IT IS FOR • Traders who want one place to set stop loss, take profit, and risk before clicking buy or sell. • Anyone who trades manually or semi-manually and wants faster execution and clearer risk. • Users w
フィルタ:
Levent Safak
1353
Levent Safak 2026.02.21 22:47 
 

ユーザーは評価に対して何もコメントを残しませんでした

Garry James Goodchild
3727
開発者からの返信 Garry James Goodchild 2026.02.22 13:08
Thank you so much :)
レビューに返信