
トリコロールインディケータとインディケータを書くことを最大限シンプル化するいくつかの機会
はじめに
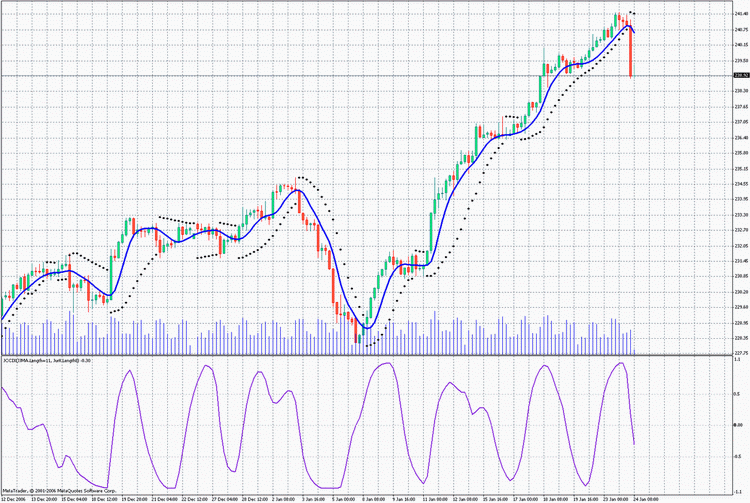
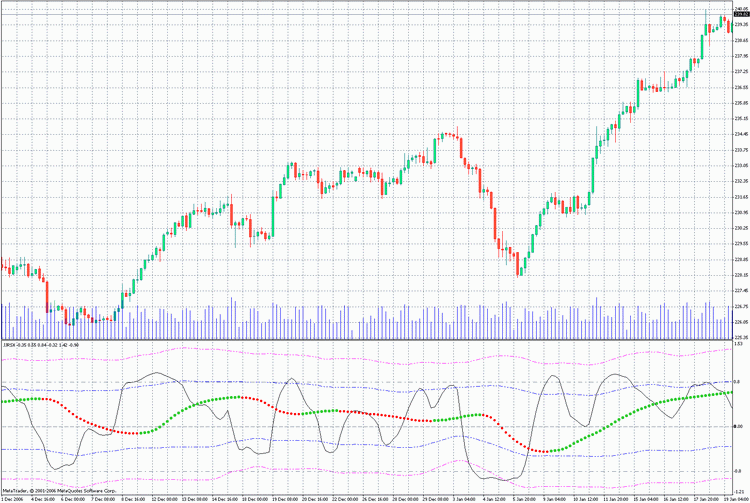
多くの場合、最大の情報源は色として残ります。その変化は市場特性における現在の変化を鮮やかに速やかに伝えます、. トリコロールトレンドインディケータがモノクロームのインディケータよりも有益で効率的に見えることがよくあるのはそのあめです。2通りのバリアントで表現されている例をちょっと見ましょう。
トレンド方向の白黒インディケータの通常バージョン
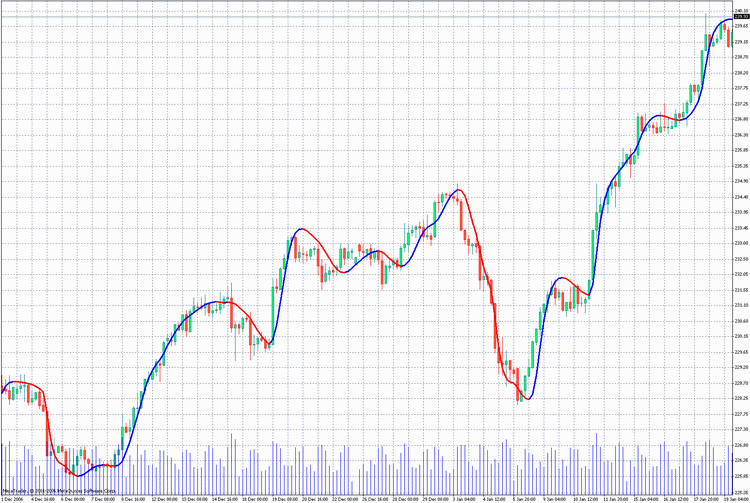
そしてインディケータがトレンド方向によって分けて色付けされたバージョン
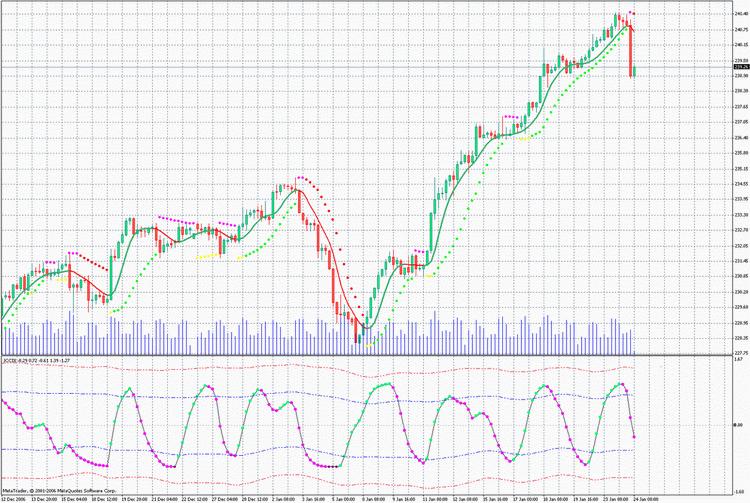
2番目のチャートで作業するほうが簡単で一目瞭然なことがお判りでしょう。MQL4 でそのようなインディケータを作成することには何の問題もありません。リソース消費を大幅に増やすこともありません。トレーディングにおいてこのチャンスを生かさないことは、市況を常に観測するという厳しい作業をシンプル化するチャンスを逃すことを意味するのです。
そのようなインディケータの作成を学習しましょう。
トリコロールインディケータ 3c_JJRSX1
まず、オシレータ JJRSX を基にしたトリコロール線形ダイアグラムを作成します
iCustom(NULL,0,"JJRSX",Length,Smooth,Smooth_Phase,
        Input_Price_Customs,0,bar).
トリコロールの類似体を書くこと、color:: を用いたトレンド変化に関するシグナリング、には何の問題もないはずです。
/*
For the operation of the indicator place the files
JJMASeries.mqh
JurXSeries.mqh
PriceSeries.mqh
into the folder (directory): MetaTrader\experts\include\
Heiken Ashi#.mq4
into the folder (directory): MetaTrader\indicators\
*/
//+------------------------------------------------------------------+
//|                                                    3c_JJRSX1.mq4 |
//|                           Copyright c 2006,     Nikolay Kositsin |
//|                              Khabarovsk,   farria@mail.redcom.ru |
//+------------------------------------------------------------------+
#property copyright "Copyright c 2006, Nikolay Kositsin"
#property link      "farria@mail.redcom.ru"
//---- drawing the indicator in a separate window
#property indicator_separate_window
//---- number of the indicator buffers
#property indicator_buffers  3
//---- colors of the indicator
#property indicator_color1  BlueViolet
#property indicator_color2  Magenta
#property indicator_color3  Gray
//---- width of the indicator lines
#property indicator_width1 3
#property indicator_width2 3
#property indicator_width3 3
//---- parameters of the horizontal levels of the indicator
#property indicator_level1  0.5
#property indicator_level2 -0.5
#property indicator_level3  0.0
#property indicator_levelcolor MediumBlue
#property indicator_levelstyle 4
//---- INPUT PARAMETERS OF THE INDICATOR
extern int        Length = 8;  // depth of the indicator smoothing
extern int        Smooth = 3; // depth of the additional JMA smoothing
// changing within the limits -100 ... +100,
// influences the quality of the transient process;
extern int  Smooth_Phase = 100;
/* Selecting prices, based on which the indicator will be calculated
(0-CLOSE, 1-OPEN, 2-HIGH, 3-LOW, 4-MEDIAN, 5-TYPICAL, 6-WEIGHTED,
7-Heiken Ashi Close, 8-SIMPL, 9-TRENDFOLLOW, 10-0.5*TRENDFOLLOW,
11-Heiken Ashi Low, 12-Heiken Ashi High, 13-Heiken Ashi Open,
14-Heiken Ashi Close.) */
extern int Input_Price_Customs = 0;
//---- indicator buffers
double Ind_Buffer1[];
double Ind_Buffer2[];
double Ind_Buffer3[];
//+------------------------------------------------------------------+
//| JJRSX initialization function                                    |
//+------------------------------------------------------------------+
int init()
  {
// styles of drawing the indicator
   SetIndexStyle(0,DRAW_HISTOGRAM, STYLE_SOLID);
   SetIndexStyle(1,DRAW_HISTOGRAM, STYLE_SOLID);
   SetIndexStyle(2,DRAW_HISTOGRAM, STYLE_SOLID);
// 4 indicator buffers are used for calculation
   SetIndexBuffer(0,Ind_Buffer1);
   SetIndexBuffer(1,Ind_Buffer2);
   SetIndexBuffer(2,Ind_Buffer3);
// setting the indicator values, which will be invisible on the chart
   SetIndexEmptyValue(0,0);
   SetIndexEmptyValue(1,0);
   SetIndexEmptyValue(2,0);
// names for window data and labels for subwindows
   SetIndexLabel(0,"Up_Trend");
   SetIndexLabel(1,"Down_Trend");
   SetIndexLabel(2,"Straight_Trend");
   IndicatorShortName("JJRSX(Length="+Length+")");
// Setting the format of accuracy (number of signs after a decimal point)
//for the visualisation of the indicator values
   IndicatorDigits(0);
// correction of the invalid value of the parameter Length
  if(Length<1)Length=1;
// setting the bar number, starting from which the indicator will be drawn
   int draw_begin=3*Length+30+1;
   SetIndexDrawBegin(0,draw_begin);
   SetIndexDrawBegin(1,draw_begin);
   SetIndexDrawBegin(2,draw_begin);
//---- end of the initialization
return(0);
  }
//+------------------------------------------------------------------+
//| JJRSX iteration function                                         |
//+------------------------------------------------------------------+
int start()
  {
// Declaration of the integer statistic variables
   static int time2;
// Declaration of the decimal static variables
   static double ValueM;
// Declaration of the decimal variables
    double Value0,Value1,trend;
// Declaration of the integer variables and retrievement of the calculated bars
    int bar,limit,MaxBar,Tnew,counted_bars=IndicatorCounted();
// check for errors
    if (counted_bars<0)return(-1);
// the last calculated bar should be recalculated
    if (counted_bars>0) counted_bars--;
// defining the number of the oldest bar,
// starting from which all bars will be recalculated
    MaxBar=Bars-3*Length-30;
    //---- defining the number of the oldest bar,
    //starting from which all new bars will be recalculated
    limit=Bars-counted_bars-1;
    //+--- zero initialization
    if (limit>=MaxBar)
      for(bar=Bars-1;bar>=MaxBar;bar--)
       {
        limit=MaxBar;
        Ind_Buffer1[bar]=0.0;
        Ind_Buffer2[bar]=0.0;
        Ind_Buffer3[bar]=0.0;
       }
//+--- retrieving the variable values
    Tnew=Time[limit+1];
    if (limit<MaxBar)
    if (Tnew==time2)
     {
      Value1=ValueM;
     }
    else
     {
      if (Tnew>time2)
           Print("Error in retrieving variables!!! Tnew>time2");
      else Print("Error in retrieving variables!!! Tnew");
      Print("Indicators will be recounted on all bars!!");
      return(-1);
     }
//----+ THE MAIN CYCLE OF CALCULATING INDICATORS
    while (bar>=0)
      {
       //+--- Saving the variables values +====+
     if (bar==1)
      {
       if(((limit==1)&&(time2==Time[2]))||(limit>1))
         {
          ValueM=Value1;
          time2=Time[bar];
         }
      }
     //+---+====================================+
        Value0=iCustom(NULL,0,"JJRSX",Length,Smooth,Smooth_Phase,
                       Input_Price_Customs,0,bar);
        if (bar==MaxBar)
          {
           Value1=Value0;
           continue;
          }
        //---- Tricolor indicator code
        trend=Value0-Value1;
        if(trend>0)
          {
            Ind_Buffer1[bar]=Value0;
            Ind_Buffer2[bar]=0;
            Ind_Buffer3[bar]=0;
          }
        else
          {
            if(trend<0)
              {
                Ind_Buffer1[bar]=0;
                Ind_Buffer2[bar]=Value0;
                Ind_Buffer3[bar]=0;
              }
            else
              {
                Ind_Buffer1[bar]=0;
                Ind_Buffer2[bar]=0;
                Ind_Buffer3[bar]=Value0;
              }
          }
        //----
        Value1=Value0;
        //----+
        bar--;
     }
    //---- end of the calculation of the indicator values
    return(0);
  }
//+--------------------------------------------------------------+
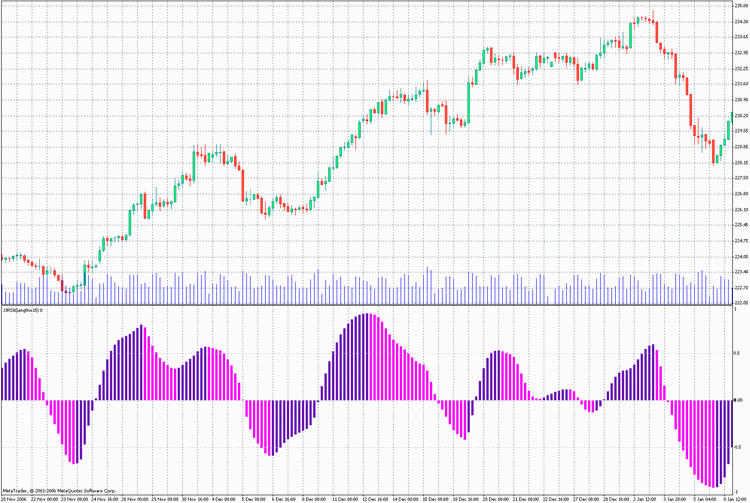
インディケータにはインディケータバッファが3つ使用されており、1番目のバーのソースインディケータ JJRSX の値に対しては変数 Value1 iが使用されます。ティック間で変数 Value1 の値を失わないために、静的変数 ValueM に保存します。インディケータのアルゴリズムはインディケータの現在値と前回バーの値を比較し、この値を必要なインディケータバッファに入れます。類似体インディケータを別のカスタムインディケータに基づいて作成するためには、カスタムインディケータに対する参照行でカスタムインディケータ名を変更するだけです。
Value0=iCustom(NULL,0,"JJRSX",Length,Smooth,Smooth_Phase,
               Input_Price_Customs,0,bar);
以下の行で、
MaxBar = Bars - 3*Length - 30;
計算式を変更し、次に述べる行内の計算式も変更します。
int draw_begin = 3*Length + 30 + 1;
これは初期化ブロックの行です。またもちろん外部変数も必要なものに変更します。ボリンジャーバンドやインディケータ形式を線形から点グラフに変えるオプションを追加することでチャートをより有益なものとすることが可能です。また、このインディケータをテンプレートとして使用することで、他のトリコロールチャートでは変更せず、プログラムコード内で変更するのに必要な行を検索するのがやや不便になります。このプログラムを mqh ファイルに入れ、演算子 #include によってインディケータ内で使用するのが合理的でしょう。それをやってみます。この場合、インディケータコードは過剰なエレメントなしでシンプルな形式を取得します。それは他のオシレータダイアグラムを書くためのテンプレートとして簡単に使用されます。
/*
For the operation of the indicator place files
JJMASeries.mqh
PriceSeries.mqh
3c_BB_Osc.mqh
into folder (directory): MetaTrader\experts\include\
JJRSX.mq4
Heiken Ashi#.mq4
nto folder (directory): MetaTrader\indicators\
*/
//+------------------------------------------------------------------+
//|                                                     3c_JJRSX.mq4 |
//|                               Copyright © 2006, Nikolay Kositsin |
//|                              Khabarovsk,   farria@mail.redcom.ru |
//+------------------------------------------------------------------+
#property copyright "Copyright © 2006, Nikolay Kositsin"
#property link      "farria@mail.redcom.ru"
//---- drawing the indicator in a separate window
#property indicator_separate_window
//---- number of the indicator buffers
#property indicator_buffers 8
//---- colors of the indicator
#property indicator_color1 Gray
#property indicator_color2 LimeGreen
#property indicator_color3 Red
#property indicator_color4 Purple
//---- Bollinger Bands colors
#property indicator_color5 Blue
#property indicator_color6 Blue
#property indicator_color7 Magenta
#property indicator_color8 Magenta
//---- width of the indicator lines
#property indicator_width1 2
#property indicator_width2 2
#property indicator_width3 1
#property indicator_width4 1
//---- style of the envelope line
#property indicator_style1 4
//---- style of Bollinger Bands line
#property indicator_style5 4
#property indicator_style6 4
#property indicator_style7 4
#property indicator_style8 4
//---- parameters of horizontal lines of the indicator
#property indicator_level1 0.0
#property indicator_levelcolor SteelBlue
#property indicator_levelstyle 4
//---- INPUT PARAMETERS OF THE INDICATOR
extern int  Length = 8;  // depth of JurX indicator smoothing
// depth of JJMA smoothing of the retrieved indicator
extern int  Smooth = 3;
// parameter changing within limits -100 ... +100, influences
// the quality of transient processes of smoothing
extern int  Phase = 100;
/* Selecting colors, based on which the indicator is calculated
(0-CLOSE, 1-OPEN, 2-HIGH, 3-LOW, 4-MEDIAN, 5-TYPICAL, 6-WEIGHTED,
7-Heiken Ashi Close, 8-SIMPL, 9-TRENDFOLLOW, 10-0.5*TRENDFOLLOW,
11-Heiken Ashi Low, 12-Heiken Ashi High,  13-Heiken Ashi Open,
14-Heiken Ashi Close.) */
extern int Input_Price_Customs = 0;
//---- Declaration of the function COUNT_begin() for counting the bar number,
// starting from which the indicator will be drawn and
// Bollinger Bands wikk be calculated
int COUNT_begin()
{int count_begin=2*Length+30;return(count_begin);}
//---- declaration of the function digits() for setting the accuracy format
// (number of signs after a decimal point) for the visualization
// of the indicator values
int digits(){return(2);}
//---- setting the indicator values, which will be invisible on the chart
int EmptyValue=0.0;
//---- Declaration of the name of the indicator
string Label = "JJRSX";

//---- Including into the indicator text its main text
#include <3c_BB_Osc.mqh>
//---- declaration of the function INDICATOR
//---- reference to the source indicator for retrieving the source values
double INDICATOR(int INDICATOR.bar)
 {
  return(iCustom( NULL, 0, "JJRSX", Length, Smooth, Phase,
         Input_Price_Customs, 0, INDICATOR.bar) );
 }
//---- ---------------------------------------------------------------+
過剰なコードは 3c_BB_Osc.mqh に入り、たった1行によりインディケータ内で表現されます。
#include <3c_BB_Osc.mqh>
mqh-file にはボリンジャーバンド用およびチャート表示スタイル選択用の外部変数もあります。当然、ファイル 3c_BB_Osc.mqh はフォルダ \MetaTrader\EXPERTS\INCLUDE に入れる必要があります。
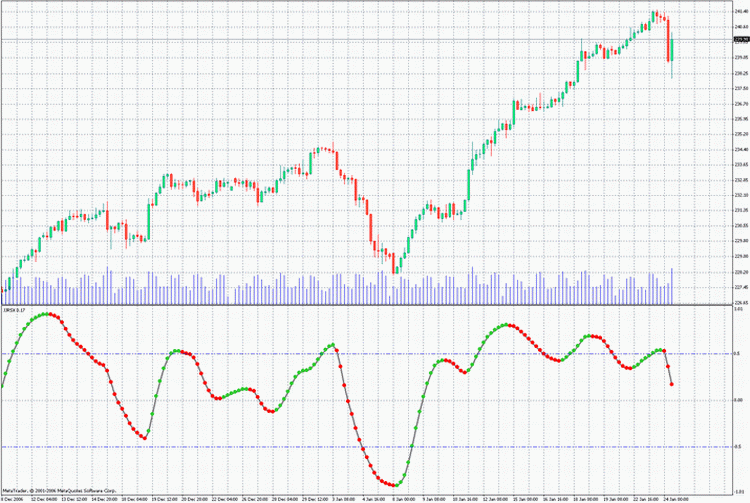
トリコロールインディケータ構築アルゴリズム
ここで、新しいトリコロールオシレータ作成のためには、このファイルに新しい名前をつけてフォルダ \MetaTrader\EXPERTS\indicators に保存し、以下の変更を加えるだけです。
1. インディケータエレメントとその他パラメータに希望の色を選びま。す
2. カスタムインディケータからコピーしてインディケータパラメータの新規インプットを挿入します。3. 関数 COUNT_begin() に開始バーをカウントする式を挿入します (通常、オシレータの追加の平滑化を行い、期間、または変数でこの変数の合計を決めるインディケータの外部変数を挿入するだけで十分です)。
4. 行
digits()
  {
    return(2);
  }
に必要なインディケータ制度値を挿入します。 インディケータが 0~100 に変化する場合はゼロを、 0~1 に変化する場合は2(小数点以下2つの符号)を挿入します。
5. チャートでは表示されないインディケータ値を設定します。
6. インディケータ名をつけます。
7. カスタムインディケータ iCustom() への参照を挿入します。その後、コードをコンパイルするとインディケータは準備できました!
もう一つ変更したい事柄jは、オシレータの形式をわずかになめらかにすることです。この場合、インディケータのテキスト it was のmqh ファイル名に文字 "J" を追加加するだけです。
#include <3c_BB_Osc.mqh>
現在は
#include <3c_BBJ_Osc.mqh>
ファイルを JMA でコンパイルするときは、カスタムオシレータの平滑化が行われます。
トリコロールインディケータ 3c_JJRSX2
インディケータをさらに改良することができます。もう一つモノクロのクイックを追加するとかなり便利でしょう。そうすることはひじょうに合理性でしょう。. 例の類似体によってインディケータを二分割します。コードの一部を mqh ファイルに入れます。それでインディケータ(3c_BB_Osc2.mqh)の知覚を最大限簡素化します。
/*
For the operation of the indicator place the files
JJMASeries.mqh
JurXSeries.mqh
PriceSeries.mqh
3c_BB_Osc2.mqh
into the folder (directory): MetaTrader\experts\include\
JJRSX.mq4
Heiken Ashi#.mq4
into the folder (directory): MetaTrader\indicators\
*/
//+------------------------------------------------------------------+
//|                                                    3c_JJRSX2.mq4 |
//|                               Copyright c 2006, Nikolay Kositsin |
//|                              Khabarovsk,   farria@mail.redcom.ru |
//+------------------------------------------------------------------+
#property copyright "Copyright c 2006, Nikolay Kositsin"
#property link      "farria@mail.redcom.ru"
//---- drawing the indicator in a separate window
#property indicator_separate_window
//---- the number of the indicator buffers
#property indicator_buffers 8
//---- colors of the indicator
#property indicator_color1 Gold
#property indicator_color2 LimeGreen
#property indicator_color3 Red
#property indicator_color4 Purple
//---- Bollinger Bands colors
#property indicator_color5 Blue
#property indicator_color6 Blue
#property indicator_color7 Magenta
#property indicator_color8 Magenta
//---- width of the indicator lines
#property indicator_width1 1
#property indicator_width2 2
#property indicator_width3 1
#property indicator_width4 1
//---- style of the envelope line
#property indicator_style1 4
//---- style of Bollinger Bands lines
#property indicator_style5 4
#property indicator_style6 4
#property indicator_style7 4
#property indicator_style8 4
//---- parameters of the horizontal levels of the indicator
#property indicator_level1  0.0
#property indicator_level2  0.8
#property indicator_level3 -0.8
//---- INPUT PARAMETERS OF THE INDICATOR
//---- input parameters of the quick monochromic JJRSX
extern int  Length1 = 8;  // depth of JurX smoothing of the indcator
// depth of JJMA smoothing of the retrieved indicator
extern int  Smooth1 = 3;
// parameter changing within limits -100 ... +100,
//influences the quality of transient process of smoothing
extern int  Phase1 = 100;
//Selecting prices, based on which the indicator will be calculated
extern int Input_Price_Customs1 = 0;
/*(0-CLOSE, 1-OPEN, 2-HIGH, 3-LOW, 4-MEDIAN, 5-TYPICAL, 6-WEIGHTED,
7-Heiken Ashi Close, 8-SIMPL, 9-TRENDFOLLOW, 10-0.5*TRENDFOLLOW,
11-Heiken Ashi Low, 12-Heiken Ashi High,  13-Heiken Ashi Open,
14-Heiken Ashi Close.) */
//---- input parameters of the slow tricolor JJRSX
extern int  Length2 = 40;  // depth of JurX smoothing of the inidcator
// depth of JJMA smoothing of the retrieved indicator
extern int  Smooth2 = 12;
// parameter changing within limits -100 ... +100,
// influences the quality of transient process of smoothing
extern int  Phase2 = 100;
// Selecting prices, based on which the indicator will be calculated
extern int Input_Price_Customs2 = 0;
/*(0-CLOSE, 1-OPEN, 2-HIGH, 3-LOW, 4-MEDIAN, 5-TYPICAL, 6-WEIGHTED,
7-Heiken Ashi Close, 8-SIMPL, 9-TRENDFOLLOW, 10-0.5*TRENDFOLLOW,
11-Heiken Ashi Low, 12-Heiken Ashi High,  13-Heiken Ashi Open,
14-Heiken Ashi Close.)*/
//---- The style of performing the horizontal lines of the indicators
extern int    Levels_Style = 3;         // Style of levels lines
extern int    Levels_Width = 0;         // Width of leevls lines
extern color  Levels_Color = SlateGray; // color of levels lines
//---- Declaration of the function COUNT_begin() for counting the bar number,
// starting from which the indicator will be drawn and
// Bollinger Bands will be calculated
int COUNT_begin(){int count_begin=2*Length2+30;return(count_begin);}
//---- declaration of the function digits() for setting the accuracy format
//(number of signs after the decimal point) for the visualization of the
//indicator values
int digits(){return(2);}
//---- setting the indicator values, which will be invisible on the chart
int EmptyValue=0.0;
//---- Determining the indicator name
string Label = "JJRSX";

//---- Including into the indicator text its main text
#include <3c_BB_Osc2.mqh>
//---- declaration of the function INDICATOR1
//---- reference to the source indicator for retrieving source values
double INDICATOR1(int INDICATOR1.bar)
 {
  return(iCustom( NULL, 0, "JJRSX", Length1, Smooth1, Phase1,
         Input_Price_Customs1, 0, INDICATOR1.bar) );
 }
//---- declaration of the function INDICATOR2
//---- reference to the source indicator for retrieving source values
double INDICATOR2(int INDICATOR2.bar)
 {
  return(iCustom( NULL, 0, "JJRSX", Length2, Smooth2, Phase2,
         Input_Price_Customs2, 0, INDICATOR2.bar) );
 }
//---- --------------------------------------------------------------+
インディケータはあまり複雑になりませんでした。これでこのインディケータにはカスタムインディケータ JJRSX への参照が2つ、JJRSX インディケータの数に等しい外部インディケータパラメータのグループが2つあります。別のオシレータを基にした類似チャートを作成するためのテンプレートとしてこれらインディケータを使うのに何の問題もないはずです。
トリコロール移動平均
ここからトリコロール移動平均を書くバリアントについて説明します。最初のサイトでは、1番目の例で説明したコードのまったくの類似体を書くことができました。ですが、前回のチャートにはあるデメリットがある可能性があります。バーごとに変動不幸が変われば、色の並置があり、それは正常ではありません。この欠点を避ける唯一の方法はバッファをもう3個使用することです。追加の3つのバッファは、過剰コードが mqh ファイルに入れられる場合、インディケータを長くしすぎないようです。トリコロール移動平均を書くことについては、前のものと同じです。
/*
For the operation of the indicator place files
JJMASeries.mqh
PriceSeries.mqh
3Color.mqh
into folder (directory): MetaTrader\experts\include\
J2JMA.mq4
into folder (directory): MetaTrader\experts\indicators\
*/
//+------------------------------------------------------------------+
//|                                                     3c_J2JMA.mq4 |
//|                           Copyright c 2006,     Nikolay Kositsin |
//|                              Khabarovsk,   farria@mail.redcom.ru |
//+------------------------------------------------------------------+
#property copyright "Copyright c 2006, Nikolay Kositsin"
#property link "farria@mail.redcom.ru"
//---- drawing the indicator in the main window
#property indicator_chart_window
//---- number of indicator buffers
#property indicator_buffers 6
//---- indicator colors
#property indicator_color1 Blue
#property indicator_color2 Blue
#property indicator_color3 Red
#property indicator_color4 Red
#property indicator_color5 Gray
#property indicator_color6 Gray
//---- INPUT PARAMETERS OF THE INDICATOR
extern int Length1 = 5;   // depth of the first smoothing
extern int Length2 = 5;   // depth of the second smoothing
// parameter of the first smoothing, changing within limits -100 ... +100,
//influences the quality of the transient process;
extern int Phase1  = 100;
// parameter of the second smoothing, changing within limits -100 ... +100,
//influences the quality of the transient process;
extern int Phase2  = 100;
/* Choosing prices, based on which the indicator is calculated
(0-CLOSE, 1-OPEN, 2-HIGH, 3-LOW, 4-MEDIAN, 5-TYPICAL, 6-WEIGHTED,
7-Heiken Ashi Close, 8-SIMPL, 9-TRENDFOLLOW, 10-0.5*TRENDFOLLOW,
11-Heiken Ashi Low, 12-Heiken Ashi High,  13-Heiken Ashi Open,
14-Heiken Ashi Close.) */
extern int Input_Price_Customs = 0;
//---- declaration of the function digits() to set up the accuracy format
// (number of signs after the decimal point) for the visualization of the
// indicator values
int digits(){return(Digits);}
//---- Declaration of the function COUNT_begin() for calculation of the bar number,
//starting from which the indicator will be drawn
int COUNT_begin(){return(60);}
//---- setting the indicator parameters, which will be invisible on the chart
int  EmptyValue=0;
//---- lable for the indicator
string Label="J2JMA";
//---- inserting into the indicator text its main text
#include <3Color.mqh>
//---- declaration of the function INDICATOR
//---- reference to the source indicator to retrieve source values
double INDICATOR(int INDICATOR.bar)
 {
  return(iCustom(NULL,0,"J2JMA",Length1,Length2,Phase1,Phase2,0,
         Input_Price_Customs,0,INDICATOR.bar) );
 }
//---- --------------------------------------------------------------+
移動平均に対しては、移動平均の制度の形式を設定する際、何も変更してはいけないことに注意が必要です。
int digits()
  {
    return(Digits);
  }
3色のバリアントで表示したい移動平均が不安定な場合、簡単に平滑化が可能です。次の行
#include <3Color.mqh>
に文字 "J" を追加するだけです。すると以下を取得します。
#include <3ColorJ.mqh>
インディケータテンプレート-大きなタイムフレームでの構築
おおきなタイムフレームをもと基に構築されるインディケータテンプレートがもう 2 つあります。それらもどんな移動平均やオシレータを基にしても作成可能です。
//----+ - - - - - - - - - - - - - - - - - - - - - - - - - - - - - - -+
//Version  July 1, 2006                                              |
//Editing   Nikolay Kositsin  15.06.2006  farria@mail.redcom.ru      |
//----+ - - - - - - - - - - - - - - - - - - - - - - - - - - - - - - -+
/*
Building a moving average on the current timeframe based on another,
larger timeframe. Attention!!!Indicator values are recalculated not
on the last bar, but on the number of bars, equivalent to a
candlestick of the large timeframe!

For the operation of the indicator place files
JJMASeries.mqh
PriceSeries.mqh
HTF.mqh
into folder (directory): MetaTrader\experts\include\
J2JMA.mq4
Heiken Ashi#.mq4
into folder (directory): MetaTrader\indicators\
*/
//+------------------------------------------------------------------+
//|                                                    J2JMA_htf.mq4 |
//|                            Copyright c 2005, GS  Conversion only |
//|                    http://www.gustis.narod.ru/;     gsb51@mail.ru |
//+------------------------------------------------------------------+
#property copyright "  Copyright c 2005, GS  Conversion only"
#property link      " http://www.gustis.narod.ru/;     gsb51@mail.ru"
//---- drawing the indicator in the main window
#property indicator_chart_window
//---- number of indicator buffers
#property indicator_buffers  4
//---- indicator colors
#property indicator_color1 BlueViolet
#property indicator_color2 Lime
#property indicator_color3 Red
#property indicator_color4 Gray
//---- width of indicator lines
#property indicator_width1 3
#property indicator_width2 1
#property indicator_width3 1
#property indicator_width4 3
//---- style of indicator lines
#property indicator_style1 0
//---- INPUT PARAMETERS OF THE INDICATOR
//Parameters of custom indicator iCustom
extern int Length1 = 5;   // depth of the first smoothing
extern int Length2 = 5;   // depth of the second smoothing
// parameter of the first smoothing, changing within limits -100 ... +100,
//influences the quality of the transient process;
extern int Phase1  = 100;
// parameter of the second smoothing, changing within limits -100 ... +100,
//influences the quality of the transient process;
extern int Phase2  = 100;
//Choosing prices, based on which the indicator is calculated
extern int Input_Price_Customs = 0;
/*
//---- INPUT PARAMETERS HTF +--------------------------------------------+
extern int  TFrame_Period = 240; // The larger period in minutes
// smoothing of the moving average. The most optimal value is equal
// to the relation of the larger timeframe periods to the chart period
extern int         Smooth = 48;
extern bool Trend_Visible = true;// visualization of the trend indication
// minimal speed of the moving average, considered as a trend
extern int  Trend_Minimum = 5;
extern int         Shift  = 0;   // shift of the indicator along the time axis
*/
//---- declaration of the function digits() to set up the accuracy format
// (number of signs after the decimal point) for the visualization of the
// indicator values
int digits(){return(Digits);}
//---- setting the indicator parameters, which will be invisible on the chart
int EmptyValue=0;
string Label="J2JMA";
//---- inserting into the indicator text its main text
#include <HTF.mqh>
//---- declaration of the function INDICATOR
//---- reference to the source indicator to retrieve source values
double INDICATOR(int INDICATOR.bar)
 {
  return(iCustom(NULL,TFrame_Period,"J2JMA",Length1,Length2,Phase1,Phase2,
         0,Input_Price_Customs,0,INDICATOR.bar) );
 }
//---- -----------------------------------------------------------+
移動平均の正常処理のために両方のチャートが開いている必要あります。両チャートの履歴データはすべて同じブローカーからのものでなければならないことに留意します。
最終の移動平均についての注意事項は、それが一見示すトレンドの性質において、それをにアタッチすることには意味がない、ということです。それがどんな奇跡を約束したところで、現実には起こりっこないのです。移動平均は現在のタイムフレームの最中バーで再計算されるのではなく、大きなタイムフレームの最中バーで計算されます。こようにシューポスの労働をなんどやってみたところで、予想通り何ももたらさなかったのです。
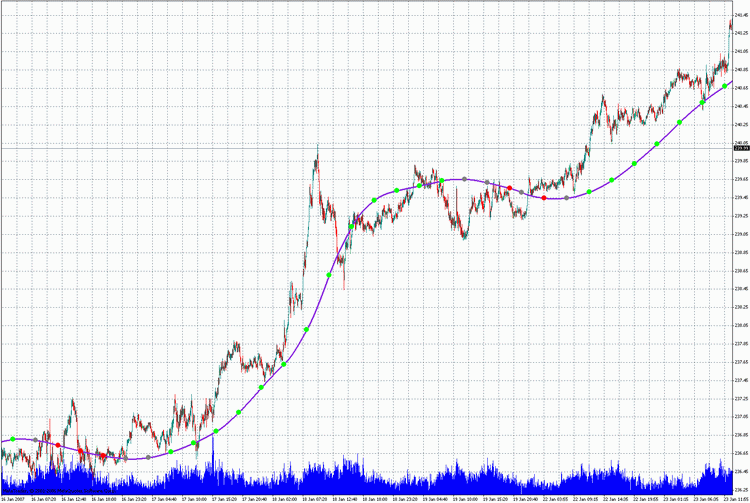
この場合、アルゴリズムの主要なポイントを説明する必要があります。それはこのインディケータの基礎です。インディケータが作成される値は大きなタイムフレームのバーから採られます。価格の平滑化後、行が計算され、取得された値は小さなタイムフレームに転送されます。欠けている小さなタイムフレームの中間値は線形補間法によって追加されます。ただチャートは折れ線正式なため、われわれは自然とそれを滑らかにしたいと思います。このインディケータでそれができるのです!
その変換ののち、この曲線はむしろ優雅な形を手に入れますが、まだ大きなタイムフレームのろうそく足の一つに等しい小さなタイムフレームのバー数で計算されています。最終的に、mqhファイルに過剰なプログラムコードを入れる機能はインディケータのみならずエキスパート構築にも特に便利であることに留意します。それにより多大な労力の節約につながり、ルーチンから解放され、プログラミングがむしろ魅力的で興味深い仕事となります。
/*
//----+ - - - - - - - - - - - - - - - - - - - - - - - - - - - - - - -+
//Version  July 1, 2006                                              |
Editing   Nikolay Kositsin  15.06.2006  farria@mail.redcom.ru        |
//----+ - - - - - - - - - - - - - - - - - - - - - - - - - - - - - - -+
Building a moving average on the current timeframe based on another,
larger timeframe. Attention!!!Indicator values are recalculated not
on the last bar, but on the number of bars, equivalent to a
candlestick of the large timeframe!

For the operation of the indicator place files
JJMASeries.mqh
PriceSeries.mqh
HTF_Channal.mqh
into folder (directory): MetaTrader\experts\include\
J2JMA.mq4
Heiken Ashi#.mq4
into folder (directory): MetaTrader\indicators\
*/
//+------------------------------------------------------------------+
//|                                            J2JMA channel_htf.mq4 |
//|                            Copyright c 2005, GS  Conversion only |
//|                    http://www.gustis.narod.ru/;     gsb51@mail.ru |
//+------------------------------------------------------------------+
#property copyright "  Copyright c 2005, GS  Conversion only"
#property link      " http://www.gustis.narod.ru/;     gsb51@mail.ru"
//---- drawing the indicator in the main window
#property indicator_chart_window
//---- number of indicator buffers
#property indicator_buffers  6
//---- indicator colors
#property indicator_color1 BlueViolet
#property indicator_color2 Gray
#property indicator_color3 Gray
#property indicator_color4 Lime
#property indicator_color5 Red
#property indicator_color6 Gray
//---- width of indicator lines
#property indicator_width1 3
#property indicator_width2 0
#property indicator_width3 0
#property indicator_width4 1
#property indicator_width5 1
#property indicator_width6 1
//---- style of indicator lines
#property indicator_style1 0
#property indicator_style2 4
#property indicator_style3 4
//---- INPUT PARAMETERS OF THE INDICATOR
//Parameters of custom indicator iCustom
extern int Length1 = 5;   // depth of the first smoothing
extern int Length2 = 5;   // depth of the second smoothing
// parameter of the first smoothing, changing within limits -100 ... +100,
//influences the quality of the transient process;
extern int Phase1  = 100;
// parameter of the second smoothing, changing within limits -100 ... +100,
//influences the quality of the transient process;
extern int Phase2  = 100;
//Choosing prices, based on which the indicator is calculated
extern int Input_Price_Customs = 0;
/*
//---- INPUT PARAMETERS HTF +--------------------------------------------+
extern int  TFrame_Period = 240; // The larger period in minutes
extern int         Smooth = 48;  // smoothing of the moving average
extern bool Trend_Visible = true;// visualization of the trend indication
// minimal speed of the moving average, considered as a trend
extern int  Trend_Minimum = 5;
extern int         Shift  = 0;   // shift of the indicator along the time axis
*/
//---- declaration of the function digits() to set up the accuracy format
// (number of signs after the decimal point) for the visualization of the
// indicator values
int digits(){return(Digits);}
//---- setting the indicator parameters, which will be invisible on the chart
int EmptyValue=0;
string Label="J2JMA";
//---- inserting into the indicator text its main text
#include <HTF_channel.mqh>
//---- declaration of the function INDICATOR
//---- reference to the source indicator to retrieve source values
double INDICATOR(int INDICATOR.bar)
 {
  return(iCustom(NULL,TFrame_Period,"J2JMA",Length1,Length2,Phase1,Phase2,
         0,Input_Price_Customs,0,INDICATOR.bar) );
 }
//-------------------------------------------------------------------+
おわりに
本稿では、mqhファイルにある利用可能なコードのフラグメントを基にトリコロールチャートとトリコロール移動平均の構築を分析しました。上述のトリコロールインディケータ構築手順、およびテンプレートとして提供されている例を利用して、あらゆる移動平均やオシレータに基づく類似のインディケータを簡単に作成することが可能です。この方法で、インディケータを作成し、別のタイムフレームからのデータを表示します。これはかなり便利なことです。チャートに入れると、同時に異なる時間スケールで行われる処理を観測することができるのです。
zip ファイル NK_library.zip には平滑化の異なるアルゴリズムを使って書かれたインディケータが100件以上入っています。これらインディケータは先に述べた例を使って別の類似したインディケータの書き方を学習するには十分すぎるほどです。平滑化関数のバージョンを伴う zip ファイルのインディケータはすべて、エラーなく Expert Advisors で処理を行います。zip ファイルのインディケータをクライアントターミナルのフォルダ MetaTrader 4: \MetaTrader\EXPERTS\indicators に保存してください。平滑化関数とプログラムコードのフラグメントはフォルダ INCLUDE にあります。このフォルダのファイルはすべてクライアントターミナルのフォルダ MetaTrader 4: \MetaTrader\EXPERTS\INCLUDE に保存する必要があります。
MetaQuotes Ltdによってロシア語から翻訳されました。
元の記事: https://www.mql5.com/ru/articles/1451
警告: これらの資料についてのすべての権利はMetaQuotes Ltd.が保有しています。これらの資料の全部または一部の複製や再プリントは禁じられています。
この記事はサイトのユーザーによって執筆されたものであり、著者の個人的な見解を反映しています。MetaQuotes Ltdは、提示された情報の正確性や、記載されているソリューション、戦略、または推奨事項の使用によって生じたいかなる結果についても責任を負いません。
 Forex トレーディングのイロハ
 ラグを最小に抑えた有効な平均化アルゴリズム:インディケータでの使用
 インディケータコードから Expert Advisor コードへの変換インディケータストラクチャ
 アンチウイルスソフトとファイアウォール下でのMetaTrader 4
- 無料取引アプリ
- 8千を超えるシグナルをコピー
- 金融ニュースで金融マーケットを探索